INTRODUCTION
Early workers determined that the nature of the geological substrate and the resulting soil was a key factor in determining the composition of plant assemblages and the vegetation formations associated with them (Salisbury Reference SALISBURY1920). In the case of calcium-rich (‘calcicolous’) regions, particularly those forming karst landscapes, these earlier observations were expanded to the point where whole regional floras were identified, defined by the underlying substrate. The consequential structuring of animal assemblages has been less well studied. The association of karst formations with bat diversity is well-known (Chapman Reference CHAPMAN1993, Struebig et al. Reference STRUEBIG, KINGSTON, ZUBAID, LE COMBER, ADNAN, TURNER, KELLY, BOZEK and ROSSITERA2009), and specific associations between particular birds and limestone landscapes is also recognized (Mansor et al. Reference MANSOR, SAH, LIM and RAHMAN2011, Rahman et al. Reference RAHMAN, DIE, FONG, JOWSHIP, PANDONG, HAZALI and MARNI2004). Within the invertebrates, the relationship between environments rich in calcium carbonate and the diversity of shell-bearing gastropods is well established (Schilthuizen et al. Reference SCHILTHUIZEN, CHAI, KIMSIN and VERMEULEN2003, Reference SCHILTHUIZEN, LIEW, ELAHAN and LACKMAN-ANCRENAZ2005). Chalk and limestone landscapes have long been associated with particular butterfly assemblages (Dennis Reference DENNIS2012). Assemblages of other terrestrial invertebrates associated with calcicolous environments, however, are less well known to naturalists.
Most of these general statements are based on work in temperate regions of Europe and North America (although we have quoted other references where they exist). In the tropics, again, it is karst landscapes in particular that have received, and continue to receive, the attention of researchers (Clements et al. Reference CLEMENTS, SODHI, SCHILTHUIZEN and NG2006). The focus again has been on vegetation, selected vertebrate species and gastropods. Isolated outcrops of limestone and well-defined areas of karst have high levels of endemism and their conservation importance is becoming widely recognized (Clements et al. Reference CLEMENTS, SODHI, SCHILTHUIZEN and NG2006).
The diversity of insect herbivores found in a particular patch of forest is increasingly being thought of as a function of underlying plant diversity: all else being equal, the greater the diversity of available food resources, the greater will be the diversity of the associated phytophages (Novotny et al. Reference NOVOTNY, BASSET, MILLER, KITCHING, LAIDLAW, DROZD and CIZEK2004, Reference NOVOTNY, DROZD, MILLER, KULFAN, JANDA, BASSET and WEIBLEN2006). Accordingly, where there is a known environmental factor such as substrate type driving the vegetation composition, then we predict that driver will have an indirect impact on the assemblage of associated insect herbivores.
The Xishuangbanna Dai Autonomous Region in the extreme south-west of Yunnan, China, presents a fragmented landscape with remnant forest patches on limestone-derived substrates intermixed with other, principally alluvial soils. It provides an ideal situation to test the contention that herbivore assemblages will be driven by substrate type. There is a rich background of vegetation research in the region (Cao et al. Reference CAO, ZOU, WARREN and ZHU2006, Lan et al. Reference LAN, HU, CAO, ZHU, WANG, ZHOU, DENG, CUI, HUANG, LIU, XU, SONG and HE2008, Zhu et al. Reference ZHU, CAO and HU2006) including explicit studies of the limestone flora (Wang et al. Reference WANG, ZHU and LI1997, Zhu Reference ZHU2002, Zhu et al. Reference ZHU, WANG, LI and XU1996, Reference ZHU, WANG and LI1998, Reference ZHU, WANG, LI and SIRIRUGSA2003) and the impacts of forest fragmentation (Zhu et al. Reference ZHU, XU, WANG and LI2004). There are few, if any, parallel zoological studies although several workers have examined soil arthropods in calcicolous landscapes elsewhere in China (Chen et al. Reference CHEN, FAN, ZHAO, WANG, XUE and ZHOU2011, Fan et al. Reference FAN, XIONG and CHEN2013). The readily sampled, herbivorous, night-flying Lepidoptera are particularly diverse in the region and provide an ideal tool for looking at the second-order effects of substrate on faunal diversity.
We have used this combination of factors to test the hypothesis that there will be particular herbivore faunas associated with rain-forest remnants occurring on particular substrates. We base this hypothesis on the expectation that the adult Lepidoptera encountered in a particular location will reflect the available larval food-plants in the vicinity. We further expect that, if this is the case, there will be a subset of lepidopteran taxa which drives any such relationship. These community-structuring species will be of importance in trying to understand the observed diversity within these forests.
METHODS
Study sites
The region surrounding the Xishuangbanna Tropical Botanical Gardens is a mixed landscape in which remnants of tropical rain forest lie within a matrix of human settlements, disturbed riparian vegetation, agricultural land, and, increasingly and pervasively, rubber plantations. At higher elevations, tea gardens may be mixed with or replace rubber as an extensive single-species plantation crop (Li et al. Reference LI, AIDE and MA2007, Reference LI, MA and LIU2009). The underlying geology and pedology is complex but comprises outcroppings of limestone within a mix of sedimentary deposits (Cao et al. Reference CAO, ZOU, WARREN and ZHU2006). Broadly rain-forest remnants may be classed as associated with a limestone or an alluvial base (Figure 1).

Figure 1. Map of the study region within the Xishuangbanna Dai Autonomous Prefecture, southern Yunnan, China, showing sampling sites and limestone and alluvial forest remnants in 2003. The map was compiled in ArcMap 10.1.
Cao & Zhang (Reference CAO and ZHANG1997) compare and contrast the dominant trees of remnant forests in the region. The alluvial forests (as we refer to them here) are tropical seasonal rain forests, recorded by Cao & Zhang (Reference CAO and ZHANG1997) as dominated by tree species such as Pometia tomentosa (Sapindaceae), Terminalia myriocarpa (Combretaceae), Semecarpus reticulata, Dracontomelon macrocarpum (Anacardiaceae) and Ficus altissima (Moraceae). The dipterocarp species Shorea chinensis, although present to the south of the sites, does not occur in the remnants studied. The limestone sites are clothed in monsoon forest dominated by tree species such as Tetrameles nudiflora (Tetrameleaceae), Cleistanthus sumatranus (Phyllanthaceae), Garuga pinnata (Burseraceae) and Dracaena cochinchinesis (Asparagaceae).
The average annual temperature for the region is 21.4°C. The summer climate is dominated by warm, wet air masses that move eastwards from the Indian Ocean. Cooler, drier continental air masses drive the winter climate. Average annual rainfall is 1539 mm of which over 80% falls in the summer wet season (Cao & Zhang Reference CAO and ZHANG1997).
Sampling design
We selected eight sampling sites for study, four on limestone geology and four on alluvium. Choice of sites was based on accessibility and availability. Inter-site distances ranged from 1.79 to 13.56 km (mean, all pairs of sites 7.82 ± 0.77 km; alluvial sites 7.12 ± 2.19 km, limestone sites 7.32 ± 2.19 km) (Figure 1). Pennsylvania-style light traps, modified for use in rain forests, were used (Kitching et al. Reference KITCHING, BOULTER, VICKERMAN, LAIDLAW, HURLEY and GRIMBACHER2005). Pennsylvania light traps are similar in design to the familiar Heath traps (Heath Reference HEATH1965). Unlike the larger Robinson or Rothamsted (and other) traps (Robinson & Robinson Reference ROBINSON and ROBINSON1950, Williams Reference WILLIAMS1948), traps of this kind are designed to sample a very local area and not to garner as large a sample as possible from the largest possible area (Beck & Linsenmair Reference BECK and LINSENMAIR2006, Taylor & French Reference TAYLOR and FRENCH1974). Pennsylvania traps use a vertical actinic tube powered by a 12-v battery. The light is surrounded by three transparent vanes suspended over a collecting bucket. Rain-forest-specific modifications include a rain cover above and a battery holder beneath the trap so that the whole can be hung as an independent unit. Traps were placed within rain-forest remnants suspended at head height from suitable branches. Three traps were deployed at each sampling site placed so as to be visually independent of each other. Because the response of moths to traps during any particular night is highly dependent on current and unpredictable local conditions, a target size of sample was established. Essentially we aimed to sample at least 70 individuals of the target taxa (or as close to that number as could reasonably be achieved) from each trap. The number of trap nights within each remnant, therefore, varied from three to ten trap nights. Traps remained ‘open’ all night in every case. The two days each side of the full moon were avoided. Actual catches per trap varied from 69 to 210 and per site from 253 to 502. Catches from the three traps positioned at each site were combined, except for the indicator value (IndVal) analysis where each trap was treated separately. All trapping was carried out between 4 September 2004 and 10 October 2004.
Catches were returned to the laboratory and all macro-moths plus Pyraloidea were recovered from the catches. The ‘macro-moths’ in this case included the clade currently designated as Obtectomera (Regier et al. Reference REGIER, MITTER, ZWICK, BAZINET, CUMMINGS, KAWAHARA, SOHN, ZWICK, CHO, DAVIS, BAIXERAS, BROWN, PARR, WELLER, LEES and MITTER2013) plus superfamilies conventionally considered as ‘macros’ by lepidopterists (in this case the Hepialoidea, Cossoidea and Zygaenoidea). All were sorted into morphospecies and counted. A mounted reference collection was established and, subsequently, deposited at the Xishuangbanna Tropical Botanical Gardens.
To produce forest maps for Xishuangbanna at or near the time of sampling, we compiled Figure 1 in ArcMap 10.1 using the ESRI MapServer ‘world_imagery’ file for 2003 (http://services.arcgisonline.com/arcgis/rest/services/World_Imagery/MapServer). The base layer is composed of three layers of data of varied resolution, allowing an accuracy of 2.5 m (based on SPOT imagery) to 15 m (based on TerraColor imagery) for the region surrounding XTBG. Each vegetation class of interest was digitized manually using the highest resolution cloud-free data for the region, and the two forest types (alluvial and limestone) differentiated based on topography and ground-truthed data to determine limestone and non-limestone areas. We used this forest map to calculate the area of each forest fragment using QGIS software. The elevation and aspect were derived from the digital elevation model ASTER GDEM (USGS/NASA) (30 m resolution) for all eight study plots.
Analysis
We designed our analyses around a sequence of four basic questions, followed by a statistical identification of species indicative of each substrate type.
Are there differences in diversity between the alluvial and limestone assemblages of moths?
We used measures of abundance, species richness, and three complimentary composite diversity indices – the exponential of the Shannon index, the inverse of the Simpson index and the Shannon measure of evenness (Jost Reference JOST2006, Magurran Reference MAGURRAN2003). We tested the significance of differences in these values for alluvial and limestone forests using simple t-tests. All diversity calculations were conducted using the vegan package (R package version 2.0–10. http://CRAN.R-project.org/package = vegan).
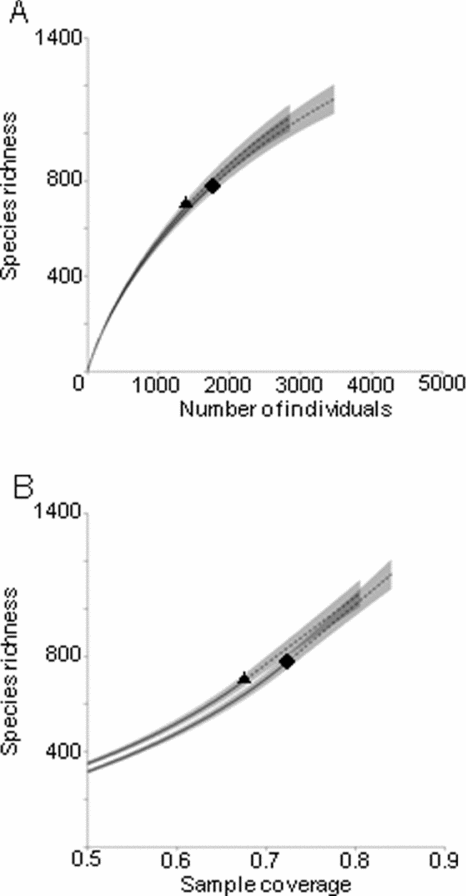
How well was the fauna in each forest type sampled?
We used individual-based and coverage-based rarefaction curves (Chao & Jost Reference CHAO and JOST2012) to address this question. Individual-based rarefaction curves plot species richness against a given number of individuals selected randomly from the observed samples until all individuals have been accumulated (Colwell et al. Reference COLWELL, CHAO, GOTELLI, LIN, MAO, CHAZDON and LONGINO2012). Coverage-based rarefaction curves, on the other hand, plot species richness against rarefied sample completeness, which is the estimated proportion of the total number of individuals in a community represented by the species sampled (Chao & Jost Reference CHAO and JOST2012). For both types of rarefaction curves, we used 100 replicate bootstrapping to estimate 95% confidence intervals. Rarefaction curves were generated using the iNEXT package (iNEXT: iNterpolation and EXTrapolation for species diversity. R package version 1.0. http://chao.stat.nthu.edu.tw/blog/) in R.
Were there differences in species composition between sites within each forest type (i.e. within soil-type ‘beta’-diversity)?
For this we used a methodology based on diversity partitioning. We used additive partitioning of species richness to partition alpha and beta from gamma diversities. That is: we calculated our beta (β) values from the relationship:
 \begin{equation*}
{\rm \beta } = {\rm \gamma - \alpha }
\end{equation*}
\begin{equation*}
{\rm \beta } = {\rm \gamma - \alpha }
\end{equation*}
where γ is the total number of species encountered within each forest type and α is the mean number of species encountered at each sampling site within the particular forest type. The significance of alpha and beta diversities were calculated using Partition 3.0 software (PARTITION: software for hierarchical partitioning of species diversity. version 3.0. http://www.users.muohio.edu/cristto/partition.htm.) using 4999 randomizations.
Do the two substrate types have different associated assemblages of moths?
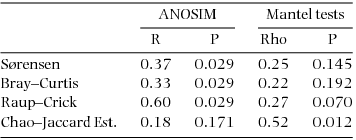
We calculated assemblage similarities using four types of similarity index and then by ordinations based on these indices. Each of the indices uses a different, complimentary, basis on which to calculate similarity and hence provides different insights into the similarities and differences between the two classes of sites. The Sørensen index calculates assemblage similarities based on simple presence/absence data; Bray–Curtis similarities incorporate relative abundance of the species (Jost et al. Reference JOST, CHAO, CHAZDON, Magurran and McGill2011); the Raup–Crick index (Chase et al. Reference CHASE, KRAFT, SMITH, VELLEND and INOUYE2011) returns a probabilistic resemblance measure which calculates the probability that observed sites have a greater number of shared species than two sites with species drawn at random from the species pool of a given habitat; and, finally, the Chao–Jaccard index (Chao et al. Reference CHAO, CHAZDON, COLWELL and SHEN2005, Reference CHAO, CHAZDON, COLWELL and SHEN2006) makes estimates of shared species based on the number of observed rare, shared species between two sites. In calculating the Sørensen, Bray–Curtis and Raup–Crick indices, all species that were represented by single individuals were excluded. The Bray–Curtis index was calculated using log-transformed proportional abundances. All similarity indices were calculated using the vegan package in R.
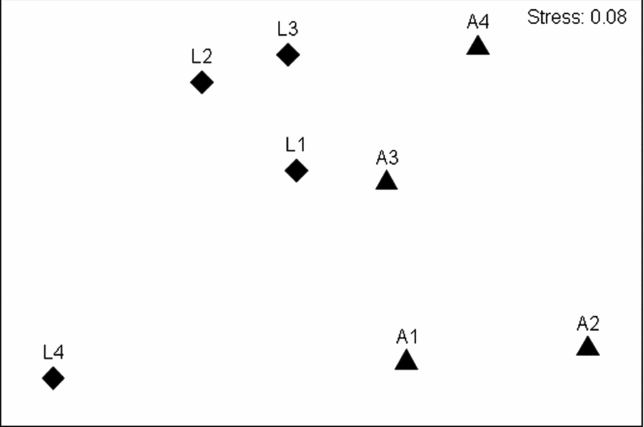
Similarity matrices of these four indices were then used to generate non-metric multi-dimensional scaling (NMDS) ordinations (with 25 random restarts to find the lowest stress values) using PRIMER 6 software (Clarke & Gorley Reference CLARKE and GORLEY2006). The differences in assemblage composition between limestone and alluvial forests were tested using the ANOSIM routine available within PRIMER 6. We also tested whether changes in the assemblage compositions were related to the geographic proximities of the sites using the RELATE routine. Geographic proximities were calculated using Euclidean distances among the normalized latitude and longitude coordinates of the sites. The potential influences of other environmental factors (aspects, altitude and forest area) were investigated using the step-wise selection procedure available in the DistLM (Distance-based linear model) routine of PRIMER 6 and PERMANOVA+ add-on software (Anderson et al. Reference ANDERSON, GORLEY and CLARKE2008).
Finding indicator species
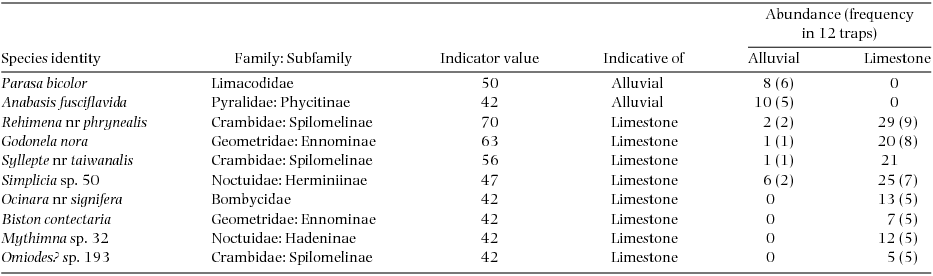
To find species characteristic of limestone or alluvial forests, we used the indicator value protocol developed by Dufrêne & Legendre (Reference DUFRÊNE and LEGENDRE1997), using the labdsv package in R (labdsv: Ordination and Multivariate Analysis for Ecology. R package, version 1.6–1. http://CRAN.R-project.org/package=labdsv.). The indicator values combine a measure of specificity (relative abundance) and fidelity (relative frequency) of a species in a given habitat type, to calculate percentage indicator values (IndVals) for each species. Indicator value of 100% can be attained when a species is found from all of the samples (maximum fidelity) within a particular habitat (maximum specificity). We selected species which had significant indicator values based on 4999 permutations of the samples. We used individual traps (N = 12 per forest type) for indicator value analysis to measure fidelity. McGeoch et al. (Reference MCGEOCH, VAN RENSBURG and BOTES2002) have suggested that a benchmark of 70% be adopted as an indicator value when designating a ‘strong’ indicator.
RESULTS
A total of 3165 moths was collected (1426 individuals in alluvial and 1739 in limestone locations), representing 1255 morphospecies. Despite the large number of species found, relatively few species were widespread and the majority of them were either represented by a single (756 species) or a pair (216 species) of individuals. There were no significant differences between alluvial and limestone forest in values of average abundance, species richness or any of the diversity indices used.
Both coverage-based and individual-based rarefaction curves showed similar trajectories for both alluvial and limestone forests, with 95% confidence intervals of extrapolated curves overlapping with each other (Figure 2). Both partitioned alpha and beta diversities showed similar proportional values between alluvial and limestone forests (alpha diversities: alluvial forest 31.5%; limestone forest 32.6%. Beta diversities: alluvial forest 68.5%; limestone forest 67.4%). In all cases these were significantly different than would be expected by chance. Alpha diversities were lower than expected (alluvial expected, 255 ± 7.15; limestone expected, 292 ± 8.32). Beta diversities, in contrast, were higher than expected (alluvial expected, 449 ± 7.85; limestone expected, 481 ± 7.43). Error terms quoted are the 95% confidence limits in each case.
Figure 2. Individual-based (a) and coverage-based (sample completeness) (b) rarefaction curves for moths sampled from alluvial (triangle) and limestone (square) forests in Xishuangbanna, Yunnan, China. These curves were extrapolated to twice the observed numbers of individuals. Grey areas indicate 95% confidence intervals.
Despite obvious and marked similarities in values of the similarity indices used and partitioned diversities, an NMDS ordination based on Bray–Curtis similarity values (Figure 3) as well as Sørensen and Raup–Crick indices (results not shown) indicated clear differences between the species compositions of alluvial and limestone forests. An ANOSIM confirmed, statistically, that assemblage compositions measured by Bray–Curtis, Sørensen and Raup–Crick indices were significantly different between the two forest types (Table 1). Interestingly, however, this was not the case for the Chao–Jaccard estimated index which indicated no significant difference between the forest types. In that case, also uniquely, the analysis suggested that the similarities in assemblage compositions were significantly correlated with geographic distances among the sites (Table 2). The DistLM routine found no other environmental factors significantly related to any of the four similarity measures.
Table 1. Analysis of similarity values between assemblages of moths from alluvial and limestone based forests in the Xishuangbanna Region of Yunnan in south-western China. Summary results of analyses of similarity (ANOSIM) (limestone vs alluvial forests) and Mantel tests (comparing moth assemblages with geographic distances) using four different similarity values are presented.

Table 2. List of species of moths from alluvial and limestone rain-forest samples in the Xishuangbanna Region of Yunnan, south-western China. The species included all showed significant indicator values (P < 0.05) resulting from analyses using the IndVal procedure of Dufrêne & Legendre (Reference DUFRÊNE and LEGENDRE1997). The table shows forest types corresponding to the maximum IndVal observed, total abundance and the number of traps (out of 12) in which the species was collected in alluvial and limestone forests.

Figure 3. NMDS ordination of moth assemblages from Xishuangbanna, Yunnan, China based on Bray–Curtis similarity values, showing limestone (diamond) and alluvial (triangle) forest sites. Labels on each point correspond to the survey sites shown in Figure 1.
The indicator-value protocol found 10 species with significant indicator values (Table 2). We have confidently assigned identities to four of these which happen to belong to groups on which recent taxonomic work is available. Three further species can be identified as close to but different from known species. A further two can be placed tentatively in genera. The 10th species may be a mixed group associated with a notoriously challenging crambid genus, Omiodes. Of these, two and eight species were indicative of alluvial and limestone forests, respectively. Although six of these species occurred only within one forest type, all showed indicator values less than 70% (Table 2): that is, they may not be regarded as ‘strong’ indicators of their particular forest types.
DISCUSSION
Our results show clearly that both forest types are rich in moth species with very similar alpha and beta diversities. Cao & Zhang (Reference CAO and ZHANG1997) and Zhu et al. (Reference ZHU, WANG and LI1998) provide complimentary data on tree diversity. Based on 0.25-ha plot-based data which surveyed trees of dbh greater than 5 cm, these authors show that stem densities of trees in both forest types are more or less similar (210 ± 79.0 per 0.25 ha for limestone, 201 ± 53.4 for alluvial forest). Alluvial forests, however, showed much higher species richness (55.0 ± 7.23 per 0.25 ha) compared with the limestone plots (24.5 ± 2.22 per 0.25 ha). If, as seems sensible, we follow recent authors in accepting that herbivore diversity directly reflects plant diversity (Basset et al. Reference BASSET, CIZEK, CUÉNOUD, DIDHAM, GUILHAUMON, MISSA, NOVOTNY, ØDEGAARD, ROSLIN, SCHMIDL, TISHECHKIN, WINCHESTER, ABERLENC, BAIL, BARRIOS, BRIDLE, CASTAÑO-MENESES, CORBARA, CURLETTI, DAROCHA, DEBAKER, DELABIE, DEJEAN, FAGAN, FLOREN, KITCHING, MEDIANERO, MILLER, GAMA, OLIVEIRA, ORIVEL, POLLET, RAPP, RIBEIRO, ROISIN, ROUBIK, SCHMIDT, SORENSEN and LEPONCE2012) then our finding of comparable richness in the two forest types, in contrast to previous results on tree richness, requires explanation. Resorting to simple induction, we note that the food plants of most Lepidoptera (and, indeed, other herbivorous insects), are not forest trees but the grasses, herbs, vines, lianas and epiphytes (see some entries in Table 2 and the thousands of records in Robinson et al. Reference ROBINSON, ACKERY, KITCHING, BECCALONI and HERNÁNDEZ2001) associated with them. We have no quantitative data on these other plant functional groups from the two forest types. These two forest types are structurally similar, as evidenced by the stem densities and we suggest it is the complex of growth forms and functional plant groups which is likely to be driving herbivore diversity (cf. Grille Reference GRILLE2003, Ødegaard Reference ØDEGAARD2000).
The community-level analyses show distinct compositional differences between the moth assemblages from the two forest types. This is further evidenced by the number of indicator species characteristic of either alluvial or limestone forests (Table 2). We attribute these differences to the existence of more or less species-specific host-plant relationships between lepidopteran larvae and the plants in an area. Lepidoptera have been shown, elsewhere, to be, on average, the most specialist of the three great insect clades of herbivores (Lepidoptera, phytophagous Coleoptera and Orthoptera, in decreasing order of specialization; Novotny et al. Reference NOVOTNY, BASSET, MILLER, DROZD and CIZEK2002, Reference NOVOTNY, BASSET, KITCHING, Basset, Novotny, Miller and Kitching2003) with species being, on average, associated with no more than two genera of plants. There is a wide spread around this average with some species of heliothine noctuid being recorded from hundreds of species of plant. Others are known from single species of food-plant (Robinson et al. Reference ROBINSON, ACKERY, KITCHING, BECCALONI and HERNÁNDEZ2001). These figures, however, are generally based on isolated detailed studies in selected locations: in general our knowledge of the food-plant associations of most tropical rain-forest moths would be best described as ‘data deficient’. There remains an ongoing need for detailed natural historical observations on any and all tropical Lepidoptera.
There is a further issue with this accounting for patterns based on sampling adult moths by appealing to their larval food-plant preferences – adult moths are mobile. With some celebrated exceptions (Drake & Gatehouse Reference DRAKE and GATEHOUSE1995), lepidopteran species move little as adults: there are many well-known ‘locations’ for rare and local species where the particular populations occupy a small number of hectares, or less, year after year. Distance-driven turnover patterns of moths in Bornean primary rain forests provide further support for the idea that populations of individual species are spatially limited (Kitching et al. Reference KITCHING, ASHTON, NAKAMURA, WHITAKER and KHEY2013). In general, though, data on vagility are lacking from specific rain-forest studies, although the domination of rain-forest moth assemblages by smaller rather than larger species and the general assumption that vagility (usually) correlates with wing area, suggests that many species will move little as adults. This explanation does not imply that there is no movement by adult moths among forest patches at the scale of our study. Indeed, the lack of difference between the communities when measured based on the Chao–Jaccard estimated index (which takes into account unsampled shared species based on rare, shared species; Chao et al. Reference CHAO, CHAZDON, COLWELL and SHEN2005) suggests that movement of individuals between forest types is occurring, albeit rarely. At the level of the whole assemblage, however, an interpretation that local turnover in species composition across communities may reflect underlying larva/plant associations is both plausible and likely. Some alluvial and limestone forest remnants are closely placed within the landscape and individuals of mobile species might readily find themselves in the ‘wrong’ sort of forest.
The 10 species which emerge as significant indicators of particular forest types may be best understood in light of what is known of their particular life histories. For four of the species we have been unable to find any life-history information, for the remainder, information mostly comes from outside China, most notably from Borneo (Holloway Reference HOLLOWAY1986, Reference HOLLOWAY1993, Reference HOLLOWAY1997). For Parasa bicolor (Limacodidae), characteristic of alluvial forest, Holloway (Reference HOLLOWAY1986) indicated that related species are recorded feeding on Mangifera (Anacardaceae) and Nephelium (Sapindaceae). The other species for which information is available are all limestone-associated in our samples. Godonela nora has been bred from a climbing species of Acacia in southern India and is recorded from kerangas and alluvial forest as well as ‘dipterocarp forest on limestone’ in Borneo (Holloway Reference HOLLOWAY1997). All Ocinara species for which information is available are recorded feeding as larvae on Moraceae (Holloway Reference HOLLOWAY1993). Larvae of the hadenine genus Mythimna are probably grass feeders. Most known Omiodes hosts are legumes. Finally, the Biston species may mirror other members of its genus by being a highly polyphagous defoliator (Holloway Reference HOLLOWAY1997). These details in fact shed little light on why these species show up as indicators with the exception of the limestone-associated geometrid Godonela nora which is recorded by Holloway (Reference HOLLOWAY1997) ‘from dipterocarp forest on limestone’ at higher elevations.
We show clearly, even based on our limited sampling, that the moth assemblages from these two forest types are not interchangeable. We speculate that this differentiation will also be seen in the other major groups of insect herbivores: the phytophagous Coleoptera and the Orthoptera – but data are lacking. Any conservation strategy that attempts to maximize species richness must regard these forest patches as separate components of the landscape.
In the Xishuangbanna region the limestone remnants, often on or around near-vertical outcrops, are perhaps of less immediate conservation concern than the topographically more accessible alluvial forests. Nevertheless the entire landscape is under immense pressure from burgeoning rubber production and considerable losses in forest area have occurred in the 10 years since our moth data were collected. From 1976 to 2003, Li et al. (Reference LI, MA and LIU2009) note a reduction in forest cover in the region from 67% to 43.6%. Tropical rain forest has been reduced over the same period by 67%. Most of this loss has been due to conversion to rubber plantations which increased in cover from 1.1% to 11% over the same period. Further expansion has occurred to 2010 when estimates suggest that rubber covers 22% of the region. Although detailed data are lacking, the greatest proportion of this loss is in alluvial forests below 800 m elevation, which are more fertile, accessible and workable as plantations.
ACKNOWLEDGEMENTS
This work has depended critically on support provided to the senior author by the Chinese Academy of Sciences and the Director, Professor Chen Jin, and his staff at the Xishuangbanna Tropical Botanical Gardens, in particular. In 2003 this took the form of a support as a Visiting Fellow; in 2014, Professor Kitching's participation in the project was supported by Chinese Academy of Sciences Visiting Professorship, Grant number 2013T2S0029. RLK is grateful for this support and thanks the Chinese Academy of Sciences and his Chinese colleagues sincerely. In 2003, scientific advice was freely provided by Dr Tang Yong and Professor Zhu Hua. Masters student Yuping Yan served as a highly efficient research assistant. From 2011 to 2013 further work in China was supported under a grant awarded under the joint Queensland Government/Chinese Academy of Sciences Biotechnology Granting Scheme to Professors Kitching and Cao. This scheme allowed for several exchange visits between Australia and Yunnan and fieldwork in both countries. We are grateful to these persons and organizations for their support. We also thank Professor Anne Chao for useful statistical advice.