Introduction
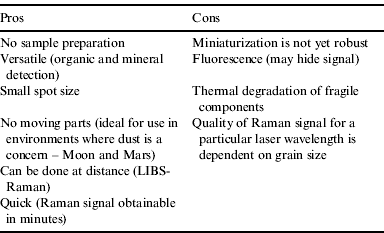
The recognition of use for a Raman spectrometer as part of a suite of instruments for planetary exploration is not new as Raman spectrometry has many advantages over other instruments (Table 1). However, its development as a portable system is still in its infancy.
Table 1. Pros and Cons of a Raman spectrometer

Raman spectrometry relies on the inherent characteristic of molecular electronic clouds and bonds to interact with incident light. When a molecule is excited to a virtual state by a monochromatic light source such as a laser, it relaxes back to the same (vibrational) energy level within its ground state and the emitted photon has a wavelength identical to the exciting monochromatic light. Such Rayleigh scattering is ‘elastic’. Occasionally, however, the molecule relaxes at an energy level higher or lower than the original level. The corresponding emitted photon thus has a wavelength that is offset from, and independent of, the wavelength of the incident light. This ‘inelastic scattering’ is the Raman effect. Both elastic and inelastic scattering are associated with interaction of the incident light with molecular vibrational modes. Scattering used for Raman spectroscopy is typically associated with energy lost by the scattered light (Stokes scattering), because the amplitude of the signal is higher than for energy gained (anti-Stokes scattering) (Tarcea et al. Reference Tarcea, Frosch, Rösch, Hilchenbach, Stuffler, Hofer, Thiele, Hochleitner and Popp2008).
In contrast, fluorescence is caused by the absorption of incoming photons, rather than scattering in the case of the Raman effect. The molecule is excited to a discrete excited state, and as it falls through various energy levels back to the ground state, this ‘energy cascade’ will liberate photons with different wavelength, resulting in a ‘broad signal’ that is fixed to a particular incident wavelength (fluorescence is a resonant phenomenon, while the Raman effect is not).
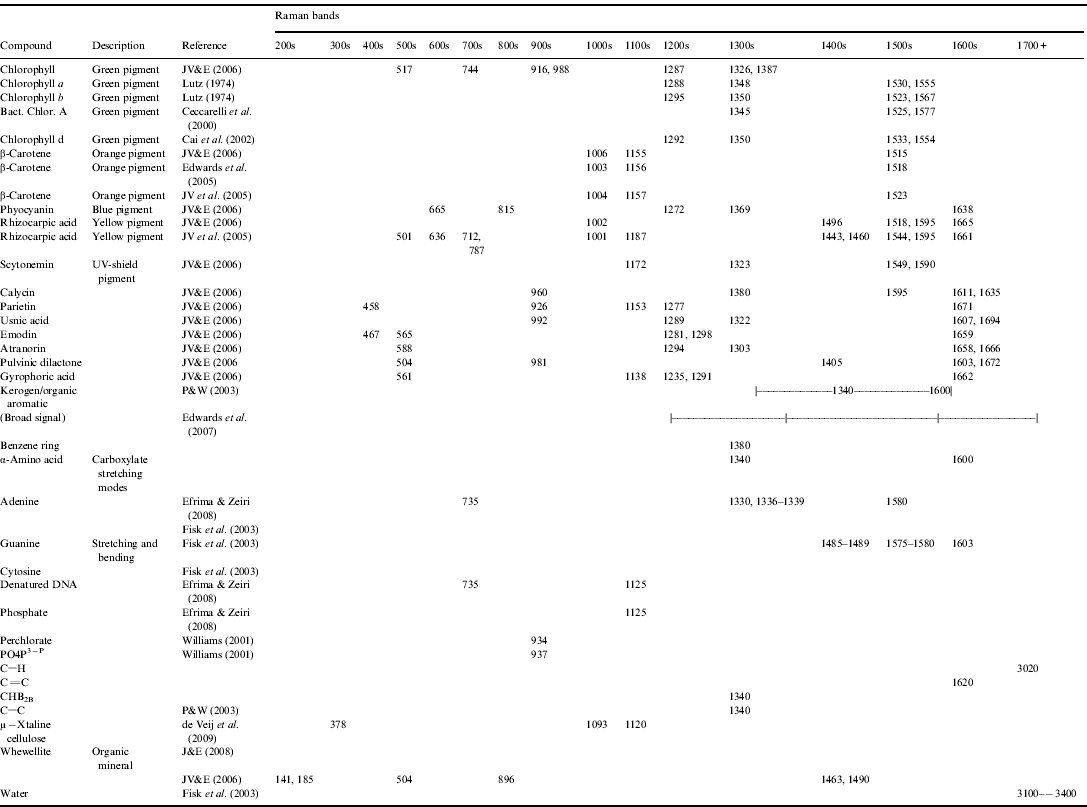
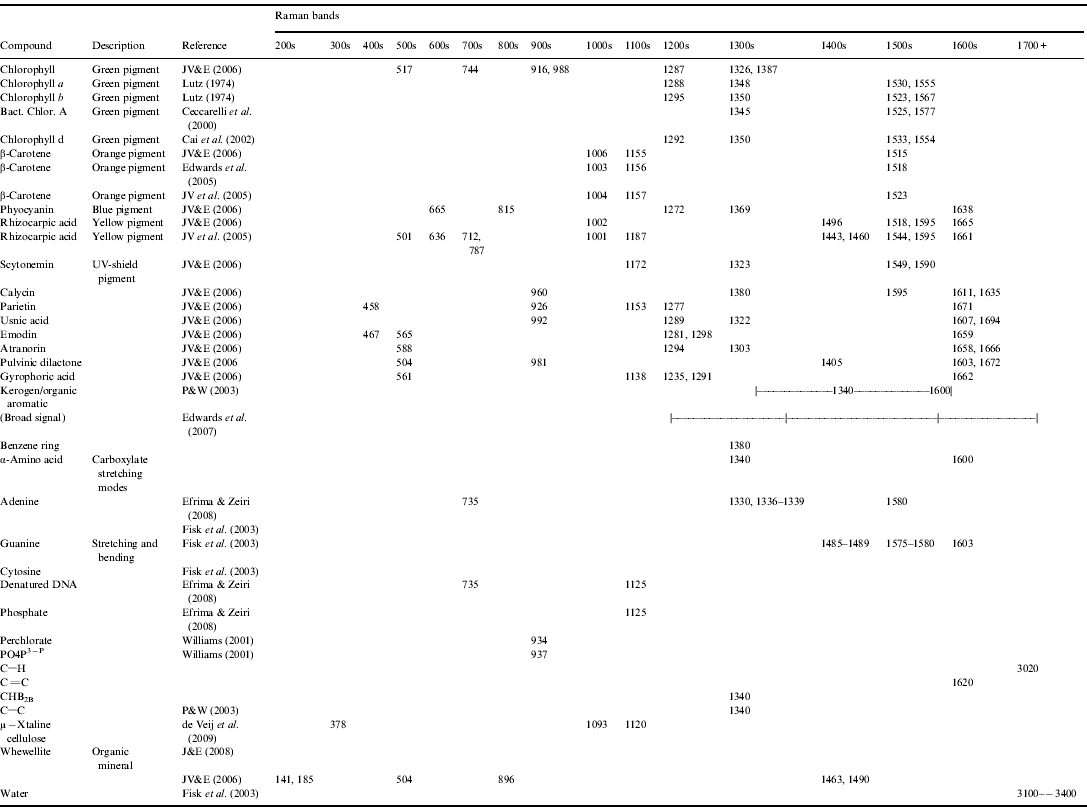
A Raman spectra is a plot of the scattered light's wavenumber (cm−1) on the x-axis (wavenumber is the spatial analogue of frequency) and intensity of that scattering on the y-axis. It is (usually) characterized by discrete peaks, where the distribution and location of those peaks are unique to the material targeted, which allows determination of the material upon comparison with a database. To first order, signatures >1100 cm−1 are typically associated with biological/organic materials (and carbonaceous geomolecules), while signature <1100 cm−1 are typically associated with geological materials. Appendices A and B provide databases of geological and biological Raman peaks respectively, of interest to astrobiology research.
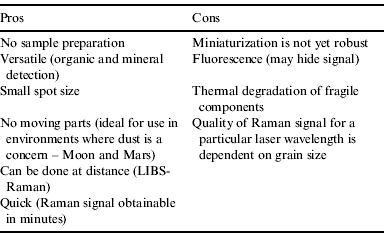
Raman spectrometry has been successfully applied in biology (Petry et al. Reference Petry, Schmitt and Popp2003), microbiology (Buijtels et al. Reference Buijtels, Willemse-Erix, Petit, Endtz, Puppels, Verbrugh, van Belkum, van Soolingen and Maquelin2008; Ivleva et al. Reference Ivleva, Wagner, Horn, Niessner and Haisch2009), extreme terrestrial environments (Edwards et al. Reference Edwards, Jorge Villar, Bishop and Bloomfield2004; Jorge Villar et al. Reference Jorge Villar, Edwards and Cockell2004, Reference Jorge Villar, Edwards and Seaward2005; Edwards et al. Reference Edwards, Moody, Jorge Villar and Wynn-Williams2005) and in an astrobiological context (Dickensheets et al. Reference Dickensheets, Wynn-Williams, Edwards, Schoen, Crowder and Newton2000; Ellery et al. Reference Ellery, Wynn-Williams, Parnell, Edwards and Dickensheets2004; Jorge Villar & Edwards Reference Jorge Villar and Edwards2006). Such studies, however, have relied on field-sampling, transport and analysis on desktop Raman spectrometers. Portable instruments, as needed for planetary exploration, do not have the same capabilities as corresponding laboratory instruments due to limitations in mass, volume and energy consumption (Tarcea et al. Reference Tarcea, Frosch, Rösch, Hilchenbach, Stuffler, Hofer, Thiele, Hochleitner and Popp2008). We use a DeltaNu Rockhound 785 nm portable Raman spectrometer, which has a spectral resolution of ±12 cm−1 at 31 mW, and wavenumber range of 200–2000 cm−1. Successful deployment of the DeltaNu portable Raman spectrometer for geological investigations has been established elsewhere (Jehlička et al. Reference Jehlička, Vitek, Edwards, Hargreaves and Čapoun2009a, Reference Jehlička, Vitek, Edwards, Heagraves and Capounb), and its use for biological investigations are just beginning with positive detection of organic minerals (Jehlička & Culka Reference Jehlička and Culka2010; Jehlička et al. Reference Jehlička, Vitek and Edwards2010). Raman spectrometry at 785 nm is useful for the study of biological samples because that wavelength is best for the identification of chlorophyll, a green pigment commonly found in cyanobacteria (chloroplasts in green plants originated as cyanobacteria). Chlorophyll is considered a ‘smoking gun’ for biological detection. Another excellent biomarker is β-carotene (Vitek et al. Reference Vitek, Jehlicka, Edwards and Osterrothova2009), a biological pigment. Other pigments include pristane (found in purple sulphur bacteria, actinomycetes, sponges, etc.), okenane (from green sulphur bacteria), chlorobactane (also in green sulphur bacteria), lycopane (found in marine environments) and γ-carotene among others, but to our knowledge, their Raman spectra are as yet unknown. While shorter wavelengths have distinct advantages over 785 nm, namely less of fluorescence emission (Table 2), they fail to detect chlorophyll conclusively (Jorge Villar & Edwards Reference Jorge Villar and Edwards2006) and deliver more energy to the sample, increasing risk of organic degradation.
Table 2. Pros and Cons of incident laser wavelengths for Raman spectroscopy

Raman spectrometry is sensitive to the grain size of analysed samples. Powdered samples tend to not give a good Raman spectral signature at an excitation of 785 nm (Wang et al. Reference Wang, Haskin and Cortez1998). As such, the DeltaNu instrument is best suited for larger-grained substrates. This limitation on fine-grained powder can be overcome by lowering the excitation wavelength (Wang et al. Reference Wang, Haskin and Cortez1998), but this is not possible on the DeltaNu instrument.
ExoGeoLab and ExoHab
This study was performed in the context of the ExoGeoLab and ExoHab programmes at ESTEC (European Space Research and Technology Center), in Noordwijk, the Netherlands. Both programmes are ESTEC & ILEWG (International Lunar Exploration Working Group) Skunk works pilot projects to optimize design, operation, exploitation and scientific output of a suite of instruments at a putative landing site on the Moon, Mars or beyond (Foing et al. Reference Foing, Stoker and Ehrenfreund2011a). ExoGeoLab focuses on lander/rover/instruments operations, while ExoHab investigates human factors in parallel. Both projects deploy instruments in extreme Earth and planetary-analogue environments (Foing et al. Reference Foing, Stoker and Ehrenfreund2011a, Reference Foing, Stoker, Zavaleta, Ehrenfreund, Thiel, Sarrazin, Blake, Page, Pletser and Hendrikseb; Stoker et al. Reference Stoker, Clarke, Direito, Blake, Martin, Zavaleta and Foing2011; Ehrenfreund et al. Reference Ehrenfreund, Röling, Thiel, Quinn, Sephton, Stoker, Kotler, Direito, Martins and Orzechowska2011; Kotler et al. Reference Kotler, Quinn, Foing, Martins and Ehrenfreund2011; Martins et al. Reference Martins, Sephton, Foing and Ehrenfreund2011; Thiel et al. Reference Thiel, Ehrenfreund, Foing, Pletser and Ullrich2011a, Reference Thiel, Pletser and Foingb; Gomez et al. Reference Gómez, Walter, Amils, Rull, Klingelhöfer, Kviderova, Sarrazin, Foing, Behar and Fleischer2011), making them relevant to the preparation of future lunar and planetary missions. This particular study assessed the DeltaNu instrument with organic materials in laboratory settings, as a baseline for future field deployment. All samples used in this study are from the ExoGeoLab sample collection in Noordwijk, The Netherlands.
Geobiological results and interpretation
We present positive detections of chlorophyll, β-carotene, rhizocarpic acid and parietin as biosignatures in lichens using the DeltaNu, and observe thermal degradation. Observations of thermal degradation are critical in determining the optimal power, laser wavelength and integration time for planetary settings because of the risk associated with potentially destroying organic material contained within samples.
We compared the Raman spectra of an olivine crystal in a vesicular basalt (Fig. 1(A)) with that of a deciduous leaf (Fig. 1(B)) as end-member spectra to illustrate the fluorescence problem existing with Raman spectrometry. Fluorescence causes the baseline of the leaf spectrum to shift up compared with that of the olivine crystal, and the Raman peaks of β-carotene and chlorophyll are correspondingly weak. Zooming into the leaf signal allows confirmation of the presence of β-carotene and chlorophyll, with the additional identification of rhizocarpic acid (Fig. 2). The characteristic doublet-peak of the olivine phenocryst is strong and unmistakable (Fig. 1(A)). Phenocrysts provide ideal surfaces for Raman investigations because of their large cross-sections. A phenocryst of pyroxene from another basaltic sample is clearly identified from its distinct Raman peaks (Fig. 3(A)), but when the laser is targeted on the aphanitic matrix (crystals forming the bulk of the rock too small to be seen with the naked eye, and much smaller than the laser spot size), the Raman signal is substantially degraded (Fig. 3(B) and (C)), likely due to the grain-size effect discussed by Wang et al. (Reference Wang, Haskin and Cortez1998). A weathered basalt broken to expose a ‘fresh’ surface (Fig. 3(B)) is scanned using the Raman, and the ensuing spectrum strongly contrasts (Fig. 3(C)) with a sample that has been in storage for a long period of time (years). Organic contaminants are seen to be the likely cause because the Raman signal occurs at >1100 cm−1, although we were not able to determine the exact nature of those contaminants.

Fig. 1. Example spectra obtained using the DeltaNu portable Raman spectrometer. (A) Olivine phenocryst. The doublet peak at 819 and 849 cm−1 are the signature of olivine, while the weaker peak at 325 cm−1 may indicate nearby pyroxene. (B) Deciduous leaf. Note the change of baseline from olivine, attributed to fluorescence. Faint peaks at 752 and 1533 cm−1 indicate chlorophyll, while the peak at 1160 cm−1 hints to the presence of β-carotene. The box is enlarged in Fig. 2. Both spectra are the average of five 5-seconds spectra at medium (31 mW) laser power level.

Fig. 2. Detail of the deciduous leaf spectrum of Fig. 1(B). The peaks at 747, 917, 988, 1289, 1329 and 1391 cm−1 are signatures of chlorophyll. The peaks at 1001, 1159 and 1525 cm−1 are signatures of β-carotene. Rhizocarpic acid may be the cause of the peaks at 1187, 1438 and 1547 cm−1. These spectra are the average of five 5-seconds spectra at the medium (31 mW) laser power level.

Fig. 3. Spectra of basalt. (A) Spectrum of a pyroxene phenocryst (left arrow of picture inset), as identified by peaks at 328, 662 and 1005 cm−1. The sharp peaks at 1088 and 1542 cm−1 appear spurious. (B) Spectrum of the ‘fresh’ surface of the basalt illustrated in Fig. 3(A) illustrate the complexity of organic contaminants. The strong peak at 1233 cm−1 and greater are not identified but likely are linked to organic contaminants in the sample, which was collected in the moist environment of the Leiden Hortus Botanicus. The peaks at 300 and 608 cm−1 could indicate haematite in the basaltic matrix, while 500 and 1298 cm−1 identify feldspars and 663 cm−1 suggests pyroxene. (A) and (B) are the average of 5-seconds spectra at the medium (31 mW) laser power level. (C) spectrum of another vesicular basalt. This sample has been in the rock collection of ExoGeoLab for a substantial period of time. The peaks at 328 and 685 cm−1 are associated with pyroxene. Notice the lack of the broad large peaks characteristic of the weathered sample.
The lichen Xantia Parietina (‘sun cups’) was investigated and illustrates thermal degradation (and loss of signal) due to organic material breakdown when exposed to extended laser time. Figure 4(A) shows the averaged Raman spectrum of five, 5-second spectra, allowing the identification of different biological pigments. Figure 4(B) and (C) show the degradation by increasing the integration time to 10 and 30 seconds, respectively. The broad signal at ∼1300 cm−1 is consistent with dominantly degraded organic material (Pasteris & Wopenka Reference Pasteris and Wopenka2003). Thermal degradation may also be apparent visually (Fig. 5), and is a clear indicator of excessive laser power. The lichen sample in Fig. 3 was damaged after an exposure of five, 5-second integration time at 31 mW.

Fig. 4. Example of thermal degradation of organic matter due from the Raman laser. (A) A fresh sample of the lichen Xanthora Parietina (‘sun-cups’), with a close-up view of a ‘cup’ (2 mm across). (B) spectrum obtained as an average of five 5-seconds spectra of a ‘cup’. The peaks at 794 and 1187 cm−1 identify rhizocarpic acid. The peak at 1158 cm−1 could be either parietin of β-carotene. The peak at 1282 cm−1 is likely parietin. The peak at 1327 cm−1 could be either chlorophyll, usnic acid or scyotonemin. The peak at 1528 cm−1 identifies either β-carotene or chlorophyll, while the peak at 1553 cm−1 identifies chlorophyll and 1671 cm−1 identifies parietin. If we use a rule of thumb that two peaks are necessary to identify a compound, then this spectrum positively identifies rhizocarpic acid, parietin and β-carotene. Chlorophyll appears unlikely, based simply on sample colour. (C) Spectrum obtained as an average of five 10-seconds spectra of a ‘cup’. The broad peak with a maximum at 1359 cm−1 is a signature consistent with degraded organic material (Pasteris and Wopenka, 2003) likely from the thermal degradation due to the duration of the laser incidence. The signature at 1527 cm−1 identifies β-carotene, and 1673 cm−1 identifies parietin. (D) Spectrum obtain as an average of five 30-seconds spectra of a ‘cup’. The thermal degradation is evident from the broad peak near 1300 cm−1. The peaks at 1527 and 1669 cm−1 still capture β-carotene and parietin, respectively.

Fig. 5. Visible remnant of thermal degradation of organic material using the Raman laser. This lichen is identified as the right-most arrow in the inset of Fig. 3(A). The damage was done after an exposure of five 5-seconds laser pulses at medium power level (31 mW). Both images are 2 mm across.
Implications for astrobiology and conclusions
It has been established by previous workers that depending on the wavelength of the laser used, sample grain size (Wang et al. Reference Wang, Haskin and Cortez1998) and sample fluorescence (Jorge-Villar & Edwards Reference Jorge Villar and Edwards2006) affect the Raman signal-to-noise ratio. Ideal geological surfaces for Raman investigation are smooth, and may be obtained in situ using instruments akin to the Rock Abrasion Tool found on the Mars Exploration Rovers. As most geological surfaces are not smooth, studying the effect of natural surfaces on Raman signals should complement existing Raman databases. We have illustrated this need with ambiguous Raman signals obtained from unprepared samples (Fig. 3(B)). We have also established how integration time, while beneficial for increased signal strength in geological samples, is detrimental to biological samples due to thermal degradation of the organic material (Figs. 4 and 5), and thus substantial care must be taken when sampling an unknown sample for the detection of astrobiologically relevant signatures. We thus recommend that the development of a Raman spectrometer for planetary exploration purposes include the trade-off ability of multiple (i) power settings, (ii) signal integration time and (iii) laser wavelengths. Although exact wavelength selection would depend upon mission programmatic goals, we propose using wavelengths of 250 nm (sensitive to amino acids, nucleic acids and quinones), 785 nm (allows the best detection of chlorophyll) and 832 nm (least fluorescence), for most mission requirements. The pros and cons of several laser wavelengths for Raman spectroscopy are listed in Table 2. We recognize the need for further scientific investigations to better understand the coupling of laser wavelength, power level and integration time on signal quality of biological samples, the need to expand the study of Wang et al. (Reference Wang, Haskin and Cortez1998) to better understand the effects of different grain-sizes at different laser wavelengths, and to obtain the Raman spectra of other biosignatures such as pristane, okenane, chlorobactane, lycopane and γ-carotene.
Acknowledgements
We thank Pooja Mahapatra, Jason Page, Saranisa Voûte and the ExoGeoLab-ExoHab teams for support. Sanjoy M. Som additionally thanks the University of Washington Astrobiology Program for funding and the Swiss Space Association for support.
Appendix A: Geological Raman peaks

Appendix B: Biological Raman peaks


