


INTRODUCTION
Tropical forests are the repository of the most biodiverse ecosystems on Earth (Millennium Ecosystem Assessment 2005a), sequester vast amounts of carbon (Matthews et al. Reference Matthews, Payne, Rohweder and Murray2000), provide invaluable ecosystem services such as regulating water supplies (Bruijnzeel Reference Bruijnzeel2004) and mitigating the impact of floods (Bradshaw et al. Reference Bradshaw, Sodhi, Peh and Brook2007), reduce the transmission of certain human infectious diseases (Foley et al. Reference Foley, Asner, Costa, Coe, DeFries, Gibbs, Howard, Olson, Patz, Ramankutty and Snyder2007) and supplement vital pollination services for agricultural systems (Ricketts et al. Reference Ricketts, Daily, Ehrlich and Michener2004). Despite their undoubted economic value (Secretariat of the Convention on Biological Diversity 2001; Ricketts et al. Reference Ricketts, Daily, Ehrlich and Michener2004) and the potential for economic loss from deforestation (Torras Reference Torras2000), tropical forests are predicted to experience the greatest proportional reduction in areal extent of all major biomes in the foreseeable future (Millennium Ecosystem Assessment 2005b).
Brazil is home to a larger expanse of tropical forest than any other nation, and parts of the Brazilian Amazon are experiencing the highest absolute rates of forest clearance of anywhere in the world (Achard et al. Reference Achard, Eva, Stibig, Mayaux, Gallego, Richards and Maliingreau2002). However, simplistic statements such as the previous one gloss over many complexities in patterns of deforestation, particularly as they are based on data examining change in forest cover over a single time period. Closer examination reveals that deforestation rates in Brazil are dynamic and over the period 1990–2005 exhibited considerable inter-annual variability (Fig. 1; INPE [Instituto Nacional de Pesquisas Espacial] 2007). The hypotheses put forward to explain such variability are wide-ranging, but centre around the expansion of agriculture with associated development of regional transportation infrastructure (Laurance et al. Reference Laurance, Albernaz, Schroth, Fearnside, Bergen, Venticinque and Da Costa2002).
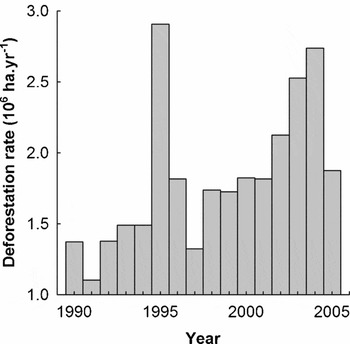
Figure 1 Deforestation rate in the Brazilian Amazon for the period 1990–2005 (Source: INPE 2007).
Two forms of agriculture dominate discussions of deforestation in the Brazilian Amazon: cattle ranching and industrial soybean farming. Growth of the Amazonian cattle herd has been directly linked to forest loss (Faminow Reference Faminow1997; Mertens et al. Reference Mertens, Poccard-Chapius, Piketty, Lacques and Venturieri2002; Kaimowitz et al. Reference Kaimowitz, Mertens, Wunder and Pacheco2004; Ferraz et al. Reference Ferraz, Vettorazzi, Theobald and Ballester2005; Barreto et al. Reference Barreto, Arima and Brito2006a), and the same can be said for the increasing extent of soybean farms (Brown et al. Reference Brown, Koeppe, Coles and Price2005; Greenpeace 2006; Laurance Reference Laurance2007). The logic behind the link between agriculture and deforestation is simple and compelling. To rapidly increase agricultural outputs from a predominantly forested landscape, the forest must be removed to make way for cattle and soya. The economic returns from large-scale agriculture are large enough to arm the sector with powerful political influence, leading to government investment in the transportation infrastructure required to move mass agricultural products from remote farmland to their market destinations. New roads, and the paving of unpaved roads, are perhaps the most obvious products of investments in infrastructure, and have a heavily documented and very close spatial relationship with patterns of deforestation (Pfaff Reference Pfaff1999; Carvalho et al. Reference Carvalho, Barros, Moutinho and Nepstad2001; Laurance et al. Reference Laurance, Cochrane, Bergen, Fearnside, Delamonica, Barber, D'Angelo and Fernandes2001a, Reference Laurance, Albernaz, Schroth, Fearnside, Bergen, Venticinque and Da Costa2002; Alves Reference Alves2002; Fearnside Reference Fearnside2005, Reference Fearnside2006; Brandão et al. Reference Brandão Jr, Souza Jr, Ribeiro and Sales2007). Consequently, large-scale infrastructure development plans such as Avança Brasil have formed the basis of several high-profile models that have been used to predict rates and patterns of Amazonian deforestation into the future (Laurance et al. Reference Laurance, Cochrane, Bergen, Fearnside, Delamonica, Barber, D'Angelo and Fernandes2001a; Nepstad et al. Reference Nepstad, Carvalho, Barros, Alencar, Capobianco, Bishop, Moutinho, Lefebvre, Silva Jr and Prins2001; Soares-Filho et al. Reference Soares-Filho, Alencar, Nepstad, Cerqueira, Diaz, Rivero, Solórzano and Voll2004, Reference Soares-Filho, Nepstad, Curran, Cerqueira, Garcia, Ramos, Voll, McDonald, Lefebvre and Schlesinger2006).
Agricultural expansion takes place within an economic context and in the case of Brazil, the recent economic history has been turbulent. The Brazilian currency was devalued four times between 1986 and 1994 as the economy suffered hyperinflation in the early 1990s, with a peak annual inflation rate of almost 3000% (World Bank 2004). Successive economic plans failed to halt the spiralling inflation until the Real Plan in 1994, which effectively stabilized the economy, reducing inflation from 2075% to just 7% in three years. Such massive economic changes have been reflected in a steady strengthening of the exchange rate in recent years, allowing the nation to more fully participate in the global economy which, in turn, has opened up new markets for agricultural products (Nepstad et al. Reference Nepstad, Stickler and Almeida2006a). Rising prices for farm commodities increase the profitability of agriculture and raise the value of arable land, thereby increasing the incentive for further deforestation (Cattaneo Reference Cattaneo2001).
Brazil has strong environmental legislation to limit the amount of deforestation that is permissible on private land in the Amazon biome, stating that landowners must retain 80% of the forest cover on their land (Barreto et al. Reference Barreto, Souza Jr, Noguerón, Anderson and Salomão2006b). However, this legislation has proven exceedingly difficult to enforce (Laurance et al. Reference Laurance, Albernaz and Da Costa2001b; Barreto et al. Reference Barreto, Souza Jr, Noguerón, Anderson and Salomão2006b), although recent attempts to link satellite monitoring to on-the-ground enforcement actions hold promise (Mato Grosso & FEMA [State Foundation of the Environment] 2001). Surprisingly, when assessed across the Brazilian Amazon, protected areas and National Forests appear to be a largely effective barrier to deforestation (Veríssimo et al. Reference Veríssimo, Cochrane and Souza Jr2002; Nepstad et al. Reference Nepstad, Schwartzman, Bamberger, Santilli, Ray, Schlesinger, Lefebvre, Alencar, Prinz, Fiske and Rolla2006b), despite the apparently weak law enforcement. However, in regions that have already undergone heavy deforestation, such as in the state of Rondônia, illegal deforestation has reduced forest cover in some protected areas by more than 20% (Ribero et al. Reference Ribero, Veríssimo and Pereira2006), indicating that the active enforcement of environmental legislation is still required to safeguard tropical forests.
The extent of deforestation in the Brazilian Amazon has been reported annually since the late 1980s, creating a time-series of data that can be used to test many of the hypotheses raised above. Given the global level of interest in the causes of tropical deforestation, it is surprising that these data have not yet been subjected to a rigorous examination. Here, we conduct the first tests designed to directly assess the impacts of agriculture, reserve creation and economic conditions on rates of Amazon deforestation.
METHODS
We investigated the effect of 10 potential drivers of temporal change in deforestation rate in the Brazilian Amazon over the period 1990–2005. This period was the longest possible time series for which we were able to obtain annual estimates of deforestation and of the 10 predictor variables. Deforestation was measured as the total amount of forest loss across the Brazilian Amazon (million ha; Fig. 1). The area of deforestation was calculated from direct observations based on satellite imagery and is reported annually by Brazil's National Institute for Space Research (INPE 2007). Deforestation is not evenly distributed across the nine states comprising the Brazilian Amazon, with the states of Pará and Mato Grosso accounting for c. 70% of deforestation. We tested whether the spatial distribution of deforestation among states varied through time, using linear regression. We regressed the proportion of deforestation against time for each of the nine states in turn, and assessed model significance with ANOVA and a corrected p-value of 0.017, allowing for an experiment-wise error rate of 0.15 that reduces the Type II error rate (Nakagawa Reference Nakagawa2004).
The potential drivers of deforestation fell into two categories, the first of which were specific to the Brazilian Amazon region: (a) the total size of the protected area network (ha) in each year, which has grown rapidly in the past two decades (Rylands & Brandon Reference Rylands and Brandon2005) and includes all state and federal reserves and National Forests; (b) the size of the Amazonian cattle herd (number of head; data downloaded from the Brazilian Institute of Geography and Statistics [IBGE] website, URL http://www.ibge.gov.br); (c) the total area of soybean plantations in the Brazilian Amazon, which includes areas converted from both forest and cerrado habitats (ha; data from IBGE website); (d) the price of soybeans ($US per bushel, where 1 metric tonne equals 36.74 bushels, adjusted by the Consumer Price Index (CPI); data from US Department of Agriculture [USDA] website, URL http://www.usda.gov); and (e) the price of live cattle (US cents per pound and also CPI-adjusted; data from USDA website).
The second category of variables quantified temporal variation in the domestic economy and were obtained from the World Bank World Development Indicators Dataset: (a) gross domestic product (GDP) per person ($US standardized to the value of the US dollar in 2000); (b) inflation rate (based on consumer prices, %); (c) exchange rate (relative to the US$); (d) domestic credit availability; and (e) the size of Brazil's international debt ($US). We investigated the potential effect of the domestic economy on deforestation because previous analyses have either shown or suggested that (a) deforestation should decrease with increasing levels of economic development (Rudel et al. Reference Rudel, Coomes, Moran, Achard, Angelsen, Xu and Lambin2005; Ewers Reference Ewers2006); (b) high levels of inflation can lead to high discount rates that promote short-term resource exploitation (Fearnside Reference Fearnside1997, Reference Fearnside2005; Laurance Reference Laurance1999); (c) depreciation of exchange rates can increase deforestation rates in developing countries (Arcand et al. Reference Arcand, Guillaumont and Jeanneney2008) and exchange rates alter the relative value of export commodities such as soy and cattle (Kaimowitz et al. Reference Kaimowitz, Mertens, Wunder and Pacheco2004); (d) credit availability in the form of government subsidies underpins much of the expansion of cattle ranching across the Brazilian Amazon (Barreto et al. Reference Barreto, Arima and Brito2006a); and (e) the need to service international debts can result in elevated rates of natural resource use and forest conversion to agriculture to facilitate economic growth (Kahn & McDonald Reference Kahn and McDonald1995; Marquart-Pyatt Reference Marquart-Pyatt2004).
We used Pearson correlations to quantify the inter-correlated nature of the 10 predictor variables, and cross-correlations to investigate the correlations between the variables and log10-transformed deforestation rate. Because many processes are not expected to have an instantaneous impact on deforestation rate, cross-correlations, and all following analyses, were calculated for timelags of 0, 1, 2 or 3 years.
Causal relationships between the 10 variables and deforestation rate were assessed using stepwise regression in R v.2.5.0 software (R Development Core Team 2004). Because we wanted to test 10 variables with just sixteen data points, we divided the analysis into two steps. In the first step, we regressed just the five Amazonia-specific variables against deforestation rate and determined the minimum adequate model (MAM). In the second step, the five domestic-economy variables were regressed against the residuals from the MAM to detect any further influence of these variables on deforestation that was not already explained by the Amazonia-specific variables. Again, stepwise selection of variables was used to generate a second MAM. In no instance did this second MAM generate a significant model (p > 0.05 in all cases), which was expected due to the highly correlated nature of the predictor variables.
Model significance was assessed using standard ANOVA on the MAMs, and with remove-one cross-validation which is a powerful alternative to parametric estimates of model significance (Maggini et al. Reference Maggini, Lehmann, Zimmermann and Guisan2006). In this procedure, each observation is removed from the dataset in turn, and the remaining data points are used to predict the value of the removed data point. This is repeated with each data point being removed in turn. The predicted values are regressed against the observed values, with the regression representing the ability of the model to recreate the observed data.
Time-series data often exhibit serial dependence (where adjacent values are correlated with each other), thereby invalidating assumptions about the independence of data points that are central to parametric statistics. One approach to removing serial dependence is to ‘difference’ the data by calculating the change in values from one time step to the next. The differences can then be considered as independent variables for use in parametric models. We repeated the modelling of MAMs described above on differenced data.
We used power analysis to assess our confidence in rejecting the null hypothesis (i.e. that the variables tested had no discernable impact on rates of deforestation).
RESULTS
Despite considerable temporal fluctuations in deforestation rates in the Brazilian Amazon over the period 1990–2005, the distribution of that deforestation across states was remarkably stable (Fig. 2). The proportion of deforestation occurring in eight of the nine states comprising Brazilian Amazonia did not vary significantly through time. The exception was the state of Tocantins, which in 1990 accounted for just 4% of the total deforestation and by 2005 was responsible for just 1%. Because there were no notable temporal differences in the distribution of deforestation across the states, we considered it legitimate to fit a single basin-scale model of deforestation rates.

Figure 2 Proportional distribution of deforestation across the nine states of the Brazilian Amazon for the period 1990–2005. The distribution was stable through time with just one of the nine states (Tocantins) having a significant change in proportional deforestation through time.
Nearly all 10 predictor variables were significantly inter-correlated with each other (Table 1). Particularly high inter-correlations (r > 0.8) were observed between the size of the cattle herd, the area of soybean plantations and domestic credit availability, indicating that there is no statistically valid case for attributing changes in deforestation rate to one or the other of these variables. Only inflation rate had weak enough inter-correlations with the other variables that it could be considered an independent predictor (Table 1).
Table 1 Intercorrelations of 10 measures of the national economy, agricultural productivity and prices, and the size of the protected area network in the Brazilian Amazon. * p < 0.05.

Deforestation rate was significantly cross-correlated with all five measures of the national economy (GDP per person, exchange rate, inflation rate and domestic credit availability), as well as with the area of soybean plantations, the price of soybeans and the combined size of all protected areas across the Brazilian Amazon (Table 2). Only the size of the cattle herd and the price of cattle had no detectable correlation with the rate of deforestation. However, there was no reason to expect that any of these variables have instant impacts on deforestation rate, so we repeated the correlations using time lags of one, two and three years. With the exception of the size of Brazil's international debt, the size of the cattle herd and cattle price, all variables were significantly correlated with deforestation with a time lag of one year, but few, if any, variables were correlated with a two- or three-year time lag (Table 2).
Table 2 Cross-correlation between rate of deforestation and measures of the national economy, agricultural productivity and prices, and the size of the protected area network in the Brazilian Amazon. Correlations were repeated with time lags of up to three years. *p < 0.05.

Stepwise regression procedures found highly significant models that purported to explain deforestation rate with time lags of zero, one and two years, but no significant model was detected with a three-year time lag (Table 3). However, all three significant models were non-significant when tested using cross-validation (Table 3), indicating that the removal of a single data point from the time series greatly altered the model result.
Table 3 Minimum adequate models for explaining deforestation rates over the period 1990–2005. Models were constructed using backwards stepwise regression and signficance was assessed with parametric statistics (ANOVA on linear regression) and using remove-one cross-validation.

To properly account for the time-series nature of the data, we removed serial dependence by differencing the data. Using the differenced data, we found just one weakly significant model, with the area of soybeans and deforestation rate being positively correlated with no time lag (F 1,13 = 5.01, p = 0.043). However, remove-one cross-validation suggested that this model was not statistically significant (p = 0.76). We did not detect a significant effect of any of the remaining nine predictor variables on deforestation rate, at any time lag (linear regression, p > 0.05).
Power analysis (with α = 0.05 and ß = 0.2) revealed that the sixteen-year time series of data that were available for this analysis was enough to detect large (r ≥ 0.65), but not medium (r = 0.3) or small (r = 0.1), effects of the hypothesized drivers on deforestation rate. To obtain enough power to confidently detect medium or small effects (Cohen Reference Cohen1988, Reference Cohen1992) would require far larger time series of 85 and 782 years, respectively.
DISCUSSION
We found no pervasive cause-and-effect relationship between economic or agricultural factors and the rate of deforestation in the Brazilian Amazon. We stress that this does not imply that agriculture is not a significant driver of tropical deforestation in this region and elsewhere: direct observation in northern Mato Grosso has shown that the large majority of deforested land gets converted to agricultural land uses (Morton et al. Reference Morton, DeFries, Shimabukuro, Anderson, Arai, Espirito-Santo, Freitas and Morisette2006). Rather, we suggest that there is no tight correlation through time between the rate of expansion of agriculture and the rate at which deforestation occurs. This probably reflects the fact that many ongoing processes, acting in concert, combine to drive temporal variation in the rate of annual deforestation. Our results are in line with previous analyses which have concluded that it is often impossible to isolate a single cause of tropical deforestation (Geist & Lambin Reference Geist and Lambin2001), and suggest that it is not yet possible to predict with accuracy the likely impacts of future agricultural changes on the speed at which the deforestation frontier will advance.
Assessing causality in time-series data requires detailed statistical analysis: simple correlations of data points from one time series with another is not adequate and will almost inevitably lead to spurious conclusions with apparently high explanatory power (Gujarati Reference Gujarati2003). For example, we found strongly significant correlations between eight variables and deforestation rate (Table 2), and almost all of the eight variables were significantly intercorrelated (Table 1). Such high intercorrelations are expected in time series when the separate variables all exhibit a temporal trend (Gujarati Reference Gujarati2003). Consequently, simplistic correlative analyses of one or a few variables against deforestation rate will likely generate spurious results.
The intercorrelated nature of the predictor variables that have been postulated to drive variation in deforestation rates should serve as ample warning that determining the causes of variability in deforestation rates is not going to be easy. Two often-raised hypotheses are that increases in the size of the cattle herd or the area of soybean farms drive variation in Amazonian deforestation. We found that these two variables are so tightly intercorrelated as to defy any statistical attempt to separate them (r > 0.8). Moreover, they both had equally strong correlations with the availability of credit in the domestic economy, which is thought to promote the expansion of agriculture (Barreto et al. Reference Barreto, Souza Jr, Noguerón, Anderson and Salomão2006b). A further confounding effect was identified by Kaimowitz et al. (Reference Kaimowitz, Mertens, Wunder and Pacheco2004), who suggested that much of the increase in the cattle herd over the period 1990–2002 could be attributed to a concurrent devaluation of the Brazilian currency that approximately doubled the value of beef exports to Brazilian farmers. With such tight inter-correlations, it quickly becomes impossible to distinguish the causal factors from the correlated, but not causal, factors with any certainty. One option to try and disentangle these correlated factors is to investigate deforestation patterns at a finer spatial scale, taking advantage of spatial variation in the factors. For example, some states and political districts are dominated by one or other of soybean plantations or cattle herds, and it may be possible to exploit that variation for future analyses.
When we employed a statistically valid time-series method of analysis, we found no evidence that changes in the domestic economy, agricultural expansion or commodity prices had consistent impacts on the rate of deforestation from 1990–2005. Our analysis comes with caveats, however. Our statistical power could detect only strong effects of these variables on deforestation. Consequently, we can not rule out the possibility that there are significant, but weak or even medium-sized effects that occur, but which we did not detect. It seems likely that some of these effects exist, especially given the broadly held view that agricultural expansion and deforestation rate are inextricably linked. However, our power analysis suggests that it will be the year 2074 before the time series is long enough to provide sufficient statistical power to test for those effects. The compilation of temporal data at a finer spatial scale, such as at the state or political district level, may provide an alternative avenue for increasing the power of this style of analysis. Controlling deforestation rates is a pressing issue in a world attempting to combat unparalleled rates of climate change and species extinctions, and it is clearly infeasible to wait many years to attempt to elucidate the drivers of deforestation rates.
How can our results be reconciled with the body of literature surrounding the link between agricultural expansion and Amazonian deforestation? One obvious solution is that agricultural expansion does not necessarily require the conversion of forest. For example, one-third of new soy cropland established in the state of Mato Grosso between 2001 and 2004 was from the conversion of existing pasture or natural grasslands (Morton et al. Reference Morton, DeFries, Shimabukuro, Anderson, Arai, Espirito-Santo, Freitas and Morisette2006), although it is possible that this pattern had the side effect of displacing cattle pastures deeper into forested regions. Moreover, increases in agricultural yields could lead to an expansion of the Amazonian cattle herd that is not directly tied to an expansion of the amount of pasture. Instead, land sparing may occur, whereby pressure on intact habitats is reduced because increasing demand for agricultural products may be met from increasing yields from existing farmland (Balmford et al. Reference Balmford, Green and Scharlemann2005; Green et al. Reference Green, Cornell, Scharlemann and Balmford2005).
The spatial and temporal scale of analysis could distort the results of this and other analyses. For example, using a single time step of 1990 to 2001, Kaimowitz et al. (Reference Kaimowitz, Mertens, Wunder and Pacheco2004) found a very tight correlation between the size of the increase in the cattle herd and the amount of deforestation within the nine Amazonian states of Brazil. We found no such relationship when analysed at the larger spatial scale of the entire Brazilian Amazon, but with a much finer temporal resolution of just one-year time steps. This raises two possible routes for synthesizing our results with the wider literature. First, the impact of a given variable may depend on the spatial scale at which it is measured. Deforestation rates vary greatly among the nine states comprising the Brazilian Amazon, and this may reflect different economic, political and agricultural realities within the different political units. We know that the spatial patterns of deforestation in the Brazilian Amazon are scale-dependent (Ewers & Laurance Reference Ewers and Laurance2006), so it is possible that the determinants of deforestation rates may exhibit a similar pattern. We investigated deforestation using a single model for the entire Brazilian Amazon because the proportional distribution of deforestation across the nine separate states was relatively stable through time (Fig. 2), indicating that temporal fluctuations in deforestation rates occur equally in all states and that all states are responding to the same causal processes. We also found that many of the hypothesized causal factors were correlated in time, but they are not necessarily correlated in space. Exploiting spatial variation in the causal factors at the state and political district level may help to elucidate fine-scale causative processes that are overlooked in our basin-scale analysis.
Second, our analysis was unlikely to detect changes in the specific nature of the drivers of deforestation rates through time. For example, visual inspection of graphs suggests that the price of soybeans was very closely correlated with deforestation rate for the period 2001–2006 (Fig. 3), but prior to that period there was little apparent relationship. A recent spike in soy prices in late 2007 that is possibly attributable to new USA subsidies for biofuels leading to a switch from soy to corn production in the USA, has been linked to accelerated deforestation across the Brazilian Amazon (Laurance Reference Laurance2007). The implication is that changing soy prices may now be a strong driver of deforestation rates but it has not always been the case, possibly because soy plantations were initially concentrated in the cerrado areas and have only begun expanding into forest areas in the recent past. A comprehensive meta-analysis of tropical deforestation around the world has previously shown that the causes of deforestation within a region, including the Brazilian Amazon, notably vary through time (Rudel Reference Rudel2005). Our analysis was designed to find causal effects that have long-running impacts on deforestation. Unfortunately, the time-series data that were available for this study were too short to allow us to divide it into halves to investigate the possibility that the drivers of deforestation have changed in recent times.

Figure 3 Trends in the price of soybeans (solid line) and deforestation rate for the Brazilian Amazon (bars) over the period 1990–2006. Soy prices and deforestation rates appear to be coupled since c. 2001, but were not correlated prior to then.
One important implication from our analysis concerns the potential payments to developing nations for reducing carbon emissions from deforestation and forest degradation (REDD). Brazil has been considered a prime candidate for a REDD programme, partly because of its vast forest estate and also because of its detailed forest monitoring schemes (Nepstad et al. Reference Nepstad, Soares-Filho, Merry, Moutinho, Rodrigues, Bowman, Schwartzman, Almeida and Rivero2007). One of the key features of any REDD programme is that reduced emissions must be calculated as deviation from a baseline deforestation rate (Mollicone et al. Reference Mollicone, Achard, Federici, Eva, Grassi, Belward, Raes, Seufert, Stibig, Matteucci and Schulze2007). If, as our analysis suggests, there is no sure way for estimating how much deforestation would have occurred in the absence of a REDD programme, then time-series models of future deforestation should not be relied upon to determine the carbon emissions that were avoided by implementing a programme (Kerr et al. Reference Kerr, Hendy, Liu and Pfaff2004). Rather, historical observed deforestation estimates should be used to assess the magnitude of the reduction in carbon emissions from avoided deforestation.
ACKNOWLEDGEMENTS
We thank Rhett Butler, Phil Fearnside and Thomas Rudel for thoughtful discussions. The work of CMS was supported by the David and Lucile Packard Foundation.


