


1 Introduction
Laminar flow of Newtonian fluids in circular pipes is well known to undergo a transition to turbulence at a Reynolds number of approximately 2000 under usual laboratory conditions (Reynolds Reference Reynolds1883; Sharp & Adrian Reference Sharp and Adrian2004; Jackson & Launder Reference Jackson and Launder2007). For pipe flow of viscoelastic polymer solutions, at sufficiently high polymer concentrations, the possibility of transition occurring at Reynolds numbers lower than 2000 was first suggested by Forame, Hansen & Little (Reference Forame, Hansen and Little1972) and Hansen, Little & Forame (Reference Hansen, Little and Forame1973), wherein a deviation of the wall shear stress from its laminar value was considered as an indication of transition. Zakin et al. (Reference Zakin, Ni, Hansen and Reischman1977) corroborated this observation by detecting a flattening of the velocity profile (obtained from laser Doppler velocimetry (LDV) measurements) in the transition regime. Draad, Kuiken & Nieuwstadt (Reference Draad, Kuiken and Nieuwstadt1998) also showed that addition of polymer decreased  $Re_{t}$ as compared to that for a Newtonian fluid. More recently, Samanta et al. (Reference Samanta, Dubief, Holzner, Schäfer, Morozov, Wagner and Hof2013) and Choueiri, Lopez & Hof (Reference Choueiri, Lopez and Hof2018) have unambiguously established that there is a possibility of the transition occurring at a Reynolds numbers significantly lower than 2000. This phenomenon is referred to as ‘early transition’ and the turbulent state that ensues, dominated both by fluid inertia and viscoelasticity, is referred to as ‘elasto-inertial turbulence’. A follow-up study by Chandra, Shankar & Das (Reference Chandra, Shankar and Das2018) corroborated the observation of early transition in microtubes using micro particle image velocimetry (micro-PIV) measurements. It is also well known that the addition of polymers can lead to substantial reduction in drag in the turbulent regime (Draad et al. Reference Draad, Kuiken and Nieuwstadt1998; White, Somandepalli & Mungal Reference White, Somandepalli and Mungal2004; White & Mungal Reference White and Mungal2008; Graham Reference Graham2014). The conventional viewpoint in the field has been that there is a limit to the extent of drag reduction achieved as the concentration of the polymer is increased, and this limiting regime is referred to as the maximum drag reduction (MDR) asymptote. For sufficiently dilute polymer solutions, as
  $Re$ is increased, transition occurs first and the friction factor is substantially higher than its laminar value. At a higher
  $Re$, the friction factor decreases indicating that drag is reduced in a polymer solution compared to its Newtonian counterpart. For much higher concentrations of the added polymer, however, the approach to MDR can be direct, without having to pass through the Newtonian turbulent regime. This is sometimes referred to in the literature as ‘Type B’ drag reduction (White et al. Reference White, Somandepalli and Mungal2004; White & Mungal Reference White and Mungal2008). A recent study by Choueiri et al. (Reference Choueiri, Lopez and Hof2018) has questioned the uniqueness of the MDR state, by showing that the flow relaminarizes as the concentration of the polymer is increased (from the MDR state; at fixed
  $Re$), and at even higher concentrations, the laminar flow of a (not-so-dilute) polymer solution once again becomes unstable, exhibiting higher drag and eventually approaching the MDR regime once again. The authors argue that the instability at high concentrations is the one that leads to elasto-inertial turbulence. This new result suggests that the approach to MDR is not governed by a unique pathway. For low polymer concentrations, MDR is indeed approached from Newtonian turbulence, but at sufficiently higher concentrations, MDR can be reached via an instability of the laminar flow of the polymer solution. The study of Choueiri et al. (Reference Choueiri, Lopez and Hof2018) thus connects what were hitherto thought to be two disparate phenomena, viz., early transition/elasto-inertial turbulence and turbulent drag reduction. Several questions, however, remain open concerning these two phenomena, which provide the following motivations for the present experimental study:
(i) The first concerns the representation of data from different experimental studies using suitable dimensionless groups. It is reasonable to expect that the data for transition Reynolds number (denoted as  $Re_{t}$ henceforth) from different experiments should follow the same trend when plotted against suitable dimensionless group(s). The Reynolds number in this study is defined as
  $Re=(DV\unicode[STIX]{x1D70C})/\unicode[STIX]{x1D707}$, where
  $D$ is the tube diameter,
  $V$ is the cross-sectional average fluid velocity,
  $\unicode[STIX]{x1D70C}$ is the fluid density and
  $\unicode[STIX]{x1D707}$ is the zero-shear fluid viscosity. The study of Samanta et al. (Reference Samanta, Dubief, Holzner, Schäfer, Morozov, Wagner and Hof2013) uses pressure fluctuations in tubes of larger diameter
  $D\sim 4~\text{mm}$, while the study of Chandra et al. (Reference Chandra, Shankar and Das2018) uses micro-PIV measurements of velocity fluctuations in tubes of smaller diameter of
  ${\sim}0.5~\text{mm}$. When data from both the studies for
  $Re_{t}$ are plotted as a function of the dimensionless group,
  $E(1-\unicode[STIX]{x1D6FD})$, the results from the two studies do not agree with each other. Here,
  $E=(4\unicode[STIX]{x1D706}\unicode[STIX]{x1D707})/\unicode[STIX]{x1D70C}D^{2}$ is the elasticity number, where
  $\unicode[STIX]{x1D706}$ is the longest (zero-shear) relaxation time of the polymer solution. In the present study, we argue that the larger extent of shear thinning in the study of Chandra et al. (Reference Chandra, Shankar and Das2018) could have resulted in over-estimating the shear viscosity and relaxation times (and hence the elasticity numbers) in their study. To substantiate this hypothesis, in the present work, we carry out a systematic study to characterize the onset of elasto-inertial instability in the flow of polymer solutions through tubes of varying diameters to demonstrate that the results of Samanta et al. (Reference Samanta, Dubief, Holzner, Schäfer, Morozov, Wagner and Hof2013) and Chandra et al. (Reference Chandra, Shankar and Das2018) could be reconciled.
(ii) One of the traditional ways of detecting the onset of transition is the use of friction factor  $f$–
$f$– $Re$ data, and the
  $Re$ at which there is a deviation of the experimental data from the laminar friction factor value is taken to represent the onset of transition (Draad et al. Reference Draad, Kuiken and Nieuwstadt1998; Verma & Kumaran Reference Verma and Kumaran2012; Neelamegam & Shankar Reference Neelamegam and Shankar2015). Interestingly, for the Reynolds number
  $Re\sim 800$ when pressure fluctuations reveal a transition in the study of Samanta et al. (Reference Samanta, Dubief, Holzner, Schäfer, Morozov, Wagner and Hof2013), the corresponding friction factor remains close to
  $16/Re$. Thus, if the friction factor data reported in Samanta et al. (Reference Samanta, Dubief, Holzner, Schäfer, Morozov, Wagner and Hof2013) were used to infer the onset of transition in their experiments, the flow would be deemed to be in the laminar regime at
  $Re\sim 800$. Indeed, some earlier studies of Park et al. (Reference Park, Mannheimer, Grimley and Morrow1989), Escudier et al. (Reference Escudier, Poole, Presti, Dales, Nouar, Desaubry, Graham and Pullum2005) and Escudier, Nickson & Poole (Reference Escudier, Nickson and Poole2009) note that the use of pressure drop measurements may not accurately predict the onset of laminar–turbulent transition accurately in strongly shear-thinning fluids. In the present work, we show that
  $f$–
$f$– $Re$ data can indeed be used to infer the transition, but only after accounting for shear thinning of the polymer solution while estimating the friction factor in the laminar regime. We also show that the Reynolds number for onset of transition obtained from micro-PIV measurements and friction factor data are in good agreement, thereby providing an unambiguous detection of the onset of elasto-inertial instability in experiments.
(iii) The phenomenon of turbulent drag reduction has been widely studied (Virk et al. Reference Virk, Merrill, Mickley, Smith and Mollo-Christensen1967; Virk Reference Virk1975; Draad et al. Reference Draad, Kuiken and Nieuwstadt1998; White et al. Reference White, Somandepalli and Mungal2004; White & Mungal Reference White and Mungal2008; Graham Reference Graham2014) for the last five decades, but there have not been enough efforts to express the experimental data for drag reduction in terms of suitable dimensionless groups. While there is a conventional view (White & Mungal Reference White and Mungal2008) based on a ‘time criterion’ that  $Wi_{\unicode[STIX]{x1D70F}}=\unicode[STIX]{x1D706}V_{\unicode[STIX]{x1D70F}}/R\sim O(1)$ for the onset of drag reduction, where
  $V_{\unicode[STIX]{x1D70F}}$ is the friction velocity in turbulent flow, it has been recognized that this does not account for the concentration dependence of the onset of drag reduction. A recent study by Owolabi, Dennis & Poole (Reference Owolabi, Dennis and Poole2017) has accomplished this for the flow of polyacrylamide solutions through tubes and channels by varying the polymer concentration. In this study, we demonstrate how drag reduction data from different polymer solutions (of varying concentrations and molecular weights, flowing in tubes of different diameters) show a reasonable collapse when the percentage drag reduction and friction factor are plotted as a function of
  $Wi(1-\unicode[STIX]{x1D6FD})$. The factor of
  $(1-\unicode[STIX]{x1D6FD})$ accounts for the polymer concentration, thus allowing for concentration dependence of drag reduction.
(iv) We also explore the possibility of relaminarization of the transitional/turbulent flow upon addition of polymers in flow through microtubes. We show that at low polymer concentrations, the flow relaminarizes (in that the friction factor reduces to  $16/Re$), but upon further addition of polymer, the flow once again becomes unstable, accompanied by an increase in friction factor. This observation is broadly consistent with the recent experimental results of Choueiri et al. (Reference Choueiri, Lopez and Hof2018), and we discuss the various possible scenarios concerning this phenomenon.
In the remainder of this introduction, we provide a brief survey of the relevant literature while pointing out the issues that are yet unresolved and addressed in the present study.
1.1 Early transition in the flow of polymer solutions
In addition to the literature on early transition discussed above, there have been reports of an instability in the flow of polymer solutions at very low  $Re$ in micro-scale flows through channels and tubes, but only when a perturbed inlet condition was used (Bonn et al. Reference Bonn, Ingremeau, Amarouchene and Kellay2011; Pan et al. Reference Pan, Morozov, Wagner and Arratia2013; Bodiguel et al. Reference Bodiguel, Beaumont, Machado, Martinie, Kellay and Colin2015). Because the instability was sustained only via a disturbance provided at the inlet, this cannot be considered to be a spontaneous instability caused by infinitesimal disturbances. Samanta et al. (Reference Samanta, Dubief, Holzner, Schäfer, Morozov, Wagner and Hof2013) observed that for concentrations more than 300 ppm of polyacrylamide (PAAm), the transition
  $Re$ is independent of whether the transition is forced or not, thus suggesting that the onset could be driven by an instability to infinitesimal disturbances, in stark contrast to the Newtonian pipe flow transition. The recent study of Srinivas & Kumaran (Reference Srinivas and Kumaran2017) showed that for the flow of polymer solutions in rectangular microchannels, there could be an instability at
  $Re\sim 200$, while the onset of transition for Newtonian flows in channels occurs at
  $Re\sim 1200$, showing that the phenomenon of early transition could be independent of the flow geometry. Results from a linear stability analysis using the Oldroyd-B model seem to qualitatively agree with the experimental data quite well (Garg et al. Reference Garg, Chaudhary, Khalid, Shankar and Subramanian2018), further demonstrating that the onset of transition in viscoelastic pipe flow is very different from its Newtonian counterpart. Direct numerical simulations of viscoelastic FENE-P fluids in the channel geometry by Dubief, Terrapon & Soria (Reference Dubief, Terrapon and Soria2013), Sid, Terrapon & Dubief (Reference Sid, Terrapon and Dubief2018) and Shekar et al. (Reference Shekar, McMullen, Wang, McKeon and Graham2019) have shown that the turbulent state that ensues the instability is predominantly two-dimensional, in marked contrast to the distinctly three-dimensional scenario (via the appearance of ‘exact coherent states’; see, for example, the review of Eckhardt et al. (Reference Eckhardt, Schneider, Hof and Westerweel2007)) prevalent in Newtonian pipe flows.
Samanta et al. (Reference Samanta, Dubief, Holzner, Schäfer, Morozov, Wagner and Hof2013) detected the elasto-inertial instability by observing a jump in the normalized pressure fluctuations in the flow. For a 500 ppm polymer solution, the normalized pressure fluctuation showed a jump from its laminar value at  $Re=800$. However, for the same system, the friction factor started to deviate from the laminar value of
  $16/Re$ only beyond
  $Re\sim 2000$. Thus, purely based on the friction factor data alone, the flow would be deemed to be in the laminar regime. In the present work, we demonstrate that this discrepancy can be attributed to the fact that the 500 ppm PAAm solution exhibits shear thinning at the shear rates prevalent in experiments. Hence, the laminar friction factor estimate will have to be modified to account for shear thinning. Physically, the effect of shear thinning in the laminar regime is to reduce the friction factor compared to the Newtonian value given by
  $16/Re$. Consequently, if experimental friction factor data for polymer solutions are compared with the Newtonian result, the flow might be incorrectly interpreted to be in the laminar regime at a given
  $Re$, while the experimental values have already deviated from the friction factor corresponding to the shear-thinning fluid. To address this issue, we use the Carreau model to estimate the friction factor in the laminar regime for a shear-thinning fluid. By doing so, we demonstrate that it is possible to unambiguously infer the onset of early transition in the flow of polymer solution through microtubes from the
  $f$ versus
  $Re$ plot.
Chandra et al. (Reference Chandra, Shankar and Das2018) observed a jump in the normalized velocity fluctuations at  $Re=800$ for a
  $800~\text{ppm}$ PAAm solution. However, the tube dimensions used in Chandra et al. (Reference Chandra, Shankar and Das2018) were much smaller than the tube dimensions of Samanta et al. (Reference Samanta, Dubief, Holzner, Schäfer, Morozov, Wagner and Hof2013). Consequently, due to reduced tube diameters, the nominal elasticity numbers in the experiments of Chandra et al. (Reference Chandra, Shankar and Das2018) must be much higher. Despite reaching higher elasticity values, the
  $Re_{t}$ in the experiments of Chandra et al. (Reference Chandra, Shankar and Das2018) were not significantly different from those of Samanta et al. (Reference Samanta, Dubief, Holzner, Schäfer, Morozov, Wagner and Hof2013). In the present study, we reconcile this discrepancy by arguing that shear-thinning effects could be very dominant in the experiments of Chandra et al. (Reference Chandra, Shankar and Das2018) due to the smaller diameters used. It is well known that the solution viscosity and relaxation time are both decreasing functions of shear rate. It is thus possible that the actual elasticity numbers prevalent in the experiments of Chandra et al. (Reference Chandra, Shankar and Das2018) could be smaller than that estimated using zero-shear data. To validate this hypothesis, in the present work, we investigate the onset of elasto-inertial instability for different tube diameters and compare the onset of transition for different tube dimensions for various polymer concentrations. The extent of shear thinning is different for different tube diameters owing to the difference in shear rates. Thus, if this hypothesis is correct, the data for larger tube diameters should systematically get closer to those of Samanta et al. (Reference Samanta, Dubief, Holzner, Schäfer, Morozov, Wagner and Hof2013). In § 3, we demonstrate that this is indeed the case by a systematic study of transition in tubes of varying diameters.
1.2 Turbulent drag reduction
Toms (Reference Toms1948) first reported that addition of a small amount of high molecular weight polymer to an otherwise Newtonian solvent reduces turbulent drag in flow through a pipe, by up to 80 % (Virk Reference Virk1975; White & Mungal Reference White and Mungal2008). Since that discovery, there have been extensive studies which focused on drag reduction in flow through pipes and rectangular channels (Virk et al. Reference Virk, Merrill, Mickley, Smith and Mollo-Christensen1967; Virk Reference Virk1975; Draad et al. Reference Draad, Kuiken and Nieuwstadt1998; White & Mungal Reference White and Mungal2008; Graham Reference Graham2014). It is believed that the phenomenon of drag reduction is an outcome of a dynamical interaction between polymer molecules and turbulence. This can be concluded because laminar pipe or channel flows do not show any evidence of drag reduction, when shear-thinning effects are negligible. However, we show later in § 3 that when shear-thinning effects are dominant, then the laminar friction factor of a polymer solution will also be lower than its Newtonian counterpart. This reduction in drag in the laminar regime is purely due to the shear-thinning nature of the polymer solution. There are two types of drag reduction in the turbulent regime described in literature: ‘Type A’ drag reduction wherein the onset of drag reduction is observed only when the fully turbulent regime is reached. The second type involves a direct approach to drag reduction, without going through Newtonian turbulence, and is called ‘Type B’ drag reduction. The Reynolds number at which there is an onset of drag reduction decreases with increase in polymer concentration. Although the drag reduction literature is vast, there have been very few attempts to condense the experimental results using appropriate dimensionless groups. In addition to  $Re$, the extent of drag reduction could be expected to depend on polymer concentration, molecular weight and tube diameter. It would be useful to represent the drag reduction data obtained for different polymer solutions, tube diameters, flow rates etc., in terms of suitable dimensionless parameters. If the data plotted in terms of dimensionless parameters show good collapse, it would then demonstrate the generic nature of drag reduction that is independent of details of monomer chemistry (at the very least, for linear flexible polymers), and is dependent only on the coarse-grained rheological properties of polymer solutions. However, the majority of the literature available tends to report drag reduction data in terms of polymer concentration, without factoring in the molecular weight or relaxation time of the polymer solution. Moreover, most of the studies were carried out for tubes of relative larger diameters (
 ${\sim}10~\text{cm}$). Lee & Akhavan (Reference Lee, Akhavan and Eckhardt2009) used the FENE-P dumbbell model to obtain a relationship between polymer drag reduction with polymer properties and flow parameters. It was observed that the onset of drag reduction is a function of polymer concentration and
  $Wi$, where
  $Wi$ is the product of polymer solution relaxation time and the maximum shear rate encountered in the flow experiment. Drag reduction was found to be a strong function of
  $Wi$. It was further observed that the magnitude of drag reduction increases by increasing polymer concentration but eventually reaches a plateau and showed a decay when the polymer solution ceased to be dilute (
 $\unicode[STIX]{x1D6FD}<0.9$).
Owolabi et al. (Reference Owolabi, Dennis and Poole2017) investigated turbulent drag reduction in flow through rectangular ducts, square ducts and circular tubes. A relationship between drag reduction and fluid elasticity was developed by using semi-dilute PAAm solutions of different concentrations. Drag reduction, when plotted against  $Wi$, showed a remarkable data collapse, and that the onset of drag reduction took place at
  $Wi\sim 0.5$. The rheological characterization in this work was carried out using a capillary breakup extensional rheometer (abbreviated ‘CaBER’ henceforth), which made possible the accurate prediction of the degree of drag reduction using a single dimensionless group,
  $Wi$. Velocity profiles obtained using LDV measurements showed a thickened buffer layer in the drag-reduced state of the polymer solution, consistent with earlier literature (Hinch Reference Hinch1977). Gasljevic, Aguilar & Matthys (Reference Gasljevic, Aguilar and Matthys1999) performed experiments for measuring friction coefficient for drag-reducing polymer solutions for tube diameter in the range 2–50 mm. The percentage drag reduction scaled with the bulk fluid velocity, and the extent of drag reduction was higher for smaller diameter tubes as compared to a larger diameter tube for the same volumetric flow rate. Friction coefficient plots showed that smaller diameter tubes have lower friction coefficients values in the turbulent regime for a fixed
  $Re$. It was reported further by Gasljevic, Aguilar & Matthys (Reference Gasljevic, Aguilar and Matthys2001) that change in diameter only affects Type A drag reduction, in that the drag reduction only occurs after the flow becomes fully turbulent. It was suggested that the difference in drag-reducing properties for different tube diameters could be potentially due to the flow affecting the fluid properties differently for different tube diameters. However, Type B drag reduction was found to be independent of the tube diameter used. Further it was observed that for Type B drag reduction, the extent of drag reduction was independent of
  $Re$. A wide range of
  $Re$ was used in the study, and percentage drag reduction showed a remarkable data collapse when plotted with
  $Wi$. However, the experiments were only performed for PAAm solutions. To test for the generality of the observed single-parameter data collapse, different types of polymers with different molecular weights must be tested for data collapse, which will make the result more generic. Understanding drag reduction from a non-dimensional perspective can be very helpful in analysing and using drag reduction data for practical applications. Apart from the work of Owolabi et al. (Reference Owolabi, Dennis and Poole2017), there have been very few studies which represent drag reduction with respect to fluid elasticity parameters. In the present study, we investigate drag reduction in the post-transition regime for the flow of polymer solution through micro-sized tubes of different diameters, molecular weights and concentrations. When we plot the percentage drag reduction with
  $Wi(1-\unicode[STIX]{x1D6FD})$, we obtain a reasonable data collapse, thereby indicating that the extent of drag reduction can be related to a single dimensionless parameter.
1.3 Relaminarization at a fixed  $Re$
$Re$

It has been a long established paradigm that, with increasing polymer concentration, drag reduction reaches an asymptotic limit called the maximum drag reduction asymptote (Sreenivasan & White Reference Sreenivasan and White2000; Graham Reference Graham2004; White & Mungal Reference White and Mungal2008; Graham Reference Graham2014). Xi & Graham (Reference Xi and Graham2010) performed numerical simulations to investigate viscoelastic turbulent flows under various conditions. It was found that drag reduction reaches an upper limit with increasing polymer concentration which is linked to the maximum drag reduction limit. A recent study by Choueiri et al. (Reference Choueiri, Lopez and Hof2018) demonstrates the possibility of exceeding the limit of maximum drag reduction with further increase in concentration, albeit in a limited parameter regime. The authors focussed on the variation of friction factor with polymer concentration at fixed  $Re$. The friction factor values dropped below the MDR limit for a certain concentration regime, before increasing once again at higher concentrations. The authors attributed this ultimate increase to an elasto-inertial transition, wherein the flow state is qualitatively different from the Newtonian turbulent state. A recent DNS study by Shekar et al. (Reference Shekar, McMullen, Wang, McKeon and Graham2019) on viscoelastic channel flows also shows a very similar relaminarization. In the present study, we explore the possibility of relaminarization in microtubes, where the prevalent shear rates are significantly higher.
1.4 Objectives of the present work
Thus, the overall objectives of the present work are (i) to detect the onset of elasto-inertial turbulence by using friction factor measurements when shear-thinning effects are dominant, (ii) to reconcile the discrepancy between the results of Samanta et al. (Reference Samanta, Dubief, Holzner, Schäfer, Morozov, Wagner and Hof2013) and Chandra et al. (Reference Chandra, Shankar and Das2018) concerning the Reynolds number for onset of the transition, (iii) to study turbulent drag reduction in microtubes with a special focus on representing the data using relevant dimensionless groups and (iv) to explore the possibility of relaminarization of transitional/turbulent flow of polymer solutions in microtubes.
The rest of this paper is organized as follows: in § 2, we describe the experimental methodology and protocol used. Section 3 discusses results that exhibit early transition in polymer solutions. Section 4 presents results obtained for drag reduction in both polyacrylamide (abbreviated PAAm) and polyethylene oxide (abbreviated PEO) solutions. Section 5 provides a critical discussion of the present experimental results and their connection to previous studies. Section 6 presents the salient conclusions of this study. Appendix A provides the details regarding the use of Carreau model to estimate friction factor in the laminar regime of shear-thinning polymer solutions.
2 Experimental protocol
A tubular bore is fabricated in a hard polydimethyl siloxane (PDMS) block which serves as the rigid tube, and the experimental protocol used is similar to our earlier study (Chandra et al. Reference Chandra, Shankar and Das2018). A copper wire is held straight using a screw mechanism as shown in figure 1. Double sided tapes are used to create a well-like arrangement for creating the PDMS block. Elastomeric base (85 %) and cross-linker (15 %) are mixed thoroughly using a stirrer and is then placed in a vacuum chamber to remove any air bubbles present in the mixture. The mixture thus prepared is slowly poured into the prepared well and is cured at  $100\,^{\circ }\text{C}$ for 12 h. The cured PDMS is then dipped in toluene for 4 h for swelling. The copper wire is then easily removed from the swollen PDMS block. The swollen PDMS block is now de-swelled by keeping the PDMS block in a refrigerator at low temperature to avoid crack formation. The diameter of the tube was measured at different axial locations of the prepared tube using a microscope and it was observed that the variation of diameter of the tube with axial location is less 1 % of the mean. Tubes of larger diameter, viz., 1.24 mm and 2.84 mm are made of glass, and the variation of the diameter over length is much lower.

Figure 1. Schematic figure showing the fabrication protocol for the preparation of tubular bore in a PDMS block.

Figure 2. Experimental set-up for measuring pressure for flow through the 0.49 mm micro-tube. For larger diameters of tubes i.e. 1.24 mm and 2.84 mm, glass tubes have been used.
Additionally, a pressure port is introduced in the tube during fabrication by placing a hollow stainless steel tube as shown in figure 1. The stainless steel tube is replaced by a syringe needle of the same diameter to connect the pressure sensor to the PDMS tube. The pressure sensor (Futek, USA) is further connected to a computer via a display unit for recording pressure data (figure 2). Pressure data are recorded by using a software (Sensit) at a rate of 100 Hz. Five hundred data points are recorded for each run. The pressure transducer used can measure pressure in the range of  $10^{4}$ to 50 psi. Each data point corresponds to results from experiments that are repeated thrice and it is found that the standard deviation in measurement of pressure drop is less than 2 %.
Pressure-driven flow is carried out using a syringe pump (Nexus 6000, Chemyx) with a stainless steel syringe (Chemyx) for maintaining precision flow. The flow rate delivered by the syringe pump is verified by measuring the liquid output from the test section for a fixed time interval. The volumetric flow rate thus calculated is compared to the flow rate displayed on the pump. The volume of the syringe used for pumping is 200 ml. The range of flow rate of the syringe pump ranges from  $0.0001$ to
  $420~\text{ml}~\text{min}^{-1}$. Flow from the pump is verified by collecting the output of the flow for a fixed time. The output of the flow is measured using a measuring cylinder and the flow rate is calculated by using the volume of the fluid and the time for which the flow output was collected. The stainless steel syringe is connected to a silicone tube which is further connected to the microtube seamlessly by using a micro-tip. Pressure drop measurements are carried out at a distance of
  $100D$ from the inlet, where
  $D$ is the tube diameter. Experiments are performed at room temperature of
  $25\,^{\circ }\text{C}$ maintained using air conditioners.
Fanning friction factor,  $f$, is calculated by using
  $f=(\unicode[STIX]{x0394}PD)/(2L\unicode[STIX]{x1D70C}V^{2})$, where
  $\unicode[STIX]{x0394}P$ is the measured pressure drop,
  $L$ is the length across which the pressure is measured,
  $V$ is the average fluid velocity calculated from the mean flow rate and
  $\unicode[STIX]{x1D70C}$ is the density of the fluid used. The mean flow rate was measured by collecting water at the exit of the tube over a time interval, and also by using the piston velocity in the syringe pump. For all our experiments, Reynolds number,
  $Re$ is defined as
  $Re=(DV\unicode[STIX]{x1D70C})/\unicode[STIX]{x1D707}$ and
  $Wi$ is defined as the product of average shear rate and relaxation time of the polymer solution. In the present study, we use the zero-shear viscosity of the polymer solution while calculating
  $Re$. The average shear rate is calculated as the ratio of average velocity and the diameter of the micro-tube. For performing micro-PIV experiments, the polymer solution prepared is mixed with appropriate amount of fluorescent polystyrene particles of size
  $3.2~\unicode[STIX]{x03BC}\text{m}$. The experimental set-up for micro-PIV analysis is identical to the micro-PIV set-up used in Chandra et al. (Reference Chandra, Shankar and Das2018). A TSI micro-PIV set-up is used which consists of a CCD camera (of resolution 8 MP) for capturing images, a Nd:YAG laser (Quantel, pulse frequency 7.5 Hz, 75 mW, wavelength 532 nm) for illuminating the fluorescent particles, a synchronizer for synchronizing the camera and the laser and a microscope to view the micro-tube.

Figure 3. Comparison of present friction factor results with those of Neelamegam & Shankar (Reference Neelamegam and Shankar2015). Solid line represents the laminar line and dashed line is the turbulent Blasius line. Panel (b) represents the normalized deviation in friction factor from its laminar value as a function of  $Re$.
$Re$.
The zero-shear viscosity of polymer solutions is measured using a rheometer (TA Discovery DHR-3). A concentric cylinder geometry is used to measure viscosity of the polymer solutions. It is to be noted that viscosity of solutions with concentration below 20 ppm was very difficult to measure accurately using the rheometer and hence viscosity for low polymer concentrations was obtained by performing a linear fit on the higher concentration viscosity data and then extrapolating the fitted line to the required lower concentration.
2.1 Validation of pressure drop measurements
The experimental protocol for pressure drop measurements in our set-up is validated by using the laminar–turbulent transition of pure water (i.e. a Newtonian fluid) through a 0.49 mm tube. For the flow of a Newtonian fluid in the laminar regime in a rigid tube the Fanning friction factor varies as  $16/Re$. The laminar value of
  $16/Re$ is generally followed up to
  $Re\sim 2000$. Beyond
  $Re\sim 2000$, the friction factor data shift from the
  $16/Re$ line. For the turbulent regime, the Fanning friction factor follows the Blasius correlation of
  $0.079Re^{-0.25}$. Neelamegam & Shankar (Reference Neelamegam and Shankar2015) performed pressure drop experiments for a rigid tube for a 1.65 mm tube made of PDMS of shear modulus
  ${\sim}0.6~\text{MPa}$. The tubes in the present experiments are also made of hard PDMS. Hence a comparison of the data between Neelamegam & Shankar (Reference Neelamegam and Shankar2015) and our results is appropriate to validate the friction factor data. Figure 3 shows a comparison between the present data and Neelamegam & Shankar (Reference Neelamegam and Shankar2015) for the friction factor in the laminar and turbulent regimes. We observe that the friction factor value deviates from the laminar friction factor line of
  $16/Re$ at
  $Re=1900$. The data from the present experiments and the data in Neelamegam & Shankar (Reference Neelamegam and Shankar2015) match very well in both regimes. This validates the pressure drop measurements in the present experimental set-up.

Figure 4. Friction factor data for 500 ppm solution taken from Samanta et al. (Reference Samanta, Dubief, Holzner, Schäfer, Morozov, Wagner and Hof2013). Solid line represents the Carreau fit for the 500 ppm PAAm solution used in the experiments and dashed line depicts the laminar regime for a Newtonian fluid without shear thinning. Inset shows the same plot in a linear scale near to the transition regime. The vertical dotted line shows the  $Re$ at which the friction factor data deviate from the laminar friction factor data (corrected for shear thinning). Panel (b) represents the normalized deviation in friction factor from its laminar value as a function of
  $Re$.
$Re$.
3 Early transition in polymer solutions

Figure 5. Friction factor charts for 100 ppm PAAm solutions. Solid line depicts the numerical Carreau model fitting for the corresponding concentration of polymer used. Dotted line depicts the laminar regime for a Newtonian fluid without the effect of shear thinning. Dotted line with symbol on top is an indicator for the onset of transition as marked by a deviation from the laminar Carreau model prediction. Panel (b) represents the normalized deviation in friction factor from its laminar value as a function of  $Re$.
$Re$.
We first revisited the earlier experimental data of Samanta et al. (Reference Samanta, Dubief, Holzner, Schäfer, Morozov, Wagner and Hof2013) for the flow of 500 ppm PAAm solution through 4 mm tube. We replotted their data for  $f$ versus
  $Re$, and we also plot the laminar friction factor as computed from the Carreau model (figure 4a). The procedure followed to obtain the friction factor versus
  $Re$ relation for a shear-thinning Carreau model is described in appendix A. The power law index
  $n=0.974$ was used in the Carreau model as reported in their characterization of the polymer solution. This figure shows that the friction factor data of Samanta et al. (Reference Samanta, Dubief, Holzner, Schäfer, Morozov, Wagner and Hof2013), at sufficiently low
  $Re\sim 800$, are consistently below the
  $16/Re$ line (shown as a dotted line in figure 4a), suggesting that shear thinning is important for the
  $Re$ considered in their experiments. Although the deviation in the laminar friction factor line from the Newtonian reference is not very large, nonetheless it plays a role in determining the point of departure of the experimental friction factor data of Samanta et al. (Reference Samanta, Dubief, Holzner, Schäfer, Morozov, Wagner and Hof2013) from the Newtonian laminar line. Considering the new Carreau fit line constructed in this study, the transition
  $Re$ is obtained at
  $Re\sim 1200$, whereas using the Newtonian relation would indicate that the flow is laminar up to
  $Re\sim 2000$. Thus, incorporating shear-thinning effects influences the determination of
  $Re_{t}$ even in the experimental data of Samanta et al. (Reference Samanta, Dubief, Holzner, Schäfer, Morozov, Wagner and Hof2013). For our experiments in microtubes, the shear rates encountered are much higher, and shear-thinning data are not accessible at such shear rates using conventional rheometers. In the absence of shear-thinning data, we directly fit the Carreau model constants with experimental friction factor data, as described in appendix A.
Figure 5 shows that for the 100 ppm PAAm solution, the flow remains laminar up to  $Re=2000$. The
  $Re_{t}$ for Newtonian fluid flow (i.e. water) in our experiments is 1900, as inferred from the deviation of friction factor data from their laminar values. Thus, when compared to the transition for pure water (figure 12a) for the same tube diameter, there is slight delay in
  $Re_{t}$ for the 100 ppm PAAm solution. This observation is consistent with Chandra et al. (Reference Chandra, Shankar and Das2018) and Samanta et al. (Reference Samanta, Dubief, Holzner, Schäfer, Morozov, Wagner and Hof2013), wherein small amounts of polymer (typically
  ${<}200~\text{ppm}$ PAAm) show delayed transition as compared to Newtonian flows. To explore the possibility of obtaining signatures of early transition by using friction factor charts, we performed pressure drop experiments for 200–800 ppm PAAm solutions. The laminar line for the friction factor chart is obtained using the numerical Carreau model fitting. A deviation of the friction factor data from the laminar Carreau model line is considered as an indication of transition. When the friction factor values are more than 5 % of the laminar friction factor value, we consider the flow to be no longer laminar and the corresponding
  $Re$ is designated to be
  $Re_{t}$. Figure 6 depicts friction factor charts for 300 and 400 ppm PAAm solutions through a 0.49 mm tube. This figure clearly demonstrates the importance of accounting for shear thinning while calculating the laminar friction factor, since, for a given
  $Re$, the friction factor for flow of polymer solutions is significantly lower than the Newtonian
  $16/Re$ value. This reduction in friction factor in the laminar regime is purely caused by the shear-thinning nature of the fluid, and is qualitatively different from drag reduction due to polymer addition in the turbulent regime. Further, the experimental data deviate from the actual laminar line at
  $Re\sim 1600$, but deviate from the
  $16/Re$ line only for
  $Re\sim 2600$. This clearly underscores the importance of incorporating shear thinning in the detection of the
  $Re$ at which there is an onset of transition. Increase in polymer concentration to
  $400~\text{ppm}$ further decreases the transition
  $Re$ to
  ${\sim}1400$. The transition
  $Re\sim 1200$ obtained for 500 ppm PAAm solution (data not shown) is in close agreement to the transition
  $Re$ obtained from the micro-PIV results of Chandra et al. (Reference Chandra, Shankar and Das2018), wherein a jump in normalized velocity fluctuations was considered as an indication for the onset of transition.

Figure 6. Friction factor charts for (a) 300 ppm and (c) 400 ppm PAAm solutions. The solid line depicts the numerical Carreau model fitting corresponding to the concentration of polymer used. The dotted line depicts the laminar prediction for a Newtonian fluid without shear thinning. Dotted vertical line with symbol on top is an indicator for the onset of transition as marked by a deviation from the laminar Carreau model prediction. For the 300 ppm solution, the MDR asymptote is also plotted and our experimental data (for  $Re>2500$) approach this asymptote. Panels (b,d) represent the normalized deviation in friction factor from its laminar value at the given
  $Re$ for 300 ppm PAAm and 400 PAAm respectively.
Friction factor charts are further obtained from pressure drop measurements for 600–800 ppm PAAm solutions, for which a representative plot for 800 ppm PAAm is shown in figure 7. For the highest concentration of PAAm used, the  $Re_{t}\sim 900$ which is in close agreement to the
  $Re_{t}$ obtained using micro-PIV in Chandra et al. (Reference Chandra, Shankar and Das2018). Figure 8 shows friction factor for 600 ppm PAAm solution for flow through 2.84 mm tube. The solid line depicts the numerical Carreau model fitting for the corresponding concentration of the polymer used. The difference between the laminar friction factor line and the Carreau fit line is not very prominent for the 2.84 mm tube, owing to the lower shear rates prevalent in these tubes. For a 600 ppm PAAm solution, however, a deviation from the laminar Fanning friction factor is observed at
  $Re_{t}\sim 1460$.
The manner in which the friction factor deviates from the laminar value for polymer solutions (figures 6 and 7) is distinctly different from the Newtonian case shown in figure 3, in that the increase in  $f$ is rather gradual for polymer solutions, in contrast to a rather steep increase for Newtonian flows. This could perhaps be attributed to the difference in the mechanism of onset of instability in Newtonian and polymeric flows. In Newtonian fluids, the transition is strongly subcritical, thereby suggesting that there are no ‘nearby’ flow states to the laminar regime, leading to a jump in friction factor. For transition in polymeric solutions, the earlier work of Samanta et al. (Reference Samanta, Dubief, Holzner, Schäfer, Morozov, Wagner and Hof2013) has shown that for concentrations greater than
  $300~\text{ppm}$, the transition
  $Re$ is independent of whether the flow is perturbed or not. Further, the theoretical study of Garg et al. (Reference Garg, Chaudhary, Khalid, Shankar and Subramanian2018) has shown that pipe flow of viscoelastic (Oldroyd-B) fluids is linearly unstable to infinitesimal disturbances. It is conceivable that the linear instability could lead to a supercritical state in the vicinity of the laminar flow, which would imply that the friction factor corresponding to such supercritical flow states will deviate rather smoothly from the laminar value. We discuss the possibility of this scenario below in figure 11.

Figure 7. Friction factor chart for 800 ppm PAAm solution. Solid line depicts the numerical Carreau model fitting corresponding to the concentration of polymer used. Dotted line depicts the laminar prediction for a Newtonian fluid without shear thinning. The dotted vertical line with symbol on top is an indicator for the onset of transition as marked by a deviation from the laminar Carreau model prediction. Panel (b) represents the normalized deviation in friction factor from its laminar value as a function of  $Re$.
$Re$.

Figure 8. Friction factor for 600 ppm PAAm solution for flow through 2.84 mm tube. Solid line depicts the numerical Carreau model fitting corresponding to the concentration of polymer used. Dotted line depicts the laminar prediction for a Newtonian fluid without shear thinning. Dotted vertical line with symbol on top is an indicator for the onset of transition as marked by a deviation from the laminar Carreau model prediction. Panel (b) represents the normalized deviation in friction factor from its laminar value as a function of  $Re$.
$Re$.

Figure 9. Friction factor charts for 300 ppm PEO solutions. Solid line depicts the numerical Carreau model fitting corresponding to the concentration of polymer used. Dotted line depicts the laminar prediction for a Newtonian fluid without the effect of shear thinning. Dotted vertical line with symbol on top is an indicator for the onset of transition as marked by a deviation from the laminar Carreau model prediction. Panel (b) represents the normalized deviation in friction factor from its laminar value as a function of  $Re$.
$Re$.
Figure 9 shows the friction factor data for the flow of 300 ppm PEO solution through a 2.84 mm tube. The 100 ppm PEO solution shows a delay in transition compared to a Newtonian fluid. However, the 200 ppm and 300 ppm PEO solutions show early transition as compared to pure water, consistent with the micro-PIV results of Chandra et al. (Reference Chandra, Shankar and Das2018). Thus, the use of friction factor chart for detecting early transition seems consistent for different polymer solutions, of different molecular weights and for flow through different tube diameters. This observation not only further corroborates the existence of elasto-inertial turbulence, but for the first time, the fundamental method of plotting friction factor chart for observing laminar–turbulent transition is used to detect laminar–turbulent transition in the flow of shear-thinning polymer solution through tubes. It is believed that addition of any amount of polymer to an otherwise Newtonian solution in the turbulent regime reduces drag which is restricted by the maximum drag reduction limit. However, if the flow is in the post-transition regime for a moderately concentrated polymer solution (300–800 ppm for our experiments), friction losses are higher for the polymer solution compared to a Newtonian solution at the same  $Re$, since the Newtonian solution is still in the laminar regime.
Table 1 summarizes our experimental data for the onset of  $Re$ from friction factor charts for PAAm solutions and table 2 summarizes the onset
  $Re$ for PEO solutions. It is consistently observed that high polymer concentration leads to early transition. We also compare (figure 10) the
  $Re_{t}$ as obtained in the present study using the deviation of friction factor from its laminar value along with the micro-PIV data of Chandra et al. (Reference Chandra, Shankar and Das2018). The data from the two different methods seem to agree reasonably well, thus illustrating the robustness of either method.

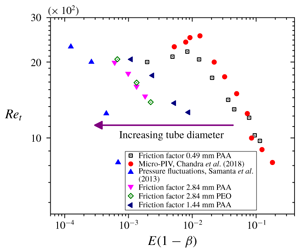
Figure 10. Variation of  $Re_{t}$ with the dimensionless group
  $E(1-\unicode[STIX]{x1D6FD})$ for different polymer solutions and tube diameters. The
  $Re_{t}$ obtained using friction factor measurements in the present study are consistent with those obtained from the micro-PIV measurements of Chandra et al. (Reference Chandra, Shankar and Das2018).
Table 1. Variation of  $Re_{t}$ with polymer concentration for PAAm solutions for two different tube diameters 0.49 mm and 2.84 mm. The uncertainty in obtaining
  $Re_{t}$ is less than
  $\pm 10$.


Figure 11. Normalized deviation in friction factor as a function of normalized deviation of  $Re$ from
  $Re_{t}$ for 300 ppm, 400 ppm and 800 ppm PAAm solutions. The solid lines represent power law fitting with
  $(Re/Re_{t}-1)^{1/2}$ which is suggestive of a supercritical bifurcation.
In figure 11, we replot our friction factor data in the form of normalized deviation in friction factor  $(f-f_{lam})/f_{lam}$ as a function of normalized deviation of
  $Re$ from
  $Re_{t}$. If the laminar flow is indeed unstable to infinitesimal perturbations, and if the bifurcation at the onset of instability is a supercritical bifurcation (Drazin & Reid Reference Drazin and Reid1981), the amplitude of the ensuing bifurcated solution should grow as
  $\unicode[STIX]{x1D716}^{1/2}$ where
  $\unicode[STIX]{x1D716}=(Re-Re_{t})/Re_{t}$ is the normalized deviation of
  $Re$ from
  $Re_{t}$. Figure 11 shows the data plotted in this manner for 300, 400 and 800 ppm PAAm solutions. It is seen that the bifurcation plots follow a scaling relationship of
  $((f-f_{lam})/f_{lam})\sim ((Re/Re_{t})-1)^{1/2}$ which suggests that the transition is supercritical in nature. However, in order to confirm this unambiguously, it is necessary to obtain more data as close to the transition as possible in order to establish a smooth and continuous variation at the onset of transition.
Table 2. Variation of  $Re_{t}$ with polymer concentration for PEO solutions for two different tube diameters 0.49 mm and 2.84 mm. The uncertainty in obtaining
  $Re_{t}$ is less than
  $\pm 10$.

4 Drag reduction in dilute polyacrylamide and PEO solutions
We next probe drag reduction in the turbulent regime in flow through microtubes. Figure 12(a) shows the friction factor for the flow of PAAm 0–30 ppm ( $\text{MW}=5\times 10^{6}$; 0–30 ppm) solutions with increasing
  $Re$ in a tube of diameter
  $490~\unicode[STIX]{x03BC}\text{m}$. Firstly, for concentrations lower than
  ${\sim}20~\text{ppm}$, the onset of transition occurs at
  $Re_{t}\sim 1900$ quite similar to that of a Newtonian fluid, but for the 30 ppm solution, the transition is slightly delayed to
  $Re_{t}\sim 2000$. For lower concentrations (
 ${\sim}1~\text{ppm}$), the friction factor for the flow of polymer solutions approaches the Newtonian (Blasius) line. However, even for 2 ppm solutions, the friction factor is lower than the Newtonian value, suggesting that for microtubes, drag reduction is seen even for 2 ppm solutions. Drag reduction at very low concentration could be also related to the high molecular weight of the polymer used. Oliver & Bakhtiyarov (Reference Oliver and Bakhtiyarov1983) observed drag reduction at concentrations as low as 0.02 % for high molecular weight polymer solutions. This could be attributed to the high elasticity associated with high molecular weight polymers. Within the range of
  $Re$ probed, we do not see the data approach MDR for lower concentrations, and presumably this will happen at much higher
  $Re$. Increasing the concentration of PAAm solution (at fixed
  $Re$) increases drag reduction in the transition regime at all
  $Re>2000$. For sufficiently higher concentrations (
 ${\sim}30~\text{ppm}$), the friction factor does not approach the Newtonian turbulent limit at all, and there is a direct cross-over to MDR. Thus, our results for higher concentrations are consistent with the ‘Type B’ drag reduction scenario. Since the diameters of tubes in our experiments are very small, the elasticity number is very high and hence we observe large drag reduction even at very low PAAm concentration. Figure 12(b) shows the friction factor for the flow of PEO (
 $\text{MW}=8\times 10^{6}$; 0.5–20 ppm) solutions with increasing
  $Re$ in a tube of diameter
  $490~\unicode[STIX]{x03BC}\text{m}$, and again drag reduction is observed at very low polymer concentration. The extent of drag reduction is higher as compared to a PAAm solution for the same concentration, arguably due to the higher molecular weight of the PEO solution used.

Figure 12. (a) Friction factor chart for the flow of 0–30 ppm PAAm solutions through 0.49 mm tube and (b) 0.5–20 ppm PEO solutions. Solid line represents the friction factor corresponding to the Fanning friction factor when the flow is laminar for a tube which scales as  $f=16/Re$.

Figure 13. Friction factor chart for 0–50 ppm PAAm solution for a 2.84 mm tube. Solid line represents the friction factor corresponding to the Fanning friction factor when the flow is laminar for a tube which scales as  $f=16/Re$.
Figure 13 shows friction factor for 0–50 ppm of PAAm ( $\text{MW}=5\times 10^{6}$) solution with increasing
  $Re$ for a tube of larger diameter
  $2840~\unicode[STIX]{x03BC}\text{m}$. It is evident from the plot that the extent of drag reduction for the larger diameter tube is lower as compared to the smaller diameter tube. Larger diameter tubes imply a decrease in elasticity number
  $E$, which in turn is responsible for the lesser drag-reducing property of the system. Friction factor results for 0–50 ppm of PAAm (
 $\text{MW}=5\times 10^{6}$) solution for a tube of diameter
  $2840~\unicode[STIX]{x03BC}\text{m}$ for the polymer procured from Polysciences Europe GmbH (Lot no. 709190) are in good agreement with the friction factor results of solution made using polymer procured from Sigma-Aldrich. Hence drag reduction is robust and is independent of the source of procurement. It is important to note that by using the same amount of polymer procured from Polysciences Europe GmbH, Choueiri et al. (Reference Choueiri, Lopez and Hof2018) showed a much higher drag-reducing property at
  $Re=3150$ for a 10 mm tube. This could be due to a difference in mixing protocols used in the two studies. In our case, the polymer is prepared by adding the appropriate amount of polymer in powder form to a glass beaker. Required amount of de-ionized water is added to the beaker. The polymer powder is mixed with the help of a magnetic stirrer at very low speed of 50 rpm for 12 h. On the other hand the mixing in case of Choueiri et al. (Reference Choueiri, Lopez and Hof2018) was carried out for several days at very low rpm. Further the tube diameters in our case are very small compared to Choueiri et al. (Reference Choueiri, Lopez and Hof2018). The driving mechanism of flow is gravity driven for Choueiri et al. (Reference Choueiri, Lopez and Hof2018) and pressure driven in our case. Further, the inlet conditions are difficult to control in our case because of the microsized tubes used in our study.
4.1 Relaminarization at a fixed $Re$

In the following discussion, we explore the possibility of exceeding the MDR asymptote, as first reported by Choueiri et al. (Reference Choueiri, Lopez and Hof2018), for flow of polymer solutions in tubes of much smaller diameters  ${\sim}0.49$ mm. In order to investigate the dependence of drag reduction on the elastic nature of the fluid, we perform experiments to obtain friction factor for a fixed
  $Re=3150$ for different tube diameters i.e. 0.49 mm, 1.24 mm, 2.84 mm with varying concentration of the polymer and by using two different polymers; PAAm (
 $\text{MW}=5\times 10^{6}$) and polyethylene oxide (
 $\text{MW}=8\times 10^{6}$). Figure 14(a) shows the dependence of the friction factor on the concentration of PAAm at
  $Re=3150$ for flow in the 0.49 mm tube. Friction factor decreases with increasing polymer concentration and approaches MDR asymptote at concentrations beyond 30 ppm. Choueiri et al. (Reference Choueiri, Lopez and Hof2018) showed that for
  $Re=3150$, for a tube of diameter 10 mm and for a range of concentrations, the friction factor could go below MDR and reach its laminar value of
  $16/Re$. However, we are not able to observe a similar phenomenon for the same
  $Re=3150$ and our friction factor asymptotes to MDR at higher concentrations without going below the MDR limit (figure 14a). We performed similar experiments for tubes of diameter 1.24 mm and 2.84 mm and with polyethylene oxide (
 $\text{MW}=8\times 10^{6}$). We observed a consistent decrease of friction factor with increase in concentration. Friction factor values tend to approach MDR at sufficiently high concentrations, but the MDR limit was not exceeded in our experiments at
  $Re=3150$.

Figure 14. (a) Friction factor for the flow of PAAm solution through 0.49 mm tube as a function of concentration represented on a friction factor versus  $Re$ chart and (b) friction factor ratio versus concentration plot for
  $Re=3150$. (c) Friction factor ratio versus
  $Wi(1-\unicode[STIX]{x1D6FD})$ plot for
  $Re=2030$ and 2050 from the present experiments, and for the data from the DNS for viscoelastic channel flow by Shekar et al. (Reference Shekar, McMullen, Wang, McKeon and Graham2019) at
  $Re=1500$. (d) Schematic showing a comparison of variation of
  $Re_{t}$ versus concentration for the present study, Samanta et al. (Reference Samanta, Dubief, Holzner, Schäfer, Morozov, Wagner and Hof2013) and Choueiri et al. (Reference Choueiri, Lopez and Hof2018).
However, when experiments were performed at  $Re\sim 2050$ (figure 14b), which is above the
  $Re_{t}\sim 1900$ for Newtonian flow in our experiments, we observe that with increasing polymer concentration, the friction factor value decreases and reaches the laminar value when the polymer concentration reaches
  $20~\text{ppm}$ for the 0.49 mm tube. The flow remains laminar at
  $Re=2030$ for polymer concentrations up to
  $40~\text{ppm}$ and then destabilizes again. An identical phenomenon is observed for flow through the tube of diameter 1.44 mm. Interestingly, our experimental results shown in figure 14(b) are strikingly similar to the results from DNS of viscoelastic channel flows. Shekar et al. (Reference Shekar, McMullen, Wang, McKeon and Graham2019) (in figure 1 of their paper) showed that
  $(f-f_{lam})/f_{lam}$ decreased with increase in
  $Wi$, eventually becoming zero (corresponding to complete relaminarization) for a range of
  $Wi$. Beyond a critical
  $Wi$, the quantity again increases, suggestive of a second instability due to elasto-inertial effects. Indeed, when we replotted (figure 14c) their data in terms of
  $Wi(1-\unicode[STIX]{x1D6FD})$, the range of this dimensionless group where the flow relaminarizes in DNS is very close to our experimental results. The reason for relaminarization at
  $Re\sim 2050$ (not at
  $Re=3150$) in our experiments can be explained as follows. Experimentally, the plot for
  $Re_{t}$ versus polymer concentration is non-monotonic, with an initial increase and an eventual decrease due to elasto-inertial instability, as schematically shown in figure 14(d). The initial decrease is due to the suppression of onset of Newtonian turbulence due to small amounts of added polymer. This is consistent with the computational studies of Graham (Reference Graham2014), which show that the appearance of exact coherent state solutions responsible for Newtonian pipe transition is postponed and eventually suppressed by viscoelastic effects. Thus,
  $Re_{t}$ increases from its Newtonian value as polymer concentration (or, in dimensionless terms,
  $E(1-\unicode[STIX]{x1D6FD})$) is increased initially. Eventually, at higher
  $E(1-\unicode[STIX]{x1D6FD})$,
  $Re_{t}$ decreases below the Newtonian value, a phenomenon referred to as ‘early transition’. If the slope of the variation of
  $Re_{t}$ with
  $E(1-\unicode[STIX]{x1D6FD})$ is gradual and if the maximum of this curve (
 $Re_{max}$) is high enough, then there is a substantial range of
  $E(1-\unicode[STIX]{x1D6FD})$ and
  $Re$ where the flow of the polymer solution is transitional or turbulent. In such a parametric regime, upon increase in polymer concentration, the flow enters the (viscoelastic) laminar regime, or it ‘relaminarizes’. Further increase in polymer concentration initiates the elasto-inertial instability, and the friction factor increases again.
We conjecture that the range of  $E(1-\unicode[STIX]{x1D6FD})$ and the difference between
  $Re_{max}$ and
  $Re_{Newtonian}$ (in figure 14d) is quite large in Choueiri et al. (Reference Choueiri, Lopez and Hof2018), and this allowed their experiments to reach MDR before the flow relaminarizes. In our experiments, the difference
  $Re_{max}-Re_{Newtonian}$ is quite small, and hence we were not able to reach MDR before the flow relaminarizes. However, due to the initial stabilizing effect of the added polymer, there is a range of
  $Re$, where the flow does relaminarize upon addition of polymer. The large variations in the window of
  $Re$ in which there is a transition delay in the experiments of Choueiri et al. (Reference Choueiri, Lopez and Hof2018) and the present work could be attributed to the strongly subcritical nature of the transition at low polymer concentrations, which is sensitive to details of the experimental set-up. This is quite similar to the variation in transition
  $Re$ across experiments even in the classical case of pipe flow of Newtonian fluids, and for dilute polymer solutions in the experiments of Samanta et al. (Reference Samanta, Dubief, Holzner, Schäfer, Morozov, Wagner and Hof2013).

Figure 15. (a) Friction factor for the flow of PAAm solution (procured from Polysciences Europe GmbH, Lot no. 709190) through 2.84 mm tube as a function of concentration (30–80 ppm) represented on a friction factor versus  $Re$ chart and (b) friction factor versus concentration plot.
Figure 15 shows dependence of friction factor at  $Re=3150$ for PAAm (procured from Polysciences Europe GmbH, Lot no. 709190) for a 2.84 mm tube for polymer concentration in range 30–80 ppm. The polymer is identical to the one used in Choueiri et al. (Reference Choueiri, Lopez and Hof2018) wherein the friction factor drops below the maximum drag reduction value in the concentration range
  $30{-}50~\text{ppm}$ for a tube diameter of 10 mm. However we did not realize the same extent of drag reduction in our experiments. Figure 16 shows a comparison of the friction factor values at
  $Re=3150$ with varying concentrations for polymers procured from Polysciences Europe and Sigma-Aldrich. The friction factor data seem to be very similar for polymers obtained from either manufacturer, indicating that the drag reduction data are robust and do not depend on the synthesis protocol. Figure 17 shows a comparison of friction factor values at
  $Re=3150$ and
  $Re=3600$ with varying concentrations of polymer for polymer procured from Polysciences for two different tube diameters i.e. 2.84 mm and 1.44 mm. For none of the tube diameters and none of the polymer concentrations we are able to exceed the MDR limit.

Figure 16. A comparison of friction factor values at  $Re=3150$ with varying concentrations of polymer for polymer procured from two different manufacturers.

Figure 17. A comparison of friction factor values at  $Re=3150$ and
  $Re=3600$ with varying concentrations of polymer for polymer procured from Polysciences for two different tube diameters i.e. 2.84 mm and 1.44 mm.

Figure 18. Velocity profile comparison of pure water turbulence at  $Re=3150$ when compared to a drag-reduced state by the addition of 5–20 ppm PAAm at
  $Re=3150$. Continuous line represents laminar velocity profile for a Newtonian fluid. Here
  $V$ is the local velocity obtained from micro-PIV and
  $V_{avg}$ is the cross-sectional average velocity obtained from the flow rate measurements. Panel (b) shows the asymmetry in velocity profile for the flow of 20ppm PAAm solution at
  $Re=3150$. Symbols in panel (b) represent the reflection about
  $x=0$. Velocity profile for the flow of pure water does not show any asymmetry.
4.2 Micro-PIV and friction factor analysis of drag-reduced state
Figure 18 shows the velocity profile for the flow of pure water and 5–20 ppm PAAm solution through  $490~\unicode[STIX]{x03BC}\text{m}$ tube. Micro-PIV (TSI, Shoreview) technique is used to obtain the velocity profiles. The fluid is seeded with
  $3.2~\unicode[STIX]{x03BC}\text{m}$ polystyrene beads and a laser (ND-YAG, Quantel) is used to illuminate these particles in the flow. A CCD camera is used to capture images of the illuminated particles. The images are further analysed using Insight 4G software and data are extracted using the Tecplot focus software. The velocity profile becomes less flat with increasing polymer concentration. This is an indication that the flow becomes less turbulent with increasing polymer concentration. Further, the velocity profiles for polymer solutions appear to be asymmetric in nature, similar to the velocity profile obtained by Wen et al. (Reference Wen, Poole, Willis and Dennis2017), wherein a break in symmetry of velocity profile for polymer solutions was observed in the post-transition regime. Owolabi et al. (Reference Owolabi, Dennis and Poole2017) obtained velocity profiles in the turbulent regime for 100 mm tubes by systematically increasing the PAAm concentration in water from 150 to 350 ppm. It was observed that the buffer layer became thicker with increasing polymer concentration.
4.3 Drag reduction using dimensionless groups
Purely from a standpoint of dimensional analysis, it seems reasonable to postulate that the friction factor in the flow of a polymer solution should be a function of  $Re$,
$Re$,  $E$ (or,
  $Wi=ERe$) and
  $\unicode[STIX]{x1D6FD}$. When friction factor is expressed as a function of suitable dimensionless groups, it may be possible to obtain a universal relationship for drag reduction which is independent of the tube diameter, polymer concentration, molecular weight and monomer chemistry. Here, it is assumed that only the longest relaxation time of the polymer is relevant to the phenomenon under consideration, and hence
  $E$ is related to the longest relaxation time. For a given polymer molecular weight, increase in polymer concentration increases
  $(1-\unicode[STIX]{x1D6FD})$ and MDR is approached at an earlier
  $Re$. Similarly, for a fixed polymer concentration (or, equivalently,
  $\unicode[STIX]{x1D6FD}$), MDR is reached at an earlier
  $Re$ for polymers with larger molecular weights. Thus, for sufficiently dilute solutions, the combination
  $E(1-\unicode[STIX]{x1D6FD})$ is more relevant in determining the onset of MDR. Also, the limit of a Newtonian solution is reached when either
  $E\rightarrow 0$ or
  $\unicode[STIX]{x1D6FD}\rightarrow 1$. We therefore expect the friction factor to be a function of
  $Re$ and
  $E(1-\unicode[STIX]{x1D6FD})$. As
  $E(1-\unicode[STIX]{x1D6FD})$ increases, the onset
  $Re$ for MDR decreases. It is therefore useful to consider the product
  $ERe(1-\unicode[STIX]{x1D6FD})$, or equivalently
  $Wi(1-\unicode[STIX]{x1D6FD})$ (since
  $Wi=ERe$) as the single relevant dimensionless group that determines the onset of MDR, or indeed the friction factor in the maximum drag reduction asymptote regime in the flow of polymer solutions.
There are two ways to infer the (longest) relaxation time of the polymer solution; one is to use the CaBER relaxation time which measures extensional relaxation time and has a weak dependence on concentration (Samanta et al. Reference Samanta, Dubief, Holzner, Schäfer, Morozov, Wagner and Hof2013; Dinic et al. Reference Dinic, Zhang, Jimenez and Sharma2015) and the second method would be to estimate the Zimm relaxation time in the dilute limit. Relaxation time for PAAm is inferred using the dependence of CaBER relaxation time on PAAm concentration obtained from Samanta et al. (Reference Samanta, Dubief, Holzner, Schäfer, Morozov, Wagner and Hof2013). The Zimm relaxation time is also calculated in the dilute limit for both PAAm and PEO solutions similar to Chandra et al. (Reference Chandra, Shankar and Das2018) by using the radius of gyration of the polymer. The CaBER relaxation time of PEO solution with changing concentration is obtained from Dinic et al. (Reference Dinic, Zhang, Jimenez and Sharma2015).

Figure 19. Comparing friction factor values for a fixed  $Re=3150$ for different tube diameters for PAAm and PEO for different
  $Wi$ (different polymer concentrations) when the relaxation time for all concentrations is taken as the Zimm relaxation time (a) linear plot and (b) semi-log plot.

Figure 20. Comparing friction factor values for a fixed  $Re=3150$ for different tube diameters for PAAm and PEO for different
  $Wi$ (different polymer concentrations) when relaxation time is inferred from CaBER relaxation time data (a) linear plot and (b) semi-log plot.
Figure 19 shows a plot of  $f$ versus
  $Wi(1-\unicode[STIX]{x1D6FD})$ using the Zimm relaxation time to calculate
  $Wi$ at a fixed
  $Re$. Friction factor values for different concentrations, tube diameters and different polymers seem to follow a similar trend. Discrepancy in friction factor values for the same
  $Wi(1-\unicode[STIX]{x1D6FD})$ for different tube diameters and different polymer could be attributed to the slight dependence of relaxation time on polymer concentration. The discrepancy is minimized by using the concentration-dependent CaBER relaxation time (obtained from CaBER data of Samanta et al. (Reference Samanta, Dubief, Holzner, Schäfer, Morozov, Wagner and Hof2013)) for calculating
  $Wi$ (figure 20). There seems to be a universal dependence of the friction factor and hence the extent of drag reduction on the dimensionless parameter
  $Wi(1-\unicode[STIX]{x1D6FD})$. As argued above, the onset of MDR occurs in figure 20(b) system at
  $W(1-\unicode[STIX]{x1D6FD})\sim O(1)$, and this should be a universal constant for pipe flow of dilute solutions of linear flexible polymers.

Figure 21. (a) Variation of per cent drag reduction, as calculated using the difference in pressure drop for polymeric and Newtonian flows for a given flow rate, with  $Wi$ for different
  $Re$, different concentrations and different tube diameters; (b) variation of friction factor with varying
  $Wi$ for different
  $Re$, different concentrations and different tube diameter. Here, CaBER relaxation time is used for the calculation of
  $Wi$, and (c) (semi-log) and (d) (linear) plot of percentage reduction in friction factor in the drag-reduced state as compared to the Newtonian case plotted as a function of
  $Wi(1-\unicode[STIX]{x1D6FD})$.
Figure 21(a) shows the effect of  $Wi$ on percentage drag reduction with varying
  $Wi$ for different
  $Re$, different concentrations and different tube diameters. Here, we follow the earlier work of Owolabi et al. (Reference Owolabi, Dennis and Poole2017) wherein the percentage drag reduction was defined based on the difference in pressure drop between polymeric and Newtonian flows, for a fixed volumetric flow rate. We observe a reasonable data collapse for percentage drag reduction for different
  $Re$, polymer concentrations and different tube diameters. Figure 21(b) illustrates data collapse of the friction factor with varying
  $Wi$ for different
  $Re$, concentrations and tube diameters. Data collapse of the friction factor for all
  $Re$ further corroborates the generic nature of the drag reduction phenomenon. In figure 21(c), we propose a different method for characterizing drag reduction based on the percentage reduction in the friction factor between polymeric and Newtonian flows. This quantity is plotted as a function of
  $Wi(1-\unicode[STIX]{x1D6FD})$ for different solutions and tube diameters, and there is a reasonable collapse. Further, the percentage reduction in friction factor approaches its MDR value at
  $Wi(1-\unicode[STIX]{x1D6FD})\sim 0.87$.
Earlier studies on drag reduction White & Mungal (Reference White and Mungal2008) have proposed a ‘time criterion’ for drag reduction wherein the onset of drag reduction happens when  $Wi_{\unicode[STIX]{x1D70F}}\sim O(1)$, where
  $Wi_{\unicode[STIX]{x1D70F}}=\unicode[STIX]{x1D706}V_{\unicode[STIX]{x1D70F}}/R$, where
  $V_{\unicode[STIX]{x1D70F}}=\sqrt{\unicode[STIX]{x1D70F}_{w}/\unicode[STIX]{x1D70C}}$ is the wall friction velocity in turbulent flows. However, as pointed out by White & Mungal (Reference White and Mungal2008), this criterion does not account for concentration dependence of the onset of drag reduction. In this work, we propose to incorporate the concentration dependence via the factor
  $(1-\unicode[STIX]{x1D6FD})$, which is really a measure of polymer concentration in the solution, by using the dimensionless combination
  $Wi(1-\unicode[STIX]{x1D6FD})$. We used experimental data from the present work, Samanta et al. (Reference Samanta, Dubief, Holzner, Schäfer, Morozov, Wagner and Hof2013) for tubes, Owolabi et al. (Reference Owolabi, Dennis and Poole2017) for channels and tubes and DNS data for viscoelastic channel flows from Xi & Graham (Reference Xi and Graham2010), and computed the value of
  $Wi(1-\unicode[STIX]{x1D6FD})$ at which there is an onset of MDR as shown in table 3. Remarkably, the onset of MDR appears to occur when
  $Wi(1-\unicode[STIX]{x1D6FD})\sim$
 $O(1)$ constant in all these studies. It should be emphasized that shear thinning of the polymer solutions is not being accounted for while estimating
  $Wi$, and it may play some role in the estimation of the actual relaxation time. Nevertheless, the data for onset of MDR do seem to follow a reasonably good collapse when expressed in terms of
  $Wi(1-\unicode[STIX]{x1D6FD})$. In the literature White & Mungal (Reference White and Mungal2008), the dimensionless parameter
  $Wi_{\unicode[STIX]{x1D70F}}$, which is based on the friction velocity, is said to be an
  $O(1)$ constant for the onset of drag reduction. However, it was also pointed out by White & Mungal (Reference White and Mungal2008) that this does not account for concentration variations. We calculated
  $Wi_{\unicode[STIX]{x1D70F}}(1-\unicode[STIX]{x1D6FD})$ for the onset of MDR from the present work, and from the experiments of Samanta et al. (Reference Samanta, Dubief, Holzner, Schäfer, Morozov, Wagner and Hof2013) and Owolabi et al. (Reference Owolabi, Dennis and Poole2017), shown in table 3. This shows that
  $Wi_{\unicode[STIX]{x1D70F}}(1-\unicode[STIX]{x1D6FD})\sim 20$ for the onset of MDR, which again shows the potential of using such dimensionless groups to quantify drag reduction. Further, the DNS results of Housiadas & Beris (Reference Housiadas and Beris2013) show that the onset of MDR occurs at
  $Wi_{\unicode[STIX]{x1D70F}}\sim 140$ when
  $\unicode[STIX]{x1D6FD}=0.9$, hence
  $Wi_{\unicode[STIX]{x1D70F}}(1-\unicode[STIX]{x1D6FD})\sim 14$. This is in close agreement to our experimental results where the onset of MDR is characterized by
  $Wi_{\unicode[STIX]{x1D70F}}(1-\unicode[STIX]{x1D6FD})\sim 20.9$, despite the channel geometry used in the DNS study.
Table 3. Table showing the value of  $Wi(1-\unicode[STIX]{x1D6FD})$ and
  $Wi_{\unicode[STIX]{x1D70F}}(1-\unicode[STIX]{x1D6FD})$ required for the onset of MDR in the experimental studies of Samanta et al. (Reference Samanta, Dubief, Holzner, Schäfer, Morozov, Wagner and Hof2013) (tubes), Owolabi et al. (Reference Owolabi, Dennis and Poole2017) (tubes and channels) and the present work (tubes). The work of Xi & Graham (Reference Xi and Graham2010) and Housiadas & Beris (Reference Housiadas and Beris2013) are DNS studies of viscoelastic channel flows.

5 Discussion
5.1 Early transition
In this section, we provide a comparative analysis of the results of the present work with those available in the literature. The onset of elasto-inertial transition was investigated with respect to the dimensionless group  $E(1-\unicode[STIX]{x1D6FD})$ in Chandra et al. (Reference Chandra, Shankar and Das2018) for the flow of PAAm and PEO solutions through micro-sized tubes. However, the onset was observed at much lower values of
  $E(1-\unicode[STIX]{x1D6FD})$ for Samanta et al. (Reference Samanta, Dubief, Holzner, Schäfer, Morozov, Wagner and Hof2013) as compared to Chandra et al. (Reference Chandra, Shankar and Das2018). In this discussion, we attempt to reconcile this discrepancy between the two experimental observations. Figure 22 shows a comparison of
  $Re_{t}$ versus
  $E(1-\unicode[STIX]{x1D6FD})$ as obtained in the present study using friction factor measurements, as well as the results of Samanta et al. (Reference Samanta, Dubief, Holzner, Schäfer, Morozov, Wagner and Hof2013) and Chandra et al. (Reference Chandra, Shankar and Das2018). Further, the data for different tube diameters do not collapse for the same
  $E(1-\unicode[STIX]{x1D6FD})$, both within the experiments carried out in the present work as well as those of Samanta et al. (Reference Samanta, Dubief, Holzner, Schäfer, Morozov, Wagner and Hof2013). As we argue below, this is because of the neglect shear thinning while estimating
  $Re$ and
  $E$ in this figure. The
  $Re_{t}$ data of the present study scale with
  $E(1-\unicode[STIX]{x1D6FD})$ as
  $Re\sim (E(1-\unicode[STIX]{x1D6FD}))^{-2/5}$, when the transition is detected using the friction factor data. The observed scaling is very close to the earlier study of Chandra et al. (Reference Chandra, Shankar and Das2018), and the
  $Re_{t}$ obtained from friction factor data agrees well with the micro-PIV results of Chandra et al. (Reference Chandra, Shankar and Das2018). However the dimensionless group
  $E(1-\unicode[STIX]{x1D6FD})$ corresponding to the observed
  $Re_{t}$ for Samanta et al. (Reference Samanta, Dubief, Holzner, Schäfer, Morozov, Wagner and Hof2013) appears to be very different when compared to Chandra et al. (Reference Chandra, Shankar and Das2018) and the current friction factor data.

Figure 22. A comparison of results obtained from micro-PIV from Chandra et al. (Reference Chandra, Shankar and Das2018), friction factor data from the present study and normalized pressure fluctuation data from Samanta et al. (Reference Samanta, Dubief, Holzner, Schäfer, Morozov, Wagner and Hof2013). The lack of data collapse for different tube diameters suggests that shear thinning is important for the smaller tube diameters used.
Samanta et al. (Reference Samanta, Dubief, Holzner, Schäfer, Morozov, Wagner and Hof2013) observed transition at  $Re\sim 800$ for a 500 ppm PAAm solution using a 4 mm tube. It is important to note that we probe higher elasticity numbers by using microtubes with diameter
  ${\sim}0.49~\text{mm}$. Despite probing higher elasticity numbers, we do not obtain a transition
  $Re$ as low as 800 for the 500 ppm PAAm solution. This discrepancy could be due to multiple factors. One reason could be the difference in the methodology for detecting transition. While Samanta et al. (Reference Samanta, Dubief, Holzner, Schäfer, Morozov, Wagner and Hof2013) used a jump in normalized pressure fluctuations for detecting transition, velocity fluctuations and dye-stream visualization were used in Chandra et al. (Reference Chandra, Shankar and Das2018) and friction factor data are used in the current work. Further, the friction factor plot in Samanta et al. (Reference Samanta, Dubief, Holzner, Schäfer, Morozov, Wagner and Hof2013) does not show any signature of transition below
  $Re=2000$ because they use the Newtonian friction factor line for detecting the onset. Since Samanta et al. (Reference Samanta, Dubief, Holzner, Schäfer, Morozov, Wagner and Hof2013) use larger diameter tubes, shear thinning may be expected to be less important. However, upon closer examination of their experimental data at lower
  $Re$ (figure 2d of their paper), it is clear that the experimental data are consistently lower than the
  $16/Re$ line, thus indicating that shear thinning is not negligible. Consequently, when we correct the friction factor values by using the numerical Carreau model fitting, the transition appears to occur at
  $Re\sim 1200$. High shear rates of
  $O(10^{4})~\text{s}^{-1}$ could be prevalent in the smaller diameter tubes (
 ${\sim}0.5~\text{mm}$) in the present study, which causes significant shear thinning. Hence, the shear viscosity and relaxation time are likely to be lower compared to their zero-shear values during the flow experiments. However, it is not possible to obtain properties of polymer solutions at such high shear rates (
 ${\sim}10^{5}~\text{s}^{-1}$) using our current rheometers. Thus, the data in the figure 22 are likely to overestimate the elasticity numbers for smaller tubes. It is interesting to note that the transition
  $Re$ obtained from friction factor data for the 500 ppm PAAm through 2.84 mm tube shows a transition at
  $Re\sim 1600$ and for flow of the 400 ppm PAAm solution through 2.84 mm tube shows a transition at
  $Re\sim 1800$. A similar phenomenon is observed for the flow of 100–300 ppm PEO solution through a 2.84 mm tube. The effect of shear thinning is much lower for a 2.84 mm and 1.44 mm tube as compared to the 0.49 mm tube. It was noted by Poole (Reference Poole2016) that, for shear-thinning fluids, the relaxation time could decrease considerably with shear rate. If we account for the decrease in relaxation time and viscosity, the actual elasticity numbers will be lower than the elasticity number obtained using zero-shear viscosity and zero-shear relaxation time. The systematic shift of the data, when plotted as
  $Re$ versus
  $E(1-\unicode[STIX]{x1D6FD})$, towards lower values of
  $E(1-\unicode[STIX]{x1D6FD})$ for larger diameter tubes lends support to this hypothesis. Further, the two diameters used in the earlier work of Chandra et al. (Reference Chandra, Shankar and Das2018) were
  $0.39$ and 0.47 mm, and the difference in diameters is perhaps not sufficient enough to discern the shift towards lower
  $E(1-\unicode[STIX]{x1D6FD})$ discussed above. Thus, it appears that in the smallest tubes used in this study and Chandra et al. (Reference Chandra, Shankar and Das2018), while the nominal elasticity numbers (based on viscosity and relaxation times in the zero-shear limit) are quite high, the actual prevailing elasticity numbers could be smaller due to shear thinning.
In general, for very low values of  $E(1-\unicode[STIX]{x1D6FD})$ (i.e. very dilute solutions), there is an initial increase in
  $Re_{t}$ compared to the Newtonian value. The transition in the Newtonian limit and in the case of polymer solutions at very low
  $E(1-\unicode[STIX]{x1D6FD})$ occurs due to finite amplitude disturbances, while for sufficiently large
  $E(1-\unicode[STIX]{x1D6FD})>0.01$, the
  $Re_{t}$ is much lower than 2000. In this regime, the earlier study of Samanta et al. (Reference Samanta, Dubief, Holzner, Schäfer, Morozov, Wagner and Hof2013) has shown that the transition is independent of the amplitude of the perturbations, and hence could be triggered even by infinitesimal perturbations. This scenario is in agreement with the linear stability analysis of Garg et al. (Reference Garg, Chaudhary, Khalid, Shankar and Subramanian2018), which also showed the flow to be unstable to infinitesimal disturbances. When the instability is due to finite amplitude disturbances, the nature of bifurcation is subcritical, while the bifurcation can be supercritical if the flow is unstable to infinitesimal disturbances. Thus, our experimental observations are suggestive of a possible crossover from subcritical transition for very dilute solutions to a supercritical transition for
  $E(1-\unicode[STIX]{x1D6FD})>0.01$. The normalized deviation in the friction factor in the post-transition regime also seems to vary as
  $(Re/Re_{t}-1)^{1/2}$, which is a suggestive signature of the supercritical (Drazin & Reid Reference Drazin and Reid1981) nature of the post-transition state for
  $E(1-\unicode[STIX]{x1D6FD})>0.01$.
5.2 Drag reduction
The friction factor data for dilute PAAm and PEO solutions show a direct approach to drag reduction at higher concentrations  ${\sim}200~\text{ppm}$. Drag reduction is higher for smaller diameter tubes as compared to larger diameter tubes. This could be attributed to the higher elasticity number prevalent in flow through smaller diameter tubes. Owolabi et al. (Reference Owolabi, Dennis and Poole2017) performed experiments to investigate drag reduction in flow through ducts and tubes using semi-dilute polymers (
 ${\sim}300~\text{ppm}$) of different molecular weights, using CaBER relaxation time to characterize viscoelasticity. A universal relationship was developed between drag reduction and fluid elasticity. A plot of
  $Wi$ and percentage drag reduction shows a remarkable data collapse for a wide range of
  $Wi$. However, the elasticity numbers in their experiments were much lower as compared to our experiments, owing to the much larger diameters (
 ${\sim}100~\text{mm}$) used in their study. In the present work, with the use of different polymers and different tube diameters, we also obtained drag reduction in a varied range of parameters. The data from the present study as well as previous experiments (Samanta et al. Reference Samanta, Dubief, Holzner, Schäfer, Morozov, Wagner and Hof2013; Owolabi et al. Reference Owolabi, Dennis and Poole2017) and DNS (Xi & Graham Reference Xi and Graham2010; Housiadas & Beris Reference Housiadas and Beris2013) seem to strongly suggest that the onset of MDR happens when
  $Wi(1-\unicode[STIX]{x1D6FD})\sim 1$. There is some variability in the numerical value of the constant, perhaps due to shear thinning, but it is remarkable to observe this collapse of data from different studies (both experimental and computational) carried out at varying polymer concentrations and tube diameters.
5.3 Relaminarization at a fixed $Re$

Choueiri et al. (Reference Choueiri, Lopez and Hof2018) observed that for a 10 mm diameter tube, at  $Re=3150$, when the concentration of PAAm (
 $MW=5\times 10^{6}$) is increased to 20 ppm, the friction factor dropped below the MDR value and approached the laminar value of
  $16/Re$. The friction factor remains at this laminar value up to a concentration of 40 ppm. The friction factor again increases to the MDR value as the concentration is increased to
  $50~\text{ppm}$ at
  $Re=3150$. The friction factor values dropped below MDR for PEO (
 $MW=8\times 10^{6}$) in concentration range of
  $2{-}6~\text{ppm}$ at
  $Re=3150$. In our experiments, for
  $Re=3150$ and
  $Re=3600$, we find that the friction factor saturates at the MDR limit, and does not exceed this limit. However, for
  $Re\sim 2050$, we do observe that the friction factor value reaches the laminar level from the transitional values as the concentration of the polymer is increased beyond a certain level. This shows that the window of
  $Re$ for which relaminarization of flow is seen is rather narrow in our experiments. Because the initial instability of the flow (under very dilute polymer concentrations) is due to finite-amplitude disturbances (i.e. subcritical), the window of
  $Re$ is expected to be very sensitive to experimental conditions. In the experiments of Choueiri et al. (Reference Choueiri, Lopez and Hof2018), the window was sufficiently large enough to probe the MDR regime before relaminarization. In our experimental set-up, the window of
  $Re$ is not sufficiently large to reach MDR, but nevertheless, relaminarization occurs from a transitional flow upon increase in polymer concentration, and the friction factor increases once again, suggestive of an elasto-inertial instability. This trend is qualitatively similar to the observations of Choueiri et al. (Reference Choueiri, Lopez and Hof2018).
6 Conclusions
A comprehensive experimental study is carried out to understand early transition and drag reduction in the flow of polymer solutions through microtubes using pressure drop/friction factor measurements. We show that the onset of transition detected by locating the  $Re$ at which the experimental data for friction factor deviate from the expected laminar values is broadly consistent with earlier results which used velocity fluctuations inferred from micro-PIV measurements (Chandra et al. Reference Chandra, Shankar and Das2018). For smaller concentrations of the added polymer (up to
  ${\sim}100~\text{ppm}$), there is a slight delay in
  $Re_{t}$ compared to the Newtonian value of 1900 in our experiments. For concentrations greater than 300 ppm, an early transition is observed at
  $Re_{t}<1900$, consistent with the earlier results of Samanta et al. (Reference Samanta, Dubief, Holzner, Schäfer, Morozov, Wagner and Hof2013) and Chandra et al. (Reference Chandra, Shankar and Das2018). We also illustrated the importance of accounting for shear-thinning effects while locating the deviation of experimental friction factor data from the laminar value, and showed that the use of the Newtonian laminar result leads to gross overestimation of
  $Re_{t}$. The use of tubes of smaller diameters (
 ${\sim}500~\unicode[STIX]{x03BC}\text{m}$) implies that the nominal shear rates are quite large. Because fluid properties such as viscosity and relaxation time decrease with increasing shear rates, the actual elasticity numbers prevalent in the experiments with smaller tube diameters could be smaller compared to those estimated using the zero-shear data. By carrying out experiments in tubes of varying diameters, we show that when
  $Re_{t}$ is plotted with the dimensionless group
  $E(1-\unicode[STIX]{x1D6FD})$, the data do not collapse, thus underscoring the importance of using the shear-rate-dependent viscosity and relaxation times while calculating the elasticity number. This suggests that accurate experimental determination of shear-rate dependence of rheological properties is essential in order to render experimental data in suitable dimensionless groups, and to achieve a data collapse across different systems. With the current experimental facility, it was not possible to measure shear-rate dependence at high shear rates. However, as the tube diameter is increased, the
  $Re_{t}$ versus
  $E(1-\unicode[STIX]{x1D6FD})$ curves gradually shift towards the data of Samanta et al. (Reference Samanta, Dubief, Holzner, Schäfer, Morozov, Wagner and Hof2013). Thus, our study shows that while it might be expected that regimes of higher elasticity numbers may be reached by reducing the tube diameter, the concomitant importance of shear thinning implies that the actual elasticity numbers could be smaller than those estimated using zero-shear data.
For smaller concentrations of the added polymer (or equivalently, small  $E(1-\unicode[STIX]{x1D6FD})$),
  $Re_{t}$ increases compared to its Newtonian value (1900 in our experiments). Thus, for
  $Re\sim 2050$, the flow is in the transitional regime for Newtonian fluids. Upon addition of polymer, we show that the friction factor decreases, and the flow (of the dilute polymer solution) re-enters the laminar regime, with the friction factor approaching
  $16/Re$. In other words, the flow relaminarizes upon increase in polymer concentration at fixed
  $Re$. With further increase in polymer concentration, the friction factor increases again, indicative of an instability. We conjecture that this instability of a (not-so-dilute) polymer solution is the elasto-inertial instability, and this observation is broadly consistent with the recent work of Choueiri et al. (Reference Choueiri, Lopez and Hof2018). However, when we carried this out at a higher
  $Re\sim 3150$, relaminarization was not observed. Thus, we propose that there is a range of
  $Re$ between the Newtonian transition value and an upper bound, where the flow will relaminarize upon addition of polymer. For
  $Re$ beyond the upper bound, the flow would approach MDR, with no further reduction in friction factor, and relaminarization is not possible. This has been the conventional picture in the field of drag reduction (White & Mungal Reference White and Mungal2008). This, however, does not hold in the window of
  $Re$ where the transition in the flow of a polymer solution is delayed compared to Newtonian flows. If the ‘window’ of
  $Re$ between the Newtonian transition and the upper bound is large enough, then it is possible to exceed the MDR asymptote, as shown by Choueiri et al. (Reference Choueiri, Lopez and Hof2018). This
  $Re$-window can be expected to be very sensitive to experimental conditions, since the subcritical transition at lower polymer concentrations is driven by finite-amplitude disturbances. In our experiments, the window was not large enough to reach MDR before relaminarization upon polymer addition. However, we observe relaminarization of transitional flow upon increase in polymer concentration, and our results are in good agreement with the DNS results of Shekar et al. (Reference Shekar, McMullen, Wang, McKeon and Graham2019) obtained for viscoelastic channel flows.
We also carried out systematic experiments to characterize drag reduction in the flow of polymer solutions through microtubes. Further, we demonstrate that when the friction factor is plotted with  $Wi(1-\unicode[STIX]{x1D6FD})$ for different tube diameters, polymer concentrations, molecular weights and monomer chemistry (PAAm and PEO), the data show a reasonably good collapse across different systems. This suggests that it is possible to condense friction factor data in a universal manner when plotted as a function of
  $Wi(1-\unicode[STIX]{x1D6FD})$. The factor
  $(1-\unicode[STIX]{x1D6FD})$ accounts for polymer concentration, an important parameter that was often neglected in the drag reduction literature. The extent of drag reduction, when plotted against
  $Wi(1-\unicode[STIX]{x1D6FD})$, is invariant of the type of polymer used, its molecular weight, its concentration and the tube diameter. The collapse of the data is better when the relaxation time is taken from capillary break-up (CaBER) experiments. Further, the onset of MDR from different studies seems to follow the criterion
  $Wi(1-\unicode[STIX]{x1D6FD})\sim O(1)$ constant. Our study thus demonstrates that it is possible to represent drag reduction data obtained for varying polymer concentrations, molecular weights and tube diameters using a single dimensionless group, at least for high molecular weight linear polymers. We hope the present study will motivate future experiments to quantitatively characterize drag reduction using polymer solutions (with accurately characterized rheology) of varying concentrations, tube diameters, molecular weights etc., to substantiate this prediction.
Acknowledgements
The authors thank the Department of Science and Technology, Government of India (grant EMR/2016/001218), for financial support. The authors thank Professor G. Subramanian, Mr P. Joshi, Mr S.K. Rout, Mr R. Patne and Mr A. Ratnam for providing insights and useful suggestions while conducting the experiments.
Declaration of interests
The authors report no conflict of interest.
Appendix A. The $f$–$Re$ relation for laminar flow of Carreau fluid in a tube


Figure 23. Friction factor,  $f_{Carreau}$, obtained using the Carreau model approaching the Newtonian friction factor value at low
  $Re$ and showing a deviation at higher
  $Re$, where
  $Re$ is calculated using the zero-shear viscosity of the polymer solution. The green dotted line represents the laminar Newtonian (
 $f_{Newtonian}$) result based on polymer solution viscosity, while the red dotted line represents the Newtonian friction factor (
 $f_{water}$) calculated using the solvent viscosity (i.e. pure water). The solid line represents the friction factor result from the Carreau model with the following parameters: (i) zero-shear viscosity,
  $\unicode[STIX]{x1D702}_{0}=0.002~\text{Pa}~\text{s}$, obtained from rheological measurements, (ii) power law index,
  $n=0.8$ which is obtained by fitting the Carreau model prediction with experimental data at lower
  $Re$, (iii) the elasticity number is calculated as
  $E=(\unicode[STIX]{x1D706}_{0}\unicode[STIX]{x1D702}_{0})/\unicode[STIX]{x1D70C}D^{2}=0.017$ and (iv)
  $\unicode[STIX]{x1D6FD}=0.45$ is the ratio of solvent to solution viscosity. To aid comparison, we also show the corresponding variation of
  $\unicode[STIX]{x1D702}/\unicode[STIX]{x1D702}_{\infty }$ with
  $Re$ at a fixed
  $E$, which explains the approach to the two asymptotic limits at low and high
  $Re$.
$Re$.
We consider the pressure-driven flow of a shear-thinning Carreau fluid through a rigid tube of diameter  $D$. The equations governing the flow and Carreau constitutive model, in dimensional form, are given by:
 $$\begin{eqnarray}\displaystyle & \displaystyle \unicode[STIX]{x1D735}\boldsymbol{\cdot }v=0, & \displaystyle\end{eqnarray}$$
 $$\begin{eqnarray}\displaystyle & \displaystyle -\unicode[STIX]{x1D735}P+\unicode[STIX]{x1D735}\boldsymbol{\cdot }\unicode[STIX]{x1D70F}=0, & \displaystyle\end{eqnarray}$$
 $$\begin{eqnarray}\displaystyle & \displaystyle \unicode[STIX]{x1D702}=\frac{(\unicode[STIX]{x1D702}_{0}-\unicode[STIX]{x1D702}_{\infty })}{[1+(\unicode[STIX]{x1D706}\unicode[STIX]{x1D6FE})^{2}]^{(1-n)/2}}+\unicode[STIX]{x1D702}_{\infty }, & \displaystyle\end{eqnarray}$$
 where  $P$ is pressure field,
  $\unicode[STIX]{x1D70F}$ is deviatoric stress tensor,
  $\unicode[STIX]{x1D702}_{0}$ is the zero-shear-rate viscosity,
  $\unicode[STIX]{x1D702}_{\infty }$ is the viscosity at infinite-shear rate, which, in the present work, is taken as the viscosity of pure water,
  $\unicode[STIX]{x1D706}$ is the time scale associated with the onset of shear thinning and
  $n$ is flow behavioural index. The zero-shear viscosity is taken from our rheological experimental data, while
  $\unicode[STIX]{x1D706}$ is taken from our earlier work (Chandra et al. Reference Chandra, Shankar and Das2018). The above equations are non-dimensionalized using the following scheme:
  $\unicode[STIX]{x1D702}_{0}$ for viscosity,
  $2V/D$ for strain rate,
  $D$ for length and displacement,
  $f\unicode[STIX]{x1D70C}V/2D$ for pressure drop. The resulting non-dimensional governing equation after substituting the viscosity model in the momentum equation is given by:
 $$\begin{eqnarray}[1+(2ERe\unicode[STIX]{x1D6E4}^{\ast })^{2}]^{(n-1)/2}\unicode[STIX]{x1D6E4}^{\ast }=-r^{\ast }fRe/16,\end{eqnarray}$$
 where  $E$ is the elasticity number,
  $\unicode[STIX]{x1D6E4}^{\ast }$ is the non-dimensional strain rate,
  $f$ is the friction factor,
  $n$ is the power law index and
  $Re$ is the Reynolds number. Experimental values of friction factor at sufficiently low
  $Re$ were used to fit the constant
  $n$ in the Carreau model, which is usually used to model shear thinning fluids. It is interesting to note that though the concentrations used are not very high, the shear rates encountered in the experiments are large enough to alter the friction factor values. Figure 23 shows the results from the Carreau model along with two different Newtonian friction factor predictions. At very low shear rates (i.e. low
  $Re$) the relevant viscosity is the zero-shear viscosity of the polymer solution, and the Carreau model fit approaches
  $f_{polymer}=16/Re$ where
  $Re$ is calculated based on the polymer solution viscosity. At intermediate
  $Re$ (or shear rates), shear thinning becomes important and the friction factor deviates from the Newtonian result based on zero-shear viscosity of the polymer solution. At very high shear rates, the viscosity should approach the ‘infinite-shear’ value
  $\unicode[STIX]{x1D702}_{\infty }$, which is that of the pure solvent (water, in our experiments). Thus, the friction factor should again approach the Newtonian result at very high shear rates (or,
  $Re$), but now calculated using the solvent viscosity. In figure 23, we also plot the variation of
  $\unicode[STIX]{x1D702}/\unicode[STIX]{x1D702}_{\infty }$ as a function of
  $Re$ (for a fixed elasticity
  $E$, this is equivalent to the Weissenberg number), to show how the zero-shear and infinite-shear limits of viscosity ratio is consistent with the asymptotic behaviour of the friction factor in these limits. In order to determine the model constants, the exponent
  $n$ is adjusted so as to fit the laminar friction factor values at low shear rates obtained from experiments for flow of polymer solutions. This figure shows that at intermediate values of
  $Re\sim 100{-}1000$, there is substantial difference between the (Newtonian) friction factor based on zero-shear viscosity and the friction factor obtained from the Carreau model. This difference plays a crucial role in detecting the onset
  $Re$ for transition in the flow of polymer solutions.


