


EARLY LSC DEVELOPMENT
The first method of radiocarbon (14C) measurement, used by Libby and his co-workers, involved counting β- particles using modified Geiger counters termed screen wall counters. The next development in counting technology was the conversion of sample carbon to CO2 gas for measurement in gas proportional counters (GPC). In the early 1950s, the first attempts were made to detect 14C by the liquid scintillation counting (LSC) method. In the 1940s, Broser and Kallman (Reference Broser and Kallmann1947) discovered that certain solid and liquid organic compounds fluoresced when exposed to ionizing radiation. The basic principle of LSC is the absorption of radiation energy by these scintillators, followed by re-emission of the energy as light pulses. The interaction of radiation with certain inorganic crystals and organic molecules with suitable energy levels causes promotion of electrons to excited levels. Subsequent de-excitation results in the emission of light. In this process, known as scintillation, the quantity of light emitted is proportional to the radiation energy. Modern scintillation detector systems use photomultiplier tubes (PMTs) to convert the light pulse into a charge pulse. A photomultiplier is under vacuum and comprises a photocathode which releases photoelectrons when light impinges on it, and a series of dynodes (modified anodes) all held at slightly increasing potentials. The sequence of events occurring in a PMT is:
-
1. Photons of light impinge on the photocathode of the PMT, causing photoelectrons to be released which accelerate to the first dynode.
-
2. At the dynode, a multiplication of the number of electrons occurs.
-
3. Because each dynode is at a different potential, the electrons accelerate to the next dynode with further multiplication and so on.
-
4. There are normally around 10 dynodes and at the final one, there is an avalanche of electrons which constitutes the electrical pulse that is proportional to the radiation energy.
-
5. The pulses are amplified and transmitted to a detection system comprising (i) an analogue to digital converter (ADC), which as the name suggests, converts the analogue pulse to a digital signal, and (ii) a multi-channel analyzer (MCA) which comprises up to several thousand channels, each representing a small incremental energy increase. This records the pulses according to size (energy). Modern MCAs are software-controlled to provide complete flexibility in data acquisition.
Until the introduction of genuine low level liquid scintillation counting systems in the 1980s, the majority of the methods designed to improve counter performance were geared towards background reduction methods and were undertaken by the user. These comprised of modifications to existing instruments and included (i) the use of alternative materials for vial construction, (ii) increasing the mass of passive shielding, (iii) reducing the voltage applied to the PMTs, (iv) chilling the counting chamber, (v) masking the vials above the level of the cocktail to reduce cross-talk, and (vi) masking the PMTs to reduce cross-talk.
THE LSC METHOD OF RADIOCARBON ANALYSIS
Discussion on the LSC method can be broken down into a number of topics: counting liquid, counting vials, and the LSC method, including counting instrumentation and potential problems associated with measurement of β- decays by LSC.
Counting Liquid
The medium in which the process is studied is a liquid—the scintillation cocktail. As a minimum, this comprises an aromatic solvent (benzene, toluene, di-isopropylnaphthalene (DIN), tri-methyl-benzene) and an aromatic scintillating solute or fluor (typically butyl-PBD or PPO) and the sample, in a suitable form. If the sample is aqueous, surfactants will be a key component of the cocktail as formation of a stable emulsion is required. In radiocarbon dating, no surfactants are required because the aromatic solvent is also the sample, as in the majority of LSC facilities, benzene (C6H6) is synthesized from the sample carbon. The solvent can also be a mixture of benzene and toluene (C6H6CH3) if the fluor is first dissolved in toluene (scintillation grade—containing no 14C). Benzene has been chosen because of its excellent light transmission properties, the high chemical conversion yield of sample C to benzene and the high percentage of carbon in the molecule (92%). The sample is first converted to CO2, then reacted with molten lithium to form lithium carbide (Li2C2), before being catalytically trimerized to benzene. Benzene synthesis procedures vary considerably in different laboratories. The details outlined below describe the procedures used in the Waikato University LSC laboratory to give the reader some idea of how the chemical conversions may be carried out.
The carbon is first oxidized to CO2, either by acid hydrolysis (for carbonates), or combustion in an oxygen stream or combustion bomb (for organic materials). The combustion gases are passed over heated CuO to complete the oxidation of CO, NO, N2O and NO2 and also of tar substances. The CO2 is then purified using a chain of wet chemical reagents; for example, AgNO3 and Hg(NO3)2 to precipitate halogens, and the oxidizing agents KI/I2 and K2Cr2O7 to remove nitrogen and sulphur compounds. Silica gel and dry ice traps (–80ºC) remove any water remaining in the gas. The purified CO2 is then reacted with molten lithium in a stainless steel or inconel reaction vessel in vacuo:
 $$2{\rm{C}}{{\rm{O}}_2}+ 10{\rm{Li}} = \gt {\rm{L}}{{\rm{i}}_2}{{\rm{C}}_2} + 4{\rm{L}}{{\rm{i}}_2}{\rm{O}}$$
This reaction was first described by Barker (Reference Barker1953), who developed the reaction using lithium instead of barium, and later improved by Polach and Stipp (Reference Polach and Stipp1967). The CO2 is bled slowly onto the molten Li where it is converted to Li2C2. The carbide is heated to ∼800ºC (furnace temperature) and placed under active vacuum for 30 mins to remove any unreacted gases and complete the carbide synthesis (Gupta and Polach Reference Gupta and Polach1985). The lithium carbide is cooled and then hydrolyzed to acetylene gas (C2H2):
 $${\rm{L}}{{\rm{i}}_2}{{\rm{C}}_2}+ 2{{\rm{H}}_2}{\rm{O}} = \gt {{\rm{C}}_2}{{\rm{H}}_2}+ 2{\rm{LiOH}}$$
The acetylene is purified by passing it through a phosphoric acid trap to remove ammonia compounds, and again, dry ice traps to remove water vapor. Finally, the acetylene is trimerized to benzene using a suitable catalyst. There are a variety of vanadium and chromium activated catalysts available, including a silica-alumina vanadium activated catalyst developed by Professor J. Noakes (Center for Applied Isotope Studies, University of Georgia, USA), a vanadium-alumina-silica catalyst produced at the Institute of Geography, University of St Petersburg by Dr. Kh. A. Arslanov and another at the British Museum by Dr. J. Ambers.
 $$3{{\rm{C}}_2}{{\rm{H}}_2} = \gt {{\rm{C}}_6}{{\rm{H}}_6}$$
Benzene is then driven off the catalyst at ∼100ºC and collected under vacuum at ∼–65ºC. The benzene is then stored in a vial under refrigeration to await counting.
This sequence of reactions requires a high degree of operator skill because of the complexity of the equipment and the nature of the reactions. It is important that a standardized routine is followed carefully and consistently, so that yields remain high and there is little cross-contamination between samples.
Counting Vials
The synthesized benzene is transferred into counting vials of a variety of types. The counting vials contain the sample solvent and the scintillator. Commercially available LS vials used for benzene counting are commonly composed of either Teflon, quartz or low-potassium borosilicate glass (e.g., Haas Reference Haas, Berger and Suess1979; Polach et al. Reference Polach, Gower, Kojola and Heinonen1983; Devine and Haas Reference Devine and Haas1987; Noakes and Valenta Reference Noakes and Valenta1989; Hogg and Noakes Reference Hogg and Noakes1992; Hogg Reference Hogg, Noakes, Polach and Schonhofer1993). Polyethylene and polypropylene vials are very useful for some aromatic solvents, but their permeability makes them unsuitable for repeatable long-term benzene use. In a comparison of different vial types, Hogg et al. (Reference Hogg, Polach, Robertson, Noakes, Ross, Noakes and Spaulding1989) concluded that, for spectrometers using true anticoincidence detection and extensive passive shielding (as in the Perkin Elmer 1220 Quantulus), Teflon or synthetic silica vials produced the highest performance in terms of 14C detection efficiency and background. The authors also noted that synthetic silica had superior physical properties to Teflon. The silica vials vary in size according to the weight of the sample benzene being counted and include 0.3 mL and 1 mL minivials, 3 mL standard vials and 12 mL vials that are suitable for high precision applications. Low-K borosilicate glass vials are supplied in either 7 mL or 20 mL sizes.
The most commonly used scintillator in 14C dating is PPO (primary fluor) + POPOP (secondary fluor and wavelength shifter), either dissolved in toluene or directly in the sample benzene. Polach et al. (Reference Polach, Gower, Kojola and Heinonen1983) made a comparative study of various scintillators and concluded that crystalline butyl-PBD dissolved in sample benzene (15 g/L) gave superior and stable performance even under extreme quench conditions. The Packard Tri-Carbs, using time-resolved LSC, require a secondary scintillator (bis-MSB) as described below. In the Waikato laboratory, the scintillator (butyl-PBD) is dissolved directly into the sample benzene at a concentration of 15 g/L. The vial is then transferred into a Quantulus spectrometer and allowed to cool and dark adapt for a minimum of 8 hr prior to the commencement of counting.
Factors Interfering with ß-decay Detection by LSC
Dark Current
Early LSC designs employed a single PMT; however, a major problem with these devices was thermionic noise (dark current), which is events produced within the PMT due to ionization and discharge of residual gases, and this constituted a significant component of the LSC background. Almost all modern LSCs are based on the design of Hiebert and Watts (Reference Hiebert and Watts1953). Their system employed (i) two diametrically opposed PMTs with the sample vial positioned between them, (ii) fast coincidence circuitry (∼20 ns resolving time) to enable differentiation between decay events occurring in the sample vial (coincident in the two PMTs) and random non-coincident thermionic noise. For example, if the noise rate of both PMTs was ∼10,000 counts per min (cpm), the actual chance co-incidence rate is <0.07 cpm, and (iii) a summation circuit to sum the individual PMT pulses. Incorporation of this circuitry makes the pulse amplitude independent of the location of the event within the sample vial.
Optical Crosstalk
Optical crosstalk occurs between the opposing PMTs. An event occurring in one tube initiates a pulse in the other (Noakes et al. Reference Noakes, Crook and Johnson1977). Ionizing events may occur in either PMT due to interactions between the molecules of the tube material and incident radiation. Butterfield and Polach (Reference Butterfield, Polach, McQuarrie, Ediss and Wiebe1983) and Gupta and Polach (Reference Gupta and Polach1985) have described methods used to reduce optical crosstalk in LS counters, both by optimizing and refining electronic circuitry to enable differentiation between sample and non-sample events and by masking areas in the counting chamber to reduce reflection. Carefully designed vials, vials masked above the sample level and vial holders can also help to reduce crosstalk, by minimizing the view of opposing PMTs to each other.
Line Transmission Noise
Line transmitted switching noise and variation in the high voltage supply can influence reproducibility in LS counting. Power supplies are therefore frequently filtered and regulated, either with line noise suppression electronic transformers or a suitable uninterruptable power supply (UPS) unit. A clean and stable voltage supply is crucial because of the relationship between electronic particle detection and the energy of the decay event.
Radiofrequency Interference
Radiofrequency interference is generated by lights, motors and switches in the vicinity of the counter. RF detection circuitry can be fitted which will identify RF signals and ensure they are removed from the sample 14C spectrum.
Static Induced Noise
Static induced noise results from the build-up of static electricity through friction generated from the movement of vials throughout the counting system. Earthing of vials and holders and an ionizing unit which the vials move past, can be used to remove static electricity prior to counting.
Radon Contamination
Radon can follow benzene synthesis and not be removed by the various processes. 222Rn and its daughter nuclides emit alpha and beta particles and gamma photons that can contribute to the count rates, resulting in radiocarbon ages that are too young. However, radon’s short half-life (3.82 days) and the extremely short half-lives of its daughters (the order of mins and secs) down to 210Pb in the decay chain mean that a delay in counting eliminates the problem. Sample benzene is therefore often left for 3–4 weeks to allow any radon and its short-lived daughters that may be present to decay. Potential 222Rn contamination is more significant in older samples because of their lower count rates.
Natural Radioactivity and Cosmic Radiation
Other natural radioactivity also influences background count rates. This is reduced through shielding of the counting environment. This may be passive or active shielding. The passive shield consists of lead which shields the counting chamber by absorbing external radiation. Graded shields are sometimes used in which the lead shield has an inner lining of cadmium (to absorb lead X-rays generated in the shield) and in turn this may have an inner lining of copper to absorb cadmium X-rays. The term “active shielding” describes electronic means of recognising and eliminating background-causing events from the sample β- spectrum. Active shielding occurs in two forms in modern LS counters. The Perkin Elmer Quantulus utilizes an electronic anti-coincidence guard, comprising a volume of liquid scintillator containing a pair of guard phototubes that surrounds the counting chamber and sample PMTs (Figure 1A). Ionizing radiation from non-sample external sources passing through the guard liquid scintillator excites it and the light produced is detected by the guard PMTs. If an ionizing event is recorded simultaneously in the guard and sample PMTs, it is rejected as a background count. Some Packard counters utilize “time resolved counting” and quasi-active guards to differentiate between background and sample events This is discussed in detail later.
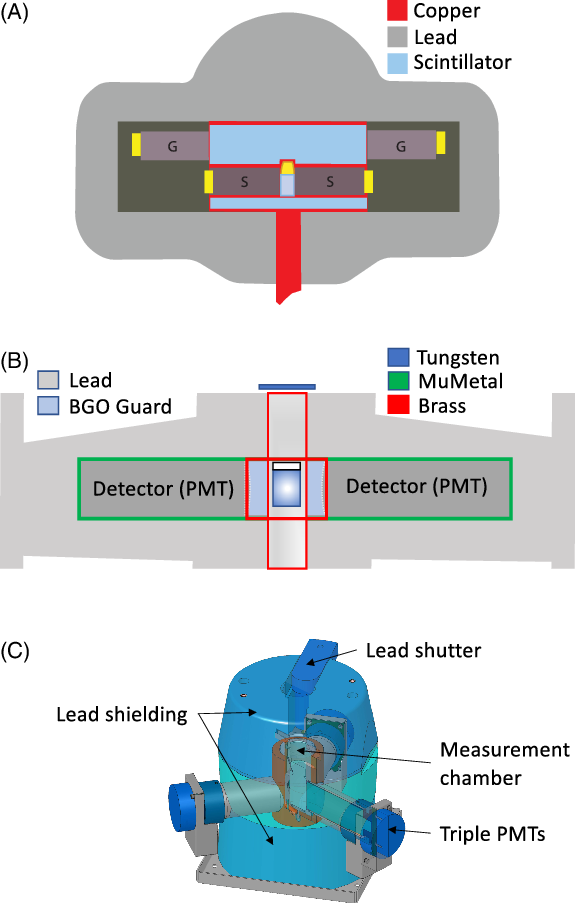
Figure 1 Schematic diagrams of LSC counting chambers. (A): Perkin Elmer 1220 Quantulus. G = Guard PMT, S = Sample PMT, figure drafted by Dr Andrew Lorrey; (B): Perkin Elmer Quantulus GCT A6220; (C): Hidex 300 SL. Figures reproduced with permission from Perkin Elmer and Hidex.
RADIOCARBON DATING AT THE UNIVERSITY OF WAIKATO USING THE QUANTULUS 1220 LOW LEVEL LSC
The Wallac Quantulus 1220 LS spectrometer emerged in the early 1980s and was designed specifically for low level counting applications, including 14C dating. The instrument was originally designed and manufactured in Turku, Finland by Wallac Oy engineers. The concept of “total optimisation” as applied to an LS spectrometer was developed in consultation with Henry Polach from ANU (1925–1996). Wallac Oy was sold to EG&G in 1993 which in turn bought Perkin Elmer in 1999 (and took the name). The 1220 Quantulus was last manufactured in 2015 with service support extended until December 2022.
For the Waikato LS laboratory, specializing in high precision 14C analysis of Marine Isotope Stage (MIS3; 27,000–60,000 cal BP) tree rings, the “total optimisation concept” includes intensive pretreatment regimes extracting alpha-cellulose, pre-conditioned benzene preparation vacuum lines producing high purity and unquenched benzene samples, large benzene volumes (8.6 mL), long count times (a minimum of 10 k min per sample), high purity and low background synthetic silica counting vials, dissolution of butyl-PBD scintillator directly into the counting vials (15 g/L) and advanced LS electronics. The “total optimisation concept” (Polach Reference Polach1987) has also been applied in the design of the Perkin Elmer 1220 Quantulus. The counter components requiring optimization are “shielding and electronics, data processing, data evaluation, and validation” (Polach Reference Polach1987).
Shielding
The Quantulus achieves ultra-low background levels by both passive and active forms of shielding. The passive shielding consists of a 650 kg asymmetric lead block that encloses the sample PMTs. It is constructed from low residual activity lead and the internal cavity surrounding the PMTs is lined with high purity copper (Figure 1A). A layer of cadmium, lined with copper, surrounds the sample PMTs (S in Figure 1A) to shield against neutrons (Kojola et al. Reference Kojola, Polach, Nurmi, Oikari and Soini1984). The passive shield is thickest at the top, where the cosmic ray flux is most intense. Active shielding in the Quantulus is in the form of a liquid scintillation anticoincidence guard, which completely surrounds the sample phototubes, within the lead shield. This active guard has an additional pair of “guard” PMTs (G in Figure 1A), which normally operate in anticoincidence with the sample PMTs, thus rejecting cosmic induced pulses.
Sample Handling
The counting vial is placed into one of three trays located beneath the shield, and counting data (tray position number 1–60, sample identification number, counting requirements, etc.) entered into a laboratory computer. The LS vial is housed in a stepped stainless steel sleeve, which forms a light seal when the sample is loaded through the bottom of the shield assembly, by a low activity copper piston. The sample changer and shield areas are refrigerated to 12ºC to reduce benzene evaporative loss, and also ventilated, to prevent condensation on vials and to eliminate possible radon build-up.
Electronics
The Quantulus has been designed with state-of-the-art electronics that includes short coincidence resolution time, two-position coincidence bias, and pulse comparison analysis.
Coincidence Resolution Time
All LS counters with horizontally-opposed PMTs record pulses initiated within each PMT only if they fall within a set coincidence resolution time interval, as discussed above. This reduces the possibility of pulses generated within either tube being recorded as genuine decay events, and results in a lowering of background levels. The Quantulus has a very short coincidence time (20 nsec) compared with the average of 25–40 nsec in conventional counters.
Selectable Coincidence Bias
In LS counters, pulses generated within each PMT are summed, so long as they occur within the specified coincidence resolution time, as noted above. However, some events not originating in the counting sample, can generate coincident pulses and contribute to an increase in background levels. For example, an event originating in one PMT may result in a very large pulse in one tube, and a coincident, but smaller pulse in the other. Events of this nature can be recognized and rejected, by accepting for coincidence summing only those pulses which originate in either PMT, but have an amplitude larger than a certain value, defined as the “coincidence bias.” The result is that the smaller of the two time coincident pulses, if also smaller than the set coincidence bias, will not be accepted for pulse summation. The Quantulus, unlike most conventional counters, incorporates a two-position, coincidence bias threshold, allowing counting optimization for either 3H (low bias) or 14C (high bias).
Pulse Amplitude Comparison (PAC)
The PAC circuitry compares the amplitude of the pulses from each PMT and, if the pulse heights differ by more than a selected amount, the pulses are rejected as background events. PAC levels are software selectable, and determine the amount of pulse amplitude variation that may be tolerated. The optimum PAC setting is experimentally determined, and results in lower background levels without significant reduction in counting efficiency.
Other electronic controls include: high voltage spectrum stabilizer, negative ion generator to remove static charges on counting vials, pulse shape analysis (PSA) capabilities to allow differentiation between alpha and beta emitters, and radiofrequency (RF) pickup.
Twin multichannel analyzers (MCAs) record both coincident and anti-coincident events in both sets of tubes, with the data not only used for age calculation, but also for quality control purposes.
Performance Data
Table 1 summarizes typical counting performance data for synthetic silica 0.3-mL minivials, 3-mL standard vials and 10-mL high precision vials in the Perkin Elmer 1220 Quantulus.
Table 1 Typical performance data in the Perkin Elmer 1220 Quantulus.

Notes: No = derived net cpm for 14C reference standard, 0.95 oxalic acid.
The data above are derived from a wide window (generally 100–550) from typical background and modern count rates in a number of Quantulus counters. It does not indicate the maximum performance data. The scintillator used is butyl-PBD at a concentration of 15 g/L. High coincidence bias is selected for all measurements.
RADIOCARBON DATING AT THE SCOTTISH UNIVERSITIES ENVIRONMENTAL RESEARCH CENTRE USING TRI-CARB LOW LEVEL LSC
At the Scottish Universities Environmental Research Centre radiocarbon laboratory, the emphasis until the early 2000s was on undertaking routine precision radiocarbon measurements, mainly on UK archaeological samples (almost exclusively less than two half-lives in age). This was undertaken using Packard Tri-Carb LSCs employing time-resolved LSC. However, in 2003 SUERC began to operate a 5 MV NEC accelerator mass spectrometer (AMS) and in 2007 this was followed by the installation of a 250 kV NEC single stage AMS. During this period, LSC was phased out. However, from the mid-1980s until this time, the laboratory was closely involved with Packard Instruments in optimizing the performance of their instruments.
The introduction of Packard low level counters in the 1980s used a completely different concept to the Quantulus. There was no enhanced passive shielding and background reduction relied totally on their concept of burst counting circuitry.
Electronics—Burst Counting Circuitry
LSC background can broadly be divided into quenchable and non-quenchable components (Horrocks Reference Horrocks1985). The quenchable component, accounting for roughly one third of the total, is derived mainly from cosmic rays and other high energy forms of radiation interacting with the liquid scintillation cocktail. The reason that most is high energy derives from the fact that the particles or photons have to traverse the lead shield, reflector and wall of the counting vial before interacting with the scintillation cocktail. The light pulses produced are similar to those produced by β- decays. The non-quenchable component, accounting for the other two-thirds, derives from the interaction of cosmic radiation and natural radioactivity in the instrument components with the glass wall of the photomultiplier tubes and other components of the instrument surrounding the sample. Light pulses produced by this type of event can be distinguished from true β- events as they comprise a prompt pulse followed by a series of low photon-yield after-pulses. These after-pulses are due to Cerenkov events resulting from high energy radiation interacting with the glass vial or glass wall of the PMTs. The Packard Tri-Carbs introduced in the 1980s (Packard 2000CA/LL and subsequent models) used what is termed time-resolved liquid scintillation counting (TR-LSC) as the basis for background reduction. Essentially, TR-LSC removes a large proportion of the non-quenchable component of the background by analysing pulse shapes and after-pulses. A true β- event comprises a prompt pulse that lasts for between 2 and 8 ns and very few or no trailing pulses. In contrast, the after-pulses that follow the prompt pulse in a non-quenchable background event can last for as much as 5 μs. Usually, a far greater number of after-pulses will follow a non-quenchable event compared to a true scintillation event of the same energy. Valenta (Reference Valenta1986) described what he termed burst counting circuitry to distinguish between these two types of events based on the number of after-pulses. Basically, each coincident event triggers burst counting circuitry that counts the number of after-pulses (pulse index) that follow the prompt pulse and creates a three-dimensional plot of energy, time and after-pulse number. By accepting only those pulses with few or no after-pulses, a reduced background count rate can be achieved.
Counting Efficiency and Cocktail
Polach et al. (Reference Polach, Calf, Harkness, Hogg, Kaihola and Robertson1988) demonstrated reduced efficiency in these counters compared to those with conventional circuitry when using butyl-PBD as the scintillant. However, Cook, Harkness and Anderson (Reference Cook, Harkness and Anderson1989) restored much of this efficiency loss by the addition of the secondary scintillant bis-MSB. They concluded that the enhancement in efficiency was probably due to a sharpening of pulse widths or a reduction in after-pulsing in true β- events, rather than to its normal use as a wavelength shifter, since the effect was not observed to any marked extent with other secondary scintillants such as POPOP and dimethyl POPOP. Anderson and Cook (Reference Anderson and Cook1991) further demonstrated for counters employing burst counting circuitry that both quenching and counting efficiency were sensitive to changes in scintillant concentration. However, they also demonstrated that there are plateau regions where neither parameter is significantly influenced by moderate changes in a cocktail containing butyl-PBD and bis-MSB. They recommended a cocktail of butyl-PBD (2.8 mg/g benzene) and bis-MSB (3 mg/g benzene). This gave an open window counting efficiency of ∼90% while exhibiting optimal resistance to quenching. XL models of the Tri-Carb employed an additional background reduction feature in the form of a modified detector assembly comprising a long fluorescence lifetime plastic that is optically coupled to the PMTs (Valenta and Noakes Reference Valenta and Noakes1989). This causes an extended burst of after-pulses when activated by a high energy event, thereby improving the discrimination of non-quenchable background from β- pulses. Thus, the plastic is acting as a quasi-active guard (it has no dedicated PMTs). Pico holders made from the same plastic that could accommodate 7 mL low potassium borosilicate vials were also employed to reduce background. The similar use of BGO (bismuth germanate) as a guard detector (Noakes and Valenta Reference Noakes, Valenta, Cook, Harkness, MacKenzie, Miller and Scott1996) was employed in the 2770TR/SL, 3170TR/SL and subsequent models. Again, BGO functions by significantly lengthening the light pulses and increasing the discrimination against high energy events originating outside the sample vial. Current instruments for 14C still offer the BGO guard detector and an additional Pulse Amplitude Comparison (PAC) optional feature on the higher end Tri-Carbs. PAC compares the relative amplitudes of sample vs background pulses to effect elimination of background events. Table 2 illustrates the performance of the Packard counters employing the different features discussed above using standard 7 mL low potassium borosilicate vials and indicates a five-fold increase in performance using TR-LSC with the BGO guard and vial holder compared with TR-LSC alone.
Table 2. Comparison of performance using different features in Packard counters. Samples comprised 3 mL benzene in standard 7 mL low potassium borosilicate glass vials. Cocktail: butyl-PBD/bis-MSB.

THE FUTURE OF RADIOCARBON ANALYSIS BY LSC
The Decline of Radiocarbon Dating by LSC
The advent of AMS radiocarbon dating in the late 1970s, eventually resulted in a steady decline of samples measured by LSC. This was due to the ability of AMS to measure much smaller sample sizes (3 orders of magnitude) in significantly reduced timescales (around 2 orders of magnitude), resulting in more cost effective sample pretreatment and preparation for measurement (conversion to graphite). For example, when the SUERC lab undertook radiocarbon analysis by LSC, between 3 and 6 benzene samples were produced per day. The lab now produces 32 graphite samples per day for AMS analysis. The dominance of AMS has accelerated in the last two decades, with instruments becoming less expensive, smaller in size, offering better precision and with the small sample sizes allowing an increased ability to automate conversion of sample C to CO2 and to graphite.
Modern LS Spectrometers
Modern LS spectrometers are dominated by two manufacturers—Perkin Elmer (Packard Tri-Carb and discontinued 1220 Quantulus) and Hidex.
The Packard Tri-Carb instruments described above now include GCT models, which use Guard Compensation Technology (GCT) in addition to the BGO Guard Detector (see Figure 1B). Guard Compensation Technology is based on analysing background spectra in the BGO guard. The efficiency of the detector is used to calculate the number of background events that are missed. From this it is possible to predict the shape of the background spectrum if 100% of the background counts had been detected. This background spectrum is then subtracted from the sample spectrum.
Hidex LSCs were launched in 2008 and offer both standard and Super Low level (SLL) options. These instruments utilize three PMTs aligned on a single plane at 120° from each other (see Figure 1C). The use of triple coincidence counting reduces the probability of noise pulses and thereby reduces background count rates. The SLL option includes cooling of the detector assembly, increased passive lead shielding and an active scintillation guard placed beneath the β- detector and equipped with a separate PMT.
Specialized Dating Applications Utilizing LSC
The ability of AMS to measure very small sample sizes (mg of C used for AMS compared with multiple g for LSC) is also the method’s Achilles heel, as it has an increased vulnerability to modern contamination, both in situ and during pretreatment and analysis. This impacts the ability of AMS to analyze old samples, with uncertainties rapidly increasing for ages older than ∼30 kBP. The large uncertainties relate to relatively high and variable background blank levels for AMS (Waikato AMS ∼53,190 BP) compared with LSC (Waikato LSC ∼63,000 BP—see Figure 2). This is probably due to a small amount of modern C contaminating process chemicals—for example, CuO commonly used in oxidation reactions.

Figure 2 The 29 most recent Background standard blanks (both chemical and environmental, MIS5 Renton Road kauri) determined by Waikato High Precision LSC (HPLSC) and AMS.
Although individual AMS analyses are more precise than HPLSC, the background levels are higher and they are far more scattered. This spread in AMS background measurements is almost identical to that observed at the SUERC AMS laboratory (Table 3).
Table 3 Summary of SUERC AMS non-bone background values 2015–2020.

The ability of LSC to achieve low and statistically reproducible background blank levels makes this method of analysis ideal for 14C measurement of older (e.g., > ∼30 kBP) material where larger sample volumes are available. One example is the MIS3 New Zealand ancient kauri (Agathis australis) resource which contains extensive quantities of long-lived trees (biological ages typically in the range of 600–1000 yr (Ogden et al. Reference Ogden, Newnham, Palmer, Serra and Mitchell1993). Sequential analysis of ancient kauri tree-rings (e.g., Lorrey et al. Reference Lorrey, Boswijk, Hogg, Palmer, Turney, Fowler, Ogden and Woolley2018; Cooper et al. Reference Cooper, Turney, Palmer, Hogg, McGlone, Wilmshurst, Lorrey, Heaton, Russell, McCracken, Anet, Rozanov, Friedel, Suter, Peter, Muscheler, Adolphi, Dosseto, Faith, Fenwick, Fogwill, Hughen, Lipson, Liu, Nowaczyk, Rainsley, Bronk Ramsey, Sebastianelli, Souilmi, Stevenson, Thomas, Tobler and Zech2021) can provide much higher resolution 14C atmospheric data that any other available archives (e.g., Suigetsu Lake sediments, Bronk Ramsey et al. Reference Bronk Ramsey, Heaton, Schlolaut, Staff, Bryant, Brauer, Lamb, Marshall and Nakagawa2020) or Hulu Cave speleothem deposits (Cheng et al. Reference Cheng, Edwards, Southon, Matsumoto, Feinberg, Sinha, Zhou, Li, Li, Xu and Chen2018). Large volume measurement by PerkinElmer 1220 Quantulus results in uncertainties about half those obtained by current AMS instrumentation. Therefore, while AMS has largely superseded LSC because of advantages in sample size and counting time, there are still niche areas where LSC has a distinct advantage.


