


1. INTRODUCTION
Marine traffic engineering is a new branch of learning that has developed during the last forty years. In Europe, it is called marine traffic studies. The objective is to improve the safety and efficiency of marine traffic, especially in congested sea areas. The basic concept is to solve marine traffic problems in a systematic way considering the influencing factors of ships, mariners, traffic management, navigable waters and environment. China has developed to be a large shipping nation, and marine traffic volumes in some areas have increased quickly. This has made it necessary for marine traffic engineers and administrative officers to have systematic knowledge and effective technology to deal with the complicated marine traffic problems concerning safety and efficiency. Marine traffic engineering was introduced into China in the 1980s. Since the 1990s, a series of research achievements have been made and many papers have been published [Reference Wu and Zhu1].
Marine traffic survey is a fundamental part of marine traffic engineering. It has been used as traditional technical tool. The items and results of marine traffic survey vary according to the specific objective of a particular survey. For assessment of safety or effectiveness in certain water areas, the distribution of ship tracks is always included as one of the most significant results of marine traffic survey. A ship track is the line connecting the positions of a moving ship. By plotting all the ship tracks in a waterway, a diagram of tracks distribution can be obtained. With a diagram of ship tracks distribution, some traits of a traffic stream, sometimes referred to as traffic flow, can be revealed [Reference Jin, Xu and Yang2].
In this paper, methods of marine traffic survey are discussed and an appropriate one is selected to obtain the traffic data considering the availability of equipment and research circumstances in China. A semi-automatic artificial way of plotting the ship tracks distribution diagram is presented with illustrations. Details of the diagram plotted by use of the collected traffic data are described for reference.
2. MARINE TRAFFIC SURVEY METHODS
Marine traffic survey methods consist mainly of marine traffic observation, questionnaires and the searching of records. Questionnaires investigate the subjective view of people and records provide historical data. However, only marine traffic observation can be used to obtain traffic data for plotting the distribution diagram of ship tracks. Thus four commonly used marine traffic observation methods will be discussed [Reference Inoue, Hara and Tanaka3] [Reference Inoue and Hara4].
2.1. Marine traffic observation methods
2.1.1. Visual observation
The method of visual observation is simple, the observation is made with human eyes. It is not necessary to use special equipment except for a binocular. Through visual observation, the name, nationality, type, size of ships can be identified. But at night or in fog the effectiveness of this method is limited. Visual observation is a basic and widely used marine traffic observation method.
2.1.2. Radar observation
Radar observation can be carried out at all times, in day, night or fog. With this method, ship position data can be obtained. The weakness of radar observation is that the name, nationality, type and size of ships cannot be identified, and the echoes of small vessels may be missed.
2.1.3. Automatic Identification System (AIS)
According to International Convention for the Safety of Life at Sea (SOLAS) Chapter V, Regulation 19.2, “All ships of 300 gross tonnage and upwards engaged on international voyages and cargo ships of 500 gross tonnage and upwards not engaged on international voyages and passenger ships irrespective of size shall be fitted with an Automatic Identification System (AIS).” [5] Observing marine traffic by using AIS is more efficient than other methods because some of the traffic data can be recorded automatically.
2.1.4. Aerial observation
Cameras and video cameras are used to photograph from aircraft and can observe over an extensive water area. However aerial observation costs a tremendous amount of money; thus it is only applied in very important marine traffic surveys.
2.2. Comparison of observation methods
All the methods mentioned above have been applied in China. After consideration of the advantages and disadvantages of these methods and the Chinese marine research circumstances the author suggests selecting radar observation as the method used for plotting the distribution diagram of ship tracks. The reasons are as follows:
• Visual observation is a supplementary method. The ship position data cannot be recorded accurately;
• AIS can only record traffic data of ships equipped with AIS. The data of small ships sailing without AIS will be missed. However, sometimes the activities of small ships, especially fishing ships, greatly affect traffic considerations in certain water areas;
• Aerial observation is too expensive to be widely and frequently used;
• Radar observation can be carried out at all times. By use of high resolution radar, ship position data can be recorded accurately, and can include small ships. Radar observation can be operated both on shore and onboard. It is economical and practical.
In China, researchers have focused their studies on the safety and efficiency of marine traffic in important port areas or congested water areas. By the end of 2008, China had 26 Vessel Traffic Services (VTS) centres and 92 radar stations. Almost all the important water areas are covered by VTS systems. With the high resolution radar of a VTS system, researchers can obtain the traffic data in VTS centre. It is convenient, efficient and widely accepted by Chinese researchers [Reference Zhang and Li6] [Reference Bai, Dai, Sun and Zhu7]. The traffic data in this paper was collected from VTS centres.
Due to requirements on the confidentiality of information and technique limits, radar signals cannot usually be obtained directly from VTS centres in China. Thus the ship position data cannot be recorded automatically by radar data processing equipment. The data of radar can be recorded directly to recording sheets or recorded with cellophane. But these recording methods are only effective when marine traffic density is not high. Radar photography is the most frequently used recording method. A camera is rigged in front of a radar screen at an appropriate distance and the radar screen picture can be taken automatically or manually at regular time intervals. The time interval may be 1, 2, 3 or 6 minutes according to the traffic density, the range scale of the radar and other influencing factors. Sometimes screen capturing is an alternative method of radar photography if the radar signals can be displayed on the computer. The photographs of radar in this paper are captured automatically from the monitor screen in the VTS centre with the time interval of 3 minutes.
3. PLOTTING OF SHIP TRACKS DISTRIBUTION DIAGRAM
Three steps are needed to plot the diagram of ship tracks distribution. Some pieces of handy software such as, ACDSee Pro 2.5 [8], Microsoft Office Excel 2007 [9], and Adobe Photoshop CS3 [10] will be needed. The details of these steps are described as follows:
3.1. Ship position data recording
The photographs of radar in this paper are captured from the Dalian VTS centre, China. These photographs reveal the traffic status of ships' routes in the Laotieshan watercourse over a 72 hour period. The radar signals are displayed combined with Electronic Chart Display and Information System (ECDIS). VTS operators plot radar signals with different symbols for different kind of ships. They also label the ship's name beside the symbol to make a distinction. The Automatic Radar Plotting Aid (ARPA) displays the course of the ship. See Figure 1.

Figure 1. Photograph of radar.
As all the information is recorded in the form of a picture, the picture element (pixel) is the only thing to indicate the ship's position. ACDSee can be used to read the abscissa and ordinate of the pixel. See Figure 2. An Excel table is designed for recording the abscissa and ordinate of the pixel as shown in Figure 3. It is not necessary to record all the position points of each ship on every photograph. Only the start, end, and turning point positions need to be recorded. Even so, reading and recording the ship position data is still a time-consuming job as it can only be carried out manually.
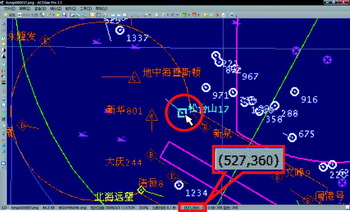
Figure 2. Reading abscissa and ordinate of pixel.

Figure 3. Ship position data recording table.
3.2. Data modification
Because radar observation needs to be carried out for at least 72 hours continuously, several observers are required. It should be noted that each individual observer may have a slight difference on scaling or positioning when taking photographs of radar, as can be seen in Figure 4. Thus all the ship position data recorded previously need to be modified to a common base.

Figure 4. Difference in positioning.
Firstly, a base map should be made on which just primary geographic information is included. All the ship tracks will finally be plotted on this base map. Then two geographic points are chosen as the reference points. On the base map, reference points are defined as X(A,B) and Y(C,D). On the original map, reference points are defined as x(a,b) and y(c,d); any ship position point is defined as z(e,f) as shown in Figure 5. As:
The ship position on the base map, defined as Z(E,F), can be calculated by Equations (2) and (3):

Figure 5. Reference points and ship position point.
3.3. Diagram of ship tracks distribution drawing
A scatter diagram is created to plot all the ship positions. The position points of each individual ship are connected with a smooth curve. The scatter diagram is the draft ship tracks distribution diagram. Photoshop is used to adjust the size and scale of the draft in accordance with the base map. Finally, the distribution diagram of the ship tracks can be obtained by overlaying the draft diagram on the base map as shown in Figure 6.

Figure 6. Distribution diagram of ship tracks.
4. CONCLUSIONS
Radar photography observation is suitable when marine traffic density is high. The method of diagram plotting mentioned above is practical and operable. The photographs of radar are accessible and the necessary pieces of software are in common use. Although the workload of reading and recording the ship position data is heavy, it is an efficient way of plotting a distribution diagram of ship tracks, especially when the radar signals cannot be obtained directly. Future researches of Image Recognition System need to be done so that ship positions on the photograph can be recognized and recorded automatically. By then, this semi-automatic artificial way of diagram plotting will become an automatic process.


