Introduction
External beam radiotherapy (EBRT) followed by intracavitary brachytherapy is the primary treatment protocol for cervical cancer.Reference Duan, Kim, Elassal, Lin and Shen1 Conventional EBRT irradiates the whole pelvis region either from anteroposteriorly or/and laterally. Thus, critical organs at risk (OARs) are exposed to radiation and severe radiation-induced toxicities are observed. Over the last decade, interest in the use of intensity-modulated radiotherapy (IMRT) to treat cervical cancer has increased. IMRT technique has the benefit over conventional whole-pelvis irradiation; potentially improves the target dose coverage and reduces the toxicity to OARs).Reference Georg, Georg, Hillbrand, Kirisits and Pötter2,Reference Portelance, Chao, Grigsby, Bennet and Low3 IMRT typically involves 5–9 beams placed around the patient at equal angular spacing and the uniform radiation intensities from open fields are modulated by multileaf collimators (MLCs). A novel radiation technique has evolved by replacing 5–9 fixed beam angles in IMRT, with a single gantry arc of up to 360°, known as volumetric-modulated arc therapy (VMAT).Reference Otto4,Reference Teoh, Clark, Wood, Whitaker and Nisbet5
VMAT has been introduced to overcome some of the limitations associated with fixed-field IMRT. It allows continuous delivery of radiation by simultaneously varying the dose rate, position of MLCs and gantry rotation speed. VMAT has achieved highly conformal dose distributions, with improved target dose coverage and sparing of normal tissues, as compared to conventional radiotherapy and IMRT techniques.Reference Vanetti, Clivio and Nicolini6–Reference Zhang, Happersett, Hunt, Jackson, Zelefsky and Mageras8 VMAT also has the potential to reduce monitor unit (MU) usage and ultimately reduce the treatment delivery time. Each arc is divided into multiple equal sectors in VMAT technique and MLC modulates the open radiation field by to-and-fro movement between successive sectors. Sector angle is defined by the parameter ‘Increment of Gantry Angle’ (IGA) and the number of sectors is given by arc length divided by IGA. The number of sectors and IGA has the tendency to influence the quality of treatment planReference Yin, Wu and Gong9,Reference Abbas, Moseley, Kassam, Kim and Cho10 along with the number of arcs and arc lengths.Reference Masi, Doro, Favuzza, Cipressi and Livi11–Reference Wang, Chen, Zhu, Guo, Zhang and Sun13 Influence of smaller and larger IGA was reported as negligible in oesophageal cancerReference Nithya, Raj, Rathinamuthu, Sharma and Pandey14 and contrarily, larger IGA yielded significantly better plans in cervical cancer.Reference Chen, Li and Chen15 In this study, we have investigated the influence in VMAT plans by a sequence of IGAs in definitive radiotherapy treatment for cervical cancer. The plans are quantitatively analysed in terms of conformity index (CI), heterogeneity index (HI), dose–gradient index (DGI), target coverage (TC) by prescription dose, MU usage, control points (CPs) and dose to organs.
Materials and Method
Patient selection
In this retrospective study, we selected 27 patients with cervical cancer having aged between 54 and 69. All the patients enrolled in this study were at T3N1M0 stage of cervical cancer.Reference Edge and Compton16 Each of them had evolved lymph nodes and were preparing to undergo definitive radiotherapy treatment. Patients were immobilised on a vacuum bag (vac-loc; Orfit Industries, Wijnegem, Belgium), which hardens as per the shape of overlaying patients when deflated. Computed tomography (CT) images were acquired on Siemens PET-CT (Biopgraph mCT 20, Munich, Germany) at a 3 mm slice thickness. 3D CT images were acquired from the L2 vertebral body to 5 cm below the ischial tuberosity. CT images were transferred to Monaco Sim (CMS Elekta, Sunnyvale, CA, USA) work station for contouring. Planning target volume (PTV) and OAR were delineated on the CT images by an expert radiation oncologist and using the available protocol for definitive treatment of cervical cancer.Reference Lim, Small and Portelance17,Reference Forrest, Presutti, Davidson, Hamilton, Kiss and Thomas18 CT images along with delineated structure sets were transferred to Monaco (CMS Elekta, Sunnyvale, CA, USA) treatment planning system (TPS) for planning the VMAT technique. Elekta Versa HD (Elekta AB, Stockholm, Sweden), a linear accelerator was used to deliver the VMAT plans. The linear accelerator is fitted with MLCs having 80 leaf pairs of 5 mm width.
Treatment planning
The prescription dose to PTV was 50 Gy and was administered in 2 Gy per fraction.Reference Lim, Small and Portelance17–Reference Vrdoljak, Omrcen and Novaković19 VMAT plan was delivered in a single arc of 360° gantry rotation (clockwise direction from 180 to −180°). Sweep sequencer tool was used for MLC segmentation in VMAT technique. On contrary to static fields in IMRT, the intensity of photon field is modulated in a gantry arc in VMAT plan. The planned arc of VMAT was divided into uniform sectors using the parameter ‘IGA’ (Figure 1). Intensity modulation was facilitated by MLC; MLC segments move from right to left in a sector and return back from left to right in the following sector during continuous irradiation. Thereby, intensity modulations were done in a to-and-fro movement between successive sectors. 6 MV flattened photon beam was used to deliver the prescribed dose using VMAT plan. VMAT plans were optimised by varying the parameter ‘IGA’ (as 10, 20, 30 and 40°) and the plans were named as VMAT,10 VMAT,20 VMAT,30 and VMAT,40 respectively. VMAT plans were optimised to achieve the required dose constraints (Table 1) using the optimisation parameters (Table 2) and calculation parameters (Table 3). The radiation dose from VMAT plan was calculated on 3D CT images and heterogeneous corrections were applied.

Figure 1. Comparison between the single arc of 360°, VMAT plans with IGA (a) 30° and (b) 40° in cervical cancer.
Table 1. Treatment planning objectives

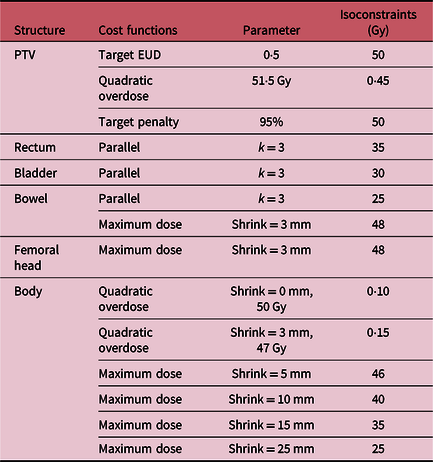
Table 2. The cost functions for optimization of VMAT plans in cervical cancer

Abbreviations: EUD, equivalent uniform dose; k, power-law exponent.
Table 3. Sequencing parameters and calculation properties for VMAT plans

Plan quality indices and statistical analysis
CI, HI, DGI and TC by 95% isodose line were derived to compare the dosimetric characteristics of the VMAT plans optimised with different ‘IGA’.Reference Chen, Li and Chen15,Reference Paddick20 In addition to that, dose to OARs were obtained from dose–volume histogram. The plan quality indices were calculated using the following Equations (1–3):
 $${\rm{CI}} = \frac{{{{{\left( {{\rm{T}}{{\rm{V}}_{{\rm{RI}}}}} \right)}^2}}}\over{{\left( {{\rm{TV}} \times {{\rm{V}}_{{\rm{RI}}}}} \right)}}},$$
 $${\rm{HI}} = \;\frac{{{\left( {{{\rm{D}}_{2\% }} - {{\rm{D}}_{98\% }}} \right)}}\over{{{{\rm{D}}_{50\% }}}}},$$
 $${\rm{DGI}} = \frac{{{{{\rm{V}}_{{\rm{RI}}}}}}\over{{{{\rm{V}}_{{\rm{HRI}}}}}}}.$$
Volume of PTV receiving prescription dose (TVRI), volume of PTV (TV) and total volume encompassed in prescription dose (VRI) were substituted in Equation (1) to calculate CI. Maximum dose received by 2% of PTV (D2%), minimum dose received by 98% of PTV (D98%), dose received by 50% of PTV (D50%) were substituted in Equation (2) to calculate HI. Total volume encompassed in half of the prescription dose (VHRI) and corresponding VRI were substituted in Equation (3) to calculate DGI.
Physical parameters such as total MU and CPs were recorded. CPs per 10° were calculated to understand the physical constraints in MLC for PTV coverage. The width of PTV required to scale-up by MLC is given at 10° increment for a cervical and oesophageal cancer (Figure 2). IGA 30 had yielded better VMAT plans in earlier studies,Reference Nithya, Raj, Rathinamuthu, Sharma and Pandey14,Reference Chen, Li and Chen15 and so VMAT30 plan was considered as a reference for statistical comparison. Each of the VMAT plans was renormalised to provide the same mean dose to PTV, as in VMAT30 to avoid any bias or rescaling effects. The plan quality indices and dose to OARs were compared by paired sample t-test; p-value <0·05 indicated the difference as significant.21

Figure 2. Comparison between the width of PTV in beam’s eye view at 10° increment for a cervical and oesophageal cancer.
Results
Plan quality indices
Table 4 compares the plan quality indices of VMAT plans for the range of IGAs. CI indicates the degree of confining prescription dose within PTV and it was worsened with larger IGA (30 and 40°). HI indicates the degree of difference between the minimum and maximum dose within PTV and it was enhanced with larger IGA (30 and 40°). DGI indicates the degree of dose–gradient in fall-off region and it was worsened with larger IGA (30 and 40°). TC was worst in VMAT10 plan and comparable elsewhere (20, 30 and 40°). Plan quality indices were significantly different (p < 0·05) with smaller IGA (10 and 20°) and remained unaltered beyond 30°.
Table 4. Plan quality indices of VMAT plans for the range of IGAs

Dose to OARs
Dose to OARS and comparison with VMAT plans are given in Table 4. Overall, dose to OARs were reduced with smaller IGA (10 and 20°) and were comparable with 40°; the differences were significant (p < 0·05). The dose received by 50% of the volume (D50%) in the bladder was worsened up to 6 Gy with larger IGA (30 and 40°). Dose to rectum (D15%, D25%, D35% and D50%) were comparable among all the plans. The volume receiving 15 Gy (V15Gy) in bowel was worsened up to 10% with larger IGA (30 and 40°). Smaller IGA (10 and 20°), worsened V25Gy up to 3% in the femoral head.
Physical parameters
Table 5 compares the number of sectors, MU and CP of VMAT plans (10, 20, 30 and 40°). MUs required to deliver prescribed doses were reduced with a decrease in the number of sectors. Meanwhile, CPs were increased with a decrease in the number of sectors. The differences were significant (p < 0·05).
Table 5. Physical parameters of VMAT plans for the range of IGAs

Discussion
In this retrospective study, VMAT plans were analysed by varying the parameter IGA. Initial optimiser in VMAT technique creates an optimal dose–fluence for the required dose constraints. MLC segmentation/CPs are created to achieve the optimal dose–fluence by ‘sweep sequencer tool’ as per the IGA (10, 20, 30 and 40°). In a similar study, comparing IGA (15, 20, 30 and 40°) in VMAT for oesophageal cancer didn’t yield any significant differences in plan quality indices.Reference Nithya, Raj, Rathinamuthu, Sharma and Pandey14 Larger IGA (30 and 40°) yielded better plan than smaller IGA (10 and 20°) in post-operative cervical cancer; the results had a correlation with MLC movements created under reduced freedom of optimisation by ‘sweep sequencer tool’ for smaller IGA (10 and 20°).Reference Chen, Li and Chen15 The controversial results from previous publicationsReference Nithya, Raj, Rathinamuthu, Sharma and Pandey14,Reference Chen, Li and Chen15 could be due to a larger volume of PTV in cervical cancer than oesophageal cancer and are explained in the present study (Figure 2). The dimension of PTV (Figure 2) in lateral directions (−90 and +90°) were smaller than in anteroposterior directions (180 and 0°). For sector 3 (−80 to −120°) and sector 7 (60– 100°) in VMAT40 (Figure 1b), the sweep sequencer had to sharply decrease the field size initially, followed by a gradual increase (Figure 2). This fluctuation could be the reason for the superiority of plan quality indices in VMAT.30 Notably, VMAT30 had an even number of sectors and were highly symmetrical (Figure 1a).
IGA 30° yielded better plans as per target dose indices but the dose fall-off region was compromised (more dose to lung) in oesophageal cancerReference Nithya, Raj, Rathinamuthu, Sharma and Pandey14 and this trend is even resembled with the present study; dose to bladder, rectum and bowel were higher with larger IGA. Eventually, dose–gradient in fall-off region was worsened with larger IGA (30 and 40°); the reason could be due to larger dimension of PTV (Figure 2) in this study (cervical cancer versus oesophageal cancer). Homogenous dose distribution within PTV was enhanced with larger IGA in this study; more number of CPs was generated by ‘sweep sequencer tool’ to improve the parameter. Eventually, the number of MUs was reduced by finer resolution of MLC segments for the optimal dose–fluence generated in initial optimisation of VMAT by Monaco TPS. Similar enhancement of homogenous dose distribution was observed within PTV of both oesophagealReference Nithya, Raj, Rathinamuthu, Sharma and Pandey14 and cervicalReference Chen, Li and Chen15 cancers with larger IGA (30 and 40°). Increase in the number of CPs enhanced the homogeneity of delivering prescribed dose within PTV but failed to confine the prescribed dose just around the PTV. As a result, confinement of prescribed dose within PTV and dose gradient in dose fall-off regions was compromised to a small extent. VMAT40 had reduced the MU usage but the CI and DGI was compromised due to large MLC field segments. Though the difference was significant, the conformal dose to PTV was quite comparable in this study, and also observed both in oesophagealReference Nithya, Raj, Rathinamuthu, Sharma and Pandey14 and cervicalReference Chen, Li and Chen15 cancers. Thus, the CI remained unaffected with a change in the size of PTV. TC was affected with smaller IGA (10°) up to 5%, in this study of definitive radiotherapy treatment for cervical cancer, which had a resemblance to a worst of 6% in cervical cancer.Reference Chen, Li and Chen15
Conclusion
In VMAT technique, defining the IGA remains vital in acquiring better plan quality indices. The current study demonstrates that the strategy of VMAT30 and VMAT40 have the potential to enhance plan quality indices/therapeutic gain. This study recommends that the larger IGA (30°) could yield better results when the number of sectors is even, for a cervical cancer patient. However, more data from more patients need to be obtained and analysed to make this an evidence-based hypothesis.
Acknowledgements
The authors are grateful to the Management of Aditya Birla Hospital, Pune for constantly supporting our academic and research pursuits. We are specially thankful to the team of radiotherapists of the hospital where the work was carried out.
Conflict of Interest
The authors declare that they have no conflicts of interest.
Ethical Approval
All procedures in studies involving human participants were performed in accordance with the ethical standards of the Aditya Birla Memorial Hospital Institutional Review Board (IRB) and with the 1964 Declaration of Helsinki and its later amendments or comparable ethical standards.
Informed Consent
Informed consent was obtained from all individual participants included in the study.