


Monitoring processes of care known to improve outcomes is a central tenet of quality improvement. Monitoring processes can be as important as measuring outcomes because process adherence rates provide critical insight into why outcomes are improving or not and help define where further opportunities lie for improvement. Processes of care should ideally be monitored daily. In practice, however, daily measurement is resource intensive and not always feasible. The burden of manual data collection may be reduced in the future by automated culling of electronic health records. However, most hospitals do not yet have robust systems based on electronic health records to automate and collate accurate measures of process compliance.
Daily process measure documentation, collation, and abstraction is particularly onerous for ventilated patients because of the high number of processes of interest, the complexity of many of these processes (eg, daily sedative interruptions and spontaneous breathing trials), and critical care providers’ many competing demands. The burden of daily process measure collection can be a hurdle preventing some intensive care units (ICUs) from participating in quality improvement initiatives.
Sampling process measure adherence once a week, 1 week a month, or some other frequency may be valid alternatives to tracking process measures daily that could decrease the burden of data collection. Previous workers have found that once-weekly sampling can be a reliable way to estimate central line and urinary catheter device-days.Reference Thompson, Edwards and Bamberg 1 – Reference Klevens, Tokars, Edwards and Horan 3 Other workers have found that estimating head-of-bed (HOB) elevation and oral care compliance once per day provides similar results to twice per day measures.Reference Rawat, Yang, Speck, Helzer, Barenski and Berenholtz 4 Beyond this, sampling strategies for daily process measure data collection have not been robustly evaluated. Current guidelines for data collection frequency are based on expert opinion rather than rigorous studies.Reference Pronovost, Berenholtz and Goeschel 5
Using a large sample of both academic and nonacademic ICUs, we investigated the accuracy of 4 sampling strategies to estimate compliance with 6 ventilator-associated pneumonia (VAP) process measures. We also sought to identify process measure characteristics associated with greater accuracy of sample estimates.
METHODS
Participating Facilities and Data Collection
From October 1, 2012, through August 23, 2015, an Agency for Healthcare Research and Quality (AHRQ) and National Institutes of Health–funded quality improvement initiative, the Comprehensive Unit-Based Safety Program (CUSP) for Ventilator Associated Pneumonia: Eliminate VAP project (CUSP for VAP: EVAP), was conducted in 56 units from 38 Pennsylvania and Maryland hospitals as a longitudinal, quasi-experimental study. Participating ICUs included medical, medical/surgical combined, cardiothoracic/cardiovascular, coronary care, and trauma units. Participants collected process measure data once daily, using a cross-sectional sampling strategy at a recommended time of 10 AM each day, for all mechanically ventilated patients. Observations were entered into a secure online data platform hosted by the Johns Hopkins Armstrong Institute for Patient Safety and Quality. Participants documented yes/no answers for each ventilator-day for each of the following processes of care: using subglottic suctioning endotracheal tubes (Sub-G ETT), elevating the head of the bed (HOB) at least 30°, performing spontaneous awakening trials (SAT), and performing spontaneous breathing trials (SBT). Participants also documented the number of times oral care was performed and the number of times oral care included chlorhexidine (CHG) in the preceding 24 hours. Data were collected according to standardized definitions using common forms provided by the CUSP for VAP: EVAP team.
Sampling Strategies
Four monthly sampling strategies were considered: sample 1 day out of a month (any day) (1 d/m), sample 1 day per week in a month (1 d/w), sample 7 consecutive days out of a month (7 d/m), and sample 7 consecutive days out of a month plus additional consecutive days as necessary to obtain at least 30 ventilator-days for that month whenever possible (7 d/m^min30).
The 1 d/m strategy was chosen to represent an extreme simplification of data collection and to serve as a lower accuracy limit on which to benchmark the other sampling strategies. The 1 d/w sample was chosen because some facilities may prefer collecting data on a fixed day in each week. The 7 d/m sample was chosen because in practice, a week can serve as a natural compression of a unit’s monthly data collection period. We did not require these 7 days to be a calendar week but allowed units flexibility to choose any day of a week as the start of the 7-day data collection. Last, the 7 d/m^min30 sample was designed to enhance the accuracy of estimates for small units that have few ventilated patients per day.
We limited this analysis to unit-months with complete data (ie, data on record for every day of the month) in order to be able to compare sample estimates to true monthly compliance rates.
Data Analysis
Descriptive characteristics of participating facilities are shown in Table 1. For the 1 d/w sampling, we created 7 samples of data for each unit-month by extracting data collected on each specific day of the week. The samplings of 1 d/m, 7 d/m, and 7 d/m^min30 were randomly selected within each month. To avoid dependence on any one particular random sample, the results for these 3 sampling strategies are averages across 100 bootstrap samples.
TABLE 1 Facility Characteristics of Units Included (Ever Had 100% Completion Rate) and Excluded (Never Had 100% Completion Rate) From This Analysis

NOTE. CCU, coronary care unit; CTICU, cardiothoracic intensive care unit; CVICU, cardiovascular intensive care unit; MED/SURG, medical/surgical unit; MICU, medical intensive care unit; NCCU, neurosciences critical care unit; SICU, surgical intensive care unit; TICU, trauma intensive care unit.
a χ2 test. If small cell values: Fisher exact test.
b For total number of hospitals and units, we presented percentage of all hospitals or units. For facility characteristics (state, hospital type, academic, hospital bed size, urban/rural status, and unit type), we presented percentage of all hospitals/units in each subgroup.
We first calculated each unit’s actual monthly compliance rates for all process measures using all observation days. Compliance was calculated as the number of times each intervention was performed out of all opportunities for the intervention, excluding days upon which the intervention was contraindicated. We defined sampling error as the absolute value of the difference between the actual and the sample compliance rates. We then calculated the percentage of unit-months with a sampling error of 5% or less and 10% or less for each of the 4 sampling strategies.
To reveal why the same sampling strategy performs differently for different process measures, we plotted unit-month level standard deviations of daily compliance rates with respect to actual monthly compliance rates. For each sampling strategy, we calculated the correlation coefficient between variation in daily rates (mean standard deviation of daily rates across all unit-months) and sampling accuracy (1–mean sampling error). Our hypothesis was that the accuracy of a sampling strategy was negatively correlated with variation in daily rates, meaning that with increasing variation in daily rates, sampling accuracy worsens.
We used the Fisher exact test or χ2 test to assess differences in binary or categorical data. We used paired 2-sample t test and Wilcoxon signed rank test to assess differences in continuous data. All statistical analysis was performed using R, version 3.2.1 (R Foundation for Statistical Computing). The Johns Hopkins University School of Medicine Institutional Review Board approved this study (NA_00076128).
RESULTS
Description of Participating Facilities and Process Measure Data
From October 2012 to August 2015 (35 months), 51 units from 35 hospitals submitted daily process measures on a total of 72,754 ventilator-days. Of the 840 available unit-months, 325 unit-months (39%) included data for every single day of the month. These unit-months were contributed by 37 units (73%) from 29 hospitals (83%). This subset includes 36,690 ventilator-days. The mean ventilator-days per unit-month was 113 with a standard deviation of 98, ranging from 2 to 435. Characteristics of the hospitals and units included and excluded from this analysis are presented in Table 1. There were no significant differences between these 2 groups.
We found that 110 (34%) of the unit-month 7-day samples included at least 30 ventilator-days and therefore did not require extending the sampling period for the 7 d/m^min30 sample. Amongst 144 unit-months (44%) where the 7-day sample did not include at least 30 ventilator-days, the average number of additional days required to reach 30 ventilator-days was 7. For the 71 unit-months (22%) that did not have 30 ventilator-days in the whole month, all days were included in the sample.
Evaluation of Sampling Strategies
Summary statistics for actual compliance rates and sampling errors are presented in Table 2 (the 1 d/w sample shown in Table 2 is for Tuesdays; results for other days are in Supplementary Appendix A). The 1 d/m sample provided reasonable estimates for Sub-G ETT and HOB, but poor estimates for Oral Care, CHG, SAT, and SBT. The 1 d/w and 7 d/m samples provided better estimates for all 6 processes compared with the 1 d/m sample. There were no significant differences for most process measures as a function of which day per week was selected for sampling. The only exception was for Oral Care, where 1 d/w sampling of Mondays was significantly better than Thursday and Sunday samples in terms of percentage of unit-months with sampling error of 10% or less (75% for Monday vs 67% for Thursday and 67% for Sunday, P=.037). Sampling 7 d/m was only marginally superior to sampling 1 d/w; however, 7 d/m^min30 provided the best estimates. Indeed, for the 7 d/m^min30 sample, we found no significant difference between the mean or median sample rate and the true rate for any of the 6 process measures (paired t tests for mean and Wilcoxon signed rank tests for median, P>.391).
TABLE 2 Summary Statistics of Actual Compliance Rates and Sampling Errors
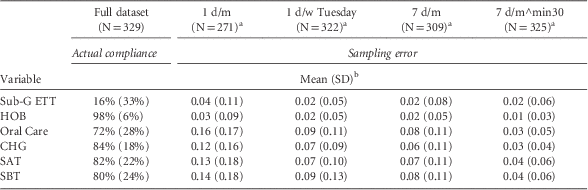
NOTE. CHG, chlorhexidine; HOB, elevating the head of the bed (HOB) ≥30°; SAT, spontaneous awakening trial; SBT, spontaneous breathing trials; Sub-G ETT, subglottic suctioning endotracheal tubes.
a For any unit-month, if a sample drawn from this unit-month has no ventilated patient-days, then this unit-month is removed from the analysis of sampling error, because we do not wish to speculate on how units will take their next sample in this situation. The removal of these unit-months results in a reduced sample size.
b In a sample drawn from a unit-month, if all ventilated patient-days are contraindicated for an intervention component, then the denominator for compliance rate calculation is zero for this specific intervention component. If the actual monthly denominator is zero, then we consider the sampling error as zero. If the actual denominator is greater than zero, then we consider the sampling error from this unit-month as missing for this particular intervention component. It is excluded from the calculation of mean and standard deviation, but included (to be penalized) in the calculation of percentage of unit-months with sampling error ≤5% or ≤10% as a sampling error that is >10%.
Comparing the percentage of unit-months with sampling errors of 5% or less and 10% or less among the 4 sampling strategies (Figure 1 and Figure 2), the 7 d/m^min30 sample remained significantly better than the 1 d/m sample (χ2 tests or Fisher exact tests for small cell numbers, P<.001) and the 7 d/m sample (P≤.003) for all 6 process measures. The 7 d/m^min30 was also significantly better than the 1 d/w sample (P<.001) for HOB, Oral Care, CHG, SAT, and SBT. For Sub-G ETT, however, we found no significant difference between 1 d/w and 7 d/m^min30 (P>.369), presumably because Sub-G ETT was measured at the patient level rather than on the daily level and sampling 1 d/w could lead to the inclusion of more patients than sampling consecutive days for 7 d/m^min30. Despite the high percentage of unit-months with reasonably small sampling errors, large outlying sampling errors were noted. The maximum sampling errors were between 0.32 and 0.58 for the 6 process measures with the 7 d/m^min30 sampling.

FIGURE 1 Percentage of unit-months with sampling error 5% or less. Dots: sample 1 day; bricks: sample 1 day per week (Tuesday); stripes: sample 7 days; gray: sample 7 days with 30 ventilation-days. CHG, chlorhexidine; HOB, elevating the head of the bed (HOB) at least 30°; SAT, spontaneous awakening trial; SBT, spontaneous breathing trials; Sub-G ETT, subglottic suctioning endotracheal tubes.

FIGURE 2 Percentage of unit-months with sampling error 10% or less. Dots: sample 1 day; bricks: sample 1 day per week (Tuesday); stripes: sample 7 days; gray: sample 7 days with 30 ventilation-days. CHG, chlorhexidine; HOB, elevating the head of the bed (HOB) at least 30°; SAT, spontaneous awakening trial; SBT, spontaneous breathing trials; Sub-G ETT, subglottic suctioning endotracheal tubes.
Standard Deviation of Daily Compliance Rates
Distributions of unit-month level standard deviations of daily compliance rates with respect to actual monthly compliance rates, by process measure, are presented in Figure 3. The 75th percentiles of the standard deviations across unit-months are small for Sub-G ETT and HOB (Sub-G ETT, 0; HOB, 0.04), indicating that in most of the 325 unit-months studied, units were either consistently compliant or noncompliant with the intervention on most days, yielding stable daily compliance rates. For Oral Care, CHG, SAT, and SBT, there were a fairly large number of unit-months with large daily compliance rate variation (75th percentiles of the standard deviations: Oral Care, 0.32; CHG, 0.29; SAT, 0.31; SBT, 0.32). The correlation coefficients between mean standard deviation of daily compliance rates and mean sampling accuracy for the 4 sampling strategies are shown in Figure 4. All 4 95% confidence intervals sit entirely below 0, indicating that variation in daily compliance rates has a significantly strong negative correlation with sampling strategy accuracy.

FIGURE 3 Histogram of the variation of unit-months’ daily compliance rates, by process measure. CHG, chlorhexidine; HOB, elevating the head of the bed (HOB) at least 30°; SAT, spontaneous awakening trial; SBT, spontaneous breathing trials; Sub-G ETT, subglottic suctioning endotracheal tubes.

FIGURE 4 Correlation coefficient between mean standard deviation of daily compliance rates and sampling accuracy, sample size=6 (process measures).
DISCUSSION
Using data from the CUSP for MVP: EVAP project, we assessed the accuracy of various sampling schemes to estimate true performance rates. We explored 4 sampling strategies that we felt would be reasonable and straightforward for hospitals to implement (1 d/m, 1 d/w, 7 d/m, and 7 d/m^min30). We found that for large units with at least 30 ventilator-days per month, 7 d/m achieves adequate estimates of monthly process measures, cutting the time required for process measure data collection by 75%. For smaller units with fewer than 30 ventilator-days per week, additional sampling beyond a week may be necessary. Despite the increased number of days of collection, the burden of data collection is still low for these smaller units since it is still limited to 30 or fewer ventilator-days/month. Sampling 1 d/w also provides reasonable estimates although it is a less accurate strategy than sampling 7 d/m.
The accuracy of monthly compliance rate estimates uniformly improved across all interventions with sampling strategies that included larger numbers of ventilator-days. Baseline accuracy (1 d/m) and the degree of improvement in accuracy depended largely on the variation in daily compliance rate for the intervention of interest. For interventions that had uniformly high or low daily compliance rates, HOB elevation and Sub-G ETT, respectively, with little day-to-day variation in daily compliance rate, the 7 d/m^min30 sampling strategy was no better than sampling 1 d/m. On the other hand, for interventions with high variation in day-to-day compliance, the improvement with sampling more ventilator-days per month was significant. Arguably, interventions with high day-to-day compliance variation have the most potential for improvement and subsequent effect on outcomes. Therefore, concentrating effort on increasing sample sizes for these interventions may be warranted.
Taking these considerations into account, we suggest beginning quality improvement initiatives with a preliminary period of daily process measure data collection in order to inform subsequent sampling strategy. If compliance is consistently high for a given process measure, then it should be adequate to employ a minimal sampling strategy such as 1 d/m. If compliance is low or variable, then a more extensive sample strategy would be advisable. For units with fewer than 30 ventilator-days per month, we advise daily data collection because sampling is unlikely to yield accurate results. Our recommendations parallel the assumptions implicit in the National Healthcare Safety Network’s policy of permitting hospitals to estimate central line– and urinary catheter–days using once weekly samples so long as the hospital can demonstrate that sample estimates approximate true population measures.
Advantages of our study include the large number of hospitals included in the analysis, the variety of process measures analyzed, and the evaluation of multiple sampling strategies. By including data from small and large, medical and surgical ICUs, and academic and nonacademic centers, these results may be generalizable to quality improvement projects in a wide range of settings.
Our study has limitations. We did not compare whether sampling a fraction of ventilator-days versus all ventilator-days affects the capacity to use these data to drive performance improvements and changes in outcome measures. We did not audit the day-to-day accuracy of the data collection practices of each site but relied on their own daily compliance reports. For this reason, the sampling errors we studied may be a combination of true sampling errors and differences in data collection practices. It is possible that if staff recognize that data collection is being performed only intermittently that they might selectively improve process measure performance on data-collection days. Sampling strategies may then overestimate true performance rates. Hospitals may therefore need to consider masking staff to when performance data are being collected, conduct additional random audits, or intermittently switch from sampling to complete surveillance. Finally, although there were no apparent differences between facilities with unit-months with 100% daily reporting of process measure data versus those that did not, we did not investigate this thoroughly. It is possible that units with lower reporting rates could have resource limitations that preclude even 7 d/m sampling.
In summary, sampling process measures 1 week per month can generate performance estimates similar to recording process measures daily. From an estimation accuracy perspective, sampling daily data in facilities with low to moderate daily compliance rate variation appears to be a valid, less burdensome approach to process measure data collection. A preliminary period of daily collection is recommended in order to determine an appropriate frequency and volume of sampling required to obtain accurate estimates for all process measures. Until electronic systems that can automatically cull process measure data are more common, manual sampling of process measure data is a viable and less resource-intensive alternative to daily data collection.
ACKNOWLEDGMENTS
We thank staff at the participating facilities who contributed data for this evaluation.
Financial support. The CUSP for VAP: EVAP Project is funded by the AHRQ Action II grant (HHSA29032002T) and National Institutes of Health–VAP grant (R01HL105903). The national VAP prevention initiative is funded by AHRQ Action II grant (HHSA290201000027I). Authors report AHRQ Action II VAP grant (to T.Y., K.S., and S.B.), the National Institutes of Health–VAP grant (to T.Y., K.S., and S.B.), and the AHRQ Action II National VAP grant (to T.Y., K.S., S.B., and M.K.).
Potential conflicts of interest. All authors report no conflicts of interest relevant to this article.
Disclaimer: The findings and conclusions in this document are those of the author(s), who are responsible for its content, and do not necessarily represent the views of AHRQ. No statement in this manuscript should be construed as an official position of AHRQ or of the US Department of Health and Human Services.
SUPPLEMENTARY MATERIAL
To view supplementary material for this article, please visit http://dx.doi.org/10.1017/ice.2016.136


