


INTRODUCTION
Reefs are the most diverse ecosystems among marine environments. One of the factors contributing to this high diversity is the variety of habitats and niches available for different species (Sale, Reference Sale1980). Topographic complexity, under the predation hypothesis, is a possible explanation for fish diversity and richness, by providing refuge against predators (Hixon & Beets, Reference Hixon and Beets1993), modifying competitive interactions and survival rates (Holt, Reference Holt1984; Jones, Reference Jones1988; Syms & Jones, Reference Syms and Jones2000; Gust, Reference Gust2002). On the south-eastern Brazilian coast, rocky shores are the predominant habitat for reef associated organisms (Ferreira et al., Reference Ferreira, Gonçalves and Coutinho2001, Reference Ferreira, Floeter, Gasparini, Joyeux and Ferreira2004; Floeter et al., Reference Floeter, Krohling, Gasparini, Ferreira and Zalmon2007). Ferreira et al. (Reference Ferreira, Gonçalves and Coutinho2001) observed that rocky reefs, compared to coral reefs, still maintain a rich fauna and flora, but show less habitat complexity relying mostly on the presence or absence of holes.
The study of spatial pattern is essential for understanding the causes of the distribution and abundance of organisms (Levin, Reference Levin1992). Understanding reef fish community organization may provide insights for management and conservation (Chittaro, Reference Chittaro2004), and for monitoring their natural and human induced long-term changes (Underwood, Reference Underwood1990). Populations of the same species respond differently, according with local environmental cues, interspecific interactions and dispersal capacity (Genner et al., Reference Genner, Sims, Wearmouth, Southall, Southward, Henderson and Hawkins2004). The south-eastern Brazilian coast is subjected to warm waters of the Brazil Current with coastal upwelling events occurring in summer and spring (Valentin, Reference Valentin1984), which provides an environment of mixed tropical and subtropical elements (Floeter et al., Reference Floeter, Guimarães, Rocha, Ferreira, Rangel and Gasparini2001). Several studies have widely examined the effects of physical parameters on fish community structure (Luckhurst & Luckhurst, Reference Luckhurst and Luckhurst1978; Chabanet et al., Reference Chabanet, Ralambondrainy, Amanieu, Faure and Galzin1997; Ornellas & Coutinho, Reference Ornellas and Coutinho1998; Ferreira et al., Reference Ferreira, Gonçalves and Coutinho2001; Arbuto-Oropeza & Balart, Reference Arbuto-Oropeza and Balart2001). Ferreira et al. (Reference Ferreira, Gonçalves and Coutinho2001) showed that some of the habitat complexity parameters widely used for describing other reef systems (e.g. benthic cover) was not compatible with fish community structure studies on rocky shores within this region.
Efforts in the last decade greatly increased our knowledge about Brazilian reef fish communities (Ferreira & Cava, Reference Ferreira and Cava2001; Ferreira et al., Reference Ferreira, Gonçalves and Coutinho2001, Reference Ferreira, Floeter, Gasparini, Joyeux and Ferreira2004; Floeter et al., Reference Floeter, Guimarães, Rocha, Ferreira, Rangel and Gasparini2001; Rocha & Rosa, Reference Rocha and Rosa2001; Floeter et al., 2004; Floeter et al., Reference Floeter, Krohling, Gasparini, Ferreira and Zalmon2007; Mendonça-Neto et al., Reference Mendonça-Neto, Monteiro-Neto and Moraes2008). Large-scale comparisons suggested that south-eastern rocky reefs show greater diversity than north-eastern coral reefs in the Brazilian coast (Floeter et al., Reference Floeter, Guimarães, Rocha, Ferreira, Rangel and Gasparini2001), and herbivorous fish densities in the western Atlantic decrease from tropical to temperate latitudes (Floeter et al., Reference Floeter, Behrens, Ferreira, Paddack and Horn2005).
Intermediate scales within region comparisons are few in the literature, but such studies may be important to predict geographically distinct communities. Patterns of community structure in the marine environment are strongly influenced by population relationships to biotic and physical gradients (Floeter et al., Reference Floeter, Krohling, Gasparini, Ferreira and Zalmon2007). Chittaro (Reference Chittaro2004) showed that both spatial variation and fish–habitat relationships at the community and population levels are largely independent of the spatial scales from 10 to 200 m2. Nevertheless, considering the dimension of the Brazilian coast with nearly 8000 km, a limited set of scientific work on the ecology and community structure of reef fish is currently available for rocky reef environments. Therefore, new contributions should provide additional information and baseline data for the development of comparative studies and insights about the main ecological units and structuring processes at the local and regional scales.
The main goals of this work are to compare reef fish community structure, composition and distribution patterns between three sites and across levels of physical parameters, such as rugosity, temperature, declivity, depth and visibility. Understanding their effects on communities should improve our ability to predict the outcomes of alternative management strategies for reef fish and their habitats.
MATERIALS AND METHODS
Study sites
This study was conducted at three sites on the coast of Rio de Janeiro state, south-eastern Brazil, in order to compare reef fish communities across levels of environmental variables. (1) Enseada da Pedra Vermelha (PV—22°59′S 41°59′W) is located at Cabo Frio Island, Arraial do Cabo municipality (Figure 1-1). It is within a partial marine protected area (RESEX Arraial de Cabo) where only traditional fishing techniques and historic fish colonies are allowed to use resources. The site is characterized by rocky shores with large boulders ending in a sand bottom. Massive cover of the zoantid Palythoa caribaeorum (Duchassaing & Michelotti, 1861) and meager colonies of the firecoral Millepora alcicornis Linné, 1758 are frequently found. Rocky rubble and sand are present in patches in some areas. (2) Mãe Island (MI—22°98′S 43°06′W) is located within Itaipu Sound, Niterói municipality (Figure 1–2). These shallow rocky shores present a gentle slope and small rocky rubble covering the bottom. Spaces between rocks are small and benthic diversity is relatively low with substrate mostly covered with turf algae. Great loads of mussel shells are observed at the bottom, which is a result of collection by artisanal fishermen. The degree of fishery activities is high, due to its proximity to the coast (~2 km). (3) Comprida Island (CI—23°02′S 43°12′W) is part of the Cagarras Archipelago, Rio de Janeiro, RJ (Figure 1–3). These rocky shores are characterized by large boulders, steep walls and rock rubble at some points, ending on a sandy bottom. This site presents a variety of habitats, where turf, crustose algae and sponges cover most of the substrate. Still, a high benthic diversity is found due to the presence of live brain-coral (e.g. Mussismilia hispida (Verrill, 1901), an endemic species), sea anemones and mussels. Shifts on dominance are observed, where two major habitats are clearly separated. On one side there is a steep wall with high densities of sponges and on the other side there is dominance of the zoantid P. caribaeorum (Villaça, unpublished data).
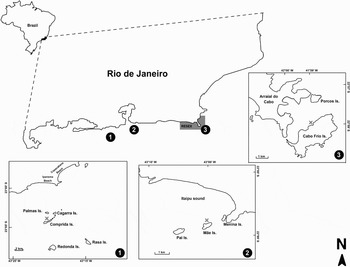
Fig. 1. Map of the study areas: 1, Pedra Vermelha (PV); 2, Mãe Island (MI); 3, Comprida Island (CI). Grey area represents the RESEX of Arraial do Cabo, a partial Marine Protected Area.

Fig. 2. Density (mean±SE) of ten more abundant species. PV, Pedra Vermelha; MI, Mãe Island; CI, Comprida Island.

Fig. 3. Relative abundance of fish trophic groups within the study localities. PV, Pedra Vermelha; MI, Mãe Island; CI, Comprida Island; HER, herbivores; PLK, planktivores; MIF, mobile invertebrate feeders; OMN, omnivores; SIF, sessile invertebrate feeders; CAR, carnivores.
Physical parameters
Transects were laid haphazardly, always in the sheltered sides of the sites to reduce differences related to prevailing winds and wave exposure. Rugosity of the substrate was obtained using an adaptation of the chain-link method (Luckhurst & Luckhurst, Reference Luckhurst and Luckhurst1978), which provided a comparative index (r). Shore slope was derived from the trigonometric relationship sinα = opposite site (a) hypotenuse (b), where α, is the angle of the shore slope, ‘a’ is depth, since transects were performed from surface to bottom, and ‘b’ is the transect length. The slope angle was then obtained from the appropriate trigonometric tables. Depth was also recorded from the pressure gauge in the diving console. Horizontal visibility was obtained by measuring the maximum distance from which a white PVC plate was visible (Dominici-Arosemena et al., Reference Dominici-Arosemena, Brugnoli-Oliveira, Cortés-Núnez, Molina-Ureña and Quesada-Alpizar2005). Temperature was recorded for each sample with a mercury thermometer. Tide range for each sampling day was obtained from the tide tables available at the ‘Departamento de Hidrografia e Navegação—DHN’ website (www.dhn.mar.mil.br).
Fish community data
Underwater visual censuses (12 replicates per site; N = 36) were conducted between May and December 2005. All sites were sampled during the overall period in order to avoid different time effect among sites. Occurrence and abundance of fish species were recorded using the strip-transect method. In this work, transects were laid perpendicular to the shore, from the sand–rock interface towards the surface, covering all depths. Transect lengths varied according to depth and shore slope. In this manner, abundance data were later converted into density (fish/m2) to minimize differences between transects of different lengths.
Fish were counted within 2 m (1 m to each side of the observer) (Ferreira et al., Reference Ferreira, Gonçalves and Coutinho2001) and recorded as a six-letter code (e.g. DIPARG: Diplodus argenteus). Censuses followed a predetermined sequence counting vagile species first, and criptobenthic and sedentary species, with intensive search, on a second pass over the transect. The same diver conducted all counting to avoid bias related to different experience levels (Williams et al., Reference Williams, Walsh, Tissot and Hallacher2006).
Fish were grouped into major trophic categories following Ferreira et al. (Reference Ferreira, Floeter, Gasparini, Joyeux and Ferreira2004) and Floeter et al. (Reference Floeter, Behrens, Ferreira, Paddack and Horn2005) (see Appendix). Inclusion of species in categories was based on the available information from the literature (Randall, Reference Randall1967; Ferreira et al., Reference Ferreira, Floeter, Gasparini, Joyeux and Ferreira2004).
Statistical analysis
One-way analysis of variance was used to compare total fish density and environmental factors (rugosity, shore slope, water temperature, depth, visibility and tide range) between study sites (PV, MI and CI). A post hoc Student–Newman–Keuls (SNK) multiple comparison test was used to separate significantly different means. Data were log-transformed (log (density+1)) to satisfy ANOVA assumptions. A post hoc power analysis was conducted to assess whether the ANOVA test had a fair chance to reject an incorrect Ho (Cohen, Reference Cohen1988). Effect size was set to 0.4 (sensu lato Cohen, Reference Cohen1988), defining the minimum degree of violation of Ho a researcher would like to detect with a probability not less than (1-ß) (Smith & Bayen, Reference Smith and Bayen2005). The post hoc power analysis for the one-way ANOVA, with α = 0.05 was in the range of 0.52. Tests were performed using STATISTICA 6.0 software (Statsoft, Inc.), and G*Power 3 (Erdfelder et al., Reference Erdfelder, Faul and Buchner1996; Faul et al., in press).
To assess the similarity patterns between samples and the formation of meaningful groups, non-metric multidimensional scaling ordination (nMDS) was performed. Species present in over 50% of samples were excluded from the matrix. This manoeuvre is used to decrease the value of stress considerably with no interference on the data spatial distribution pattern (J. L. Valentim, personal communication). Bray–Curtis dissimilarity was used to build the similarity matrix. Data were log-transformed.
A one-way analysis of similarity (ANOSIM), using the same data matrix, was performed to test for significant differences between groups formed in the previous analysis (Clarke, Reference Clarke1993). Both analyses were conducted using PRIMER 5.0 software (Clarke & Warwick, Reference Clarke and Warwick2001).
Fish community and habitat relationships were analysed with canonical correspondence analysis (CCA) ordination. This analysis is a powerful technique used to understand how multiple species respond simultaneously to environmental factors, extracting significant gradients from ecological matrices (Ter Braak, Reference Ter Braak, Jongman, ter Braak and van Tongeren1987). Significant environmental parameters were selected with the Monte Carlo permutation test (999 permutations). Species present in less than 8% of the samples were excluded to avoid noise. Data were log-transformed and the CANOCO for Windows 4.0 software was used for this analysis.
RESULTS
Environmental factors
Higher rugosity values were found at MI, where smaller boulders were present. Visibility was significantly higher and slopes steeper at the PV and CI sites. Also, CI transects were deeper whereas MI transects were shallower. Temperature and tide-range were not significantly different between sites (Table 1). The range of area covered by transects for each site was 30–68, 28–70 and 36–70 m2, for PV, MI and CI, respectively. Nevertheless, differences between sampled areas in studied sites were not significant (F = 2.228; P = 0,124), which allowed a comparison.
Table 1. Environmental factors (mean±SE) and the one-way ANOVA results among localities (PV, Pedra Vermelha; MI, Mãe Island; CI, Comprida Island ).

* P < 0.05; **P < 0.01; ns, non significant.
Fish composition and trophic structure
Thirty-six visual censuses yielded sightings of 4236 fish belonging to 34 families and 67 species. The five most representative families in terms of relative abundance and number of species were Pomacentridae (30%, 6), Haemulidae (16%, 4), Monacanthidae (13%, 2), Sparidae (12%, 2) and Labridae (6%, 7). Together, they comprised three-quarters of all fish counted. Sixty-seven per cent of the fish species recorded in the three sites showed western Atlantic distribution, of which 13.5% are endemic to the Brazilian Province. At least 40% of all species recorded were shared between the three sites.
Total fish density varied significantly between sites (F = 3.9044; P = 0.03*), but post hoc comparisons were not able to separate means. Ten species showing the highest densities were detected at all sites: Abudefduf saxatilis (Linnaeus, 1758) (0.31 fish/m2), Stegastes fuscus (Cuvier, 1830) (0.29 fish/m2), Stephanolepis hispidus (Linnaeus, 1766) (0.28 fish/m2), Haemulon aurolineatum Cuvier, 1830 (0.28 fish/m2), Diplodus argenteus (Valenciennes 1830) (0.25 fish/m2), Halichoeres poeyi (Steindachner, 1867) (0.13 fish/m2), Chromis multilineata (Guichenot, 1853) (0.08 fish/m2), Stegastes pictus (Castelnau, 1855) (0.07 fish/m2), Labrisomus nuchipinnis (Quoy & Gaimard, 1824) (0.05 fish/m2) and Chaetodon striatus Linnaeus, 1758 (0.04 fish/m2). Nevertheless, S. fuscus predominated at PV and was nearly absent at the MI and CI sites. Abudefduf saxatilis and H. aurolineatum dominated at MI, and S. hispidus and D. argenteus at CI. Figure 2 shows the density distribution of these species at each site.
Mobile invertebrate feeders, mostly represented by H. aurolineatum and omnivores (S. hispidus, D. argenteus and A. saxatilis) predominated in all localities, but dominance patterns were reversed for MI as compared with PV and CI (Figure 3). Nevertheless herbivores (mostly territorial Stegastes spp.) were found at high relative abundances at PV. Planktivores, carnivores and sessile invertebrate feeders occurred in low numbers in the three sites.
Relationship between fish community and physical parameters
Non-metric multidimensional scaling analysis presented in Figure 4 showed three distinct sample groups. Group 1 included samples from MI, group 2 from PV and group 3 from CI. The low stress value indicated that the observed sample distribution in the two dimensional space provided a reliable interpretation of the differences between fish community structure at the study sites. One-way ANOSIM corroborated the formation of these groups, with minimal degree of overlap (global R = 0.727; P = 0.001).

Fig. 4. NMDS analysis within study sites: PV, Pedra Vermelha; MI, Mãe Island; CI, Comprida Island.
Figure 5 shows the CCA ordination diagram with significant environmental variables represented by arrows, species by six-letter codes, and samples by symbols. The first two axes were significant (P = 0.001) and accounted respectively for 42.1% and 34.5% of the variance between samples, species and variables. The first axis was positively related to shallow water, rugged, low visibility and gentle slope habitats. This axis clearly represented MI samples and mostly small site-attached species such as Parablennius pilicornis (Cuvier, 1829), Scartella cristata (Linnaeus, 1758), P. marmoreus, Labrisomus nuchipinnis, Stegastes variabilis, Pareques acuminatus (Bloch & Schneider, 1801) and Mycteroperca acutirostris (Valenciennes, 1828). Axis 2 was positively associated with steep slopes, and negatively associated with depth and water visibility. This axis represented mostly PV and CI samples, comprising greatest richness and highest density of vagile species such as Acanthurus chirurgus (Bloch, 1787), Bodianus pulchellus (Poey, 1860), Balistes Vetula Linnaeus 1758, Acanthurus Bahianus Castelnau, 1855, Holocentrus adscencionis (Osbeck, 1765) and D. argenteus. PV samples also showed higher densities of sand-bottom associated species (Synodus synodus (Linnaeus, 1758), Dactylopterus volitans, Serranus baldwini (Evermann and Marsh, 1899) and Coryphopterus glaucofraenum Gill, 1863), mostly due to the presence of sand patches in this site. Species located in the centre of the plot had similar abundances in the studied sites, and showed little contribution for the CCA.

Fig. 5. Canonical correspondence analysis (CCA) ordination. Species are represented by six-letter codes.
DISCUSSION
This work yielded a total of 67 species recorded at three different sites on the coast of Rio de Janeiro state. This number is considerably low when compared with other reef fish community studies conducted in localities near the studied sites. Probably, most differences were related to sampling effort and visual census methodology used in our work, since most reef fish species recorded showed a broad western Atlantic distribution. Such species are common in coastal rocky reefs, islands and mangroves. This was previously observed by Floeter et al. (Reference Floeter, Guimarães, Rocha, Ferreira, Rangel and Gasparini2001) in a comprehensive study of the Brazilian coast.
Ferreira et al. (Reference Ferreira, Gonçalves and Coutinho2001) recorded more than 91 species at Arraial do Cabo over one year of weekly sampling. Mendonça-Neto (unpublished data) recorded 42 species after one year of transect sampling in three islands of Itaipu Sound. Rangel et al. (Reference Rangel, Chaves and Monteiro-Neto2007) produced a list of 99 species at the Cagarras Archipelago using transect and rover diver sampling. Our study aimed to evaluate differences in species assemblages on three defined sites, whereas others usually addressed broader objectives within a wider studied area and time span. Also, our transects followed the depth gradient over the rocky reef, whereas other studies followed the depth stratified horizontal transect methodology.
Species dominance patterns were nearly the same, but species ranks changed between sites. These differences were also reflected on trophic groups. High densities of Stegastes fuscus representing 90% of the total of herbivores, were found at PV. Ferreira et al. (Reference Ferreira, Gonçalves and Coutinho2001) reported similar findings in the region. At MI and CI, S. fuscus showed very low abundances. According to Ceccarelli (Reference Ceccarelli2004), farmer herbivores densities could be affected by abundance of large schools of roving herbivores, which was found only in IC, but such a conclusion needs further studies addressing this question.
Omnivores Abudefduf saxatilis, Stephanolepis hispidus and Diplodus argenteus, and the mobile invertebrate feeder Haemulon aurolineatum predominated at MI and CI, a pattern previously observed in other studies in subtropical Brazilian waters (Ferreira et al., Reference Ferreira, Floeter, Gasparini, Joyeux and Ferreira2004). Dominance of these groups in higher latitudes may be associated with the better use of low-quality food (Harmelin-Vivien, Reference Harmelin-Vivien and Sale2002).
Large predators are expected to be less frequent, but their large sizes compensate the low abundance, representing a large portion of fish biomass (Rocha & Rosa, Reference Rocha and Rosa2001). This was previously found at Arraial do Cabo, RJ (Ferreira et al., Reference Ferreira, Gonçalves and Coutinho2001). Nevertheless, in some cases, intensive fishing over target mobile top predators, may be responsible for their low abundances. The presence of the small sized carnivore Labrisomus nuchipinnis at MI may be further evidence that fisheries have removed top predators. In fact, Turbino et al. (Reference Turbino, Monteiro-Neto, Moraes and Paes2007) suggested that the proximity to the coast magnifies fisheries impacts at the islands within Itaipu Sound, including MI. Many of the species recorded in this work were present in the local artisanal fisheries landings at Itaipu, but the scarcity of top predators (snappers and groupers) was striking.
Topographic complexity along with other habitat variables played an important role in structuring fish communities at the studied sites, but its contribution had a lesser importance than the others. Sale (Reference Sale and Sale1991) observed that fish communities are not predictable for every location, as structuring factors may differ in their relative importance from one location to another. For instance, recent studies (Ferreira et al., Reference Ferreira, Gonçalves and Coutinho2001; Gratwicke & Speight, Reference Gratwicke and Speight2005) showed that other physical parameters instead of rugosity were of greater importance for structuring reef fish communities, as opposed to previous studies (Bell & Galzin, Reference Bell and Galzin1984; Charton & Ruzafa, Reference Charton and Ruzafa1998).
Each site showed distinct features regarding total fish composition and diversity, despite the fact that they lay within a narrow latitudinal range, and shared similar environmental characteristics. A higher diversity at CI could be associated with the larger sampled area in this site. The positive relationship between diversity and reef size was previously observed by Galzin et al. (Reference Galzin, Planes, Dufour and Salvat1994). Nevertheless, fish density in this locality was surprisingly low. PV was the smallest sampled area but presented the highest fish density, possibly due to the fact that the area is a marine sanctuary, providing species refuge and protection. Future studies comprising the effects of oceanographic features on larval dispersion and recruitment should explain such findings.
Our work showed that habitat partitioning was partly explained by the studied environmental variables at each site. Also, the results showed that fish communities of these sites presented similarities mostly for the ubiquitous groups with wide distribution ranges, but not for all species. Some species were associated to shallower habitats with higher rugosity such as those at MI. Such habitats may provide species protection against potential predators (Willis & Anderson, Reference Willis and Anderson2003). Most of them are small, site-attached and habitat-specialist fish such as blennies, often underestimated on visual census (Sale & Douglas, Reference Sale and Douglas1981; Brock, Reference Brock1982; Bellwood & Alcala, Reference Bellwood and Alcala1988; Ackerman & Bellwood, Reference Ackerman and Bellwood2000). Also, the great amount of organic matter and detritus available from the Guanabara Bay (van Weerelt, personal communication) could provide additional food sources for the success of blennies at this site (Wilson, Reference Wilson2001, Reference Wilson2002).
Other species were associated to clear, deeper waters or to sandy-patches, such as Serranus baldwini and Coryphopterus glaucofraenum found at CI and PV, respectively. Some species with wider range of distribution along the reef were observed in deeper waters such as Bodianus pulchellus found in our work and a similar pattern was observed by Ferreira et al. (Reference Ferreira, Gonçalves and Coutinho2001). According to Letourneur et al. (Reference Letourneur, Ruitton and Sartoretto2003), deeper sites present more niches to be explored and can aggregate a wider range of species.
Differences among vicinal coastal islands were defined in this work through several physical parameters of each selected site, such as rugosity, depth, declivity and visibility. This suggests that rugosity works synergistically with other factors, which are extremely important for the fish community structure in rocky reefs.
Logistical limitations prevented us from obtaining more replica within sites as expected. Sampling on reefs usually relies on 10 to 20 samples, depending on the number of sites and the size of transects (Chittaro, Reference Chittaro2004). Our significant results suggested that differences between sites exist, but we could not draw any further conclusions regarding group means, especially for species densities. Problems may have arisen because our experimental design had a 50% chance of type II error, especially for non-significant findings. Despite these limitations, our results may be taken as exploratory, suggesting regional patterns of distribution, abundance and diversity of reef fish between separate sites in south-eastern Brazil.
ACKNOWLEDGEMENTS
We thank the ‘Instituto de Estudos do Mar Almirante Paulo Moreira—IEAPM, Ministerio da Marinha’ for their logistic support during diving operations at Arraial do Cabo and Tempo de Fundo Atividades Subaquáticas together with Instituto Ecomama for the partnership which helped on diving operations at the Cagarras Archipelago. Many people provided support during several parts of this work. We especially thank José Policarpo de Mendonça Neto and Carlos Augusto Rangel for their help with underwater fish identification in the first stages of this work. We also thank Dr Beatrice Padovani Ferreira and Dr Carlos Eduardo L. Ferreira for comments, two anonymous referees for manuscript revision and Silvio Ribeiro for map drawings. CAPES and CNPq provided fellowships for the authors during the course of this work.
Appendix
Checklist of species. Density (mean±SE), total number of specimens (n) and relative abundance (%) of individuals per species at Pedra Vermelha (PV), Mãe Island (MI) and Comprida Island (CI).


