


1. Introduction
Most accretionary wedges and fold–thrust belts form under different tectonic shortening regimes during mountain-building processes. Although the shortening velocity may vary during geological times, recent GPS work suggests that the velocity commonly varies from 0.5–1.5 mm a–1 in the Pyrenees to as much as 30–45 mm a–1 in the Himalaya (Wang et al. Reference Wang, Zhang, Freymueller, Bilham, Larson, Lai, You, Niu, Wu, Li, Liu, Yang and Chen2001; Cloetingh, Ziegler & Bogaard, Reference Cloetingh, Ziegler and Bogaard2007; Hatzfeld & Molnar, Reference Hatzfeld and Monlar2010; Asensio et al. Reference Asensio, Khazaradze, Echeverria, King and Vilajosana2012). The geometry and kinematics are distinctly various, and strongly depend upon the interactions of tectonics, climate and near-surface processes (e.g. Beaumont, Fullsack & Hamilton, Reference Beaumont, Fullsack and Hamilton1994; Willett, Reference Willett1999; Cloetingh, Ziegler & Bogaard, Reference Cloetingh, Ziegler and Bogaard2007). Furthermore, the scaled analogue models indicate that the geometry and kinematics of accretionary wedges are strongly influenced by the basement and deforming material properties, backstop and surface processes (Davis, Suppe & Dahlen, Reference Davis, Suppe and Dahlen1983; Dahlen, Reference Dahlen1990; Paola et al. Reference Paola, Staub, Mohrig and Reinhardt2009; Graveleau, Malavieille & Dominguez, Reference Graveleau, Malavieille and Dominguez2012).
In analogue models the wedge material used is quartz sand, characterized with a linear pressure-dependent Navier–Coulomb failure criterion. It is commonly interpreted with an envelope essentially independent of strain rate (or rate-independent) at the upper crustal level (Davis, Suppe & Dahlen, Reference Davis, Suppe and Dahlen1983; Sonder & England, Reference Sonder and England1986). Although some studies of sandbox modelling are based on brittle and ductile rheological material simultaneously, those experiments suggest a sensitivity of the accretionary wedges to strain rate (Rossetti et al. Reference Rossetti, Faccenna, Ranall and Storti2000, Reference Rossetti, Faccenna and Ranall2002; Gutscher et al. Reference Gutscher, Klaeschen, Flueh and Malavieille2001; Bonini, Reference Bonini2001; Smit, Brun & Soukoutis, Reference Smit, Brun and Soukoutis2003), as well as in the purely brittle wedge (Mulugeta & Koyi, Reference Mulugeta and Koyi1987, Reference Mulugeta and Koyi1992; Koyi, Reference Koyi1995; Reiter, Kukowski & Ratschbacher, Reference Reiter, Kukowski and Ratschbacher2011). The geometry and kinematics of an accretionary wedge is therefore influenced by rheological properties of the accreted material, the basal friction and the shortening velocity (Liu, McClay & Powell, Reference Liu, McClay, Powell and McClay1992; Rossetti et al. Reference Rossetti, Faccenna and Ranall2002; Lohrmann et al. Reference Lohrmann, Kukowski, Adam and Oncken2003). It suggests a steeper wedge slope and a narrower deformed zone of accretionary wedge at a fast velocity of shortening than a low velocity. The shortening velocity in the evolution of the accretionary wedge remains the subject of debate, in particular the purely brittle wedge (Mulugeta & Koyi, Reference Mulugeta and Koyi1987; Gutscher et al. Reference Gutscher, Klaeschen, Flueh and Malavieille2001; Bonini, Reference Bonini2001; Smit, Brun & Soukoutis, Reference Smit, Brun and Soukoutis2003). In this study, we conducted a series of analogue models shortened with various shortening velocities (0.001–0.5 mm s–1) to study the influence of shortening velocity on the geometry and kinematics of accretionary wedges.
2. Model set-up
In the ten models presented here we have used the same type of dry quartz sand for all purely brittle analogue models, but varied the shortening velocity (Fig. 1). The experiments were performed in the analogue modelling laboratory at State Key Laboratory of Oil and Gas Reservoir Geology and Exploitation at Chengdu University of Technology. Analogue models were constructed in glass-walled containers, with dimensions 800–1500 mm in length and 340–680 mm in width. To reduce the amount of friction, the glass walls were lubricated beforehand. Moderately well-rounded, well-sorted dry quartz sand was mechanically sieved into the deformation apparatus to form an initial sand pack with dimensions 800×340×350 mm (Fig. 1). A c. 1 mm layer of coloured quartz sand was used as a marker in the experiments. The quartz sand used had an average grain size of 0.2–0.4 mm, a bulk density of 1.55 g cm–3, an angle of internal friction of 29–31° and an internal coefficient of friction of c. 0.58. This sand has a linear Navier–Coulomb behaviour at failure and is nearly cohesionless, displaying a low apparent cohesive strength at low stresses as a result of surface roughness effects (McClay, Reference McClay1990; Schellart, Reference Schellart2000; Lohrmann et al. Reference Lohrmann, Kukowski, Adam and Oncken2003). It provides a good approximation for scaled model experiments of large-scale brittle deformation in the upper c. 10 km of the crust (e.g. Davis, Suppe & Dahlen, Reference Davis, Suppe and Dahlen1983; Storti & McClay, Reference Storti and McClay1995; McClay & Whitehouse, Reference McClay, Whitehouse and McClay2004). Our length scaling and time scaling factors are c. 10−6 and 10−4–10−5, respectively (Table 1; e.g. Koyi & Vendeville, Reference Koyi and Vendeville2003; Cruz et al. Reference Cruz, Teyssier, Perg, Take and Fayon2008).

Figure 1. (a) Diagram of the experimental apparatus. (b) Interpreted fold–thrust wedge showing the parameters measured in the experiment.
Table 1. Physical parameters used in this study and scaling factors between nature (N) and model (M).

Note: Displacement rate: Pyrenees, Asensio et al. (Reference Asensio, Khazaradze, Echeverria, King and Vilajosana2012); Jura, Walpersdorf et al. (Reference Walpersdorf, Baize, Calais, Tregoning and Nocquet2006); Apennines, Hatzfeld & Molnar (Reference Hatzfeld and Monlar2010); Zagros, Hessami, Nilforoushan & Talbot (Reference Hessami, Nilforoushan and Talbot2006); Himalaya, Hatzfeld & Molnar (Reference Hatzfeld and Monlar2010), Wang et al. (Reference Wang, Zhang, Freymueller, Bilham, Larson, Lai, You, Niu, Wu, Li, Liu, Yang and Chen2001); and Taiwan, Yu, Chen & Kuo (Reference Yu, Chen and Kuo1997).
The cohesion of natural crustal rocks can be scaled by calculating the stress ratio for gravity stresses. The stress ratio, defined σ*=ρ*l*g* where the scaling ratio for density, length and gravity are denoted ρ*, l* and g*, respectively, is 3.23×10⁻⁶, and the cohesion in the analogue model must fall within the range 3.3–33 Pa, given the value of shear strength of natural crustal rocks ranging over 1–20 MPa (Hoshino et al. Reference Hoshino, Koide, Inami, Iwamura and Mitsui1972; Goodman, Reference Goodman1988). Such a scaling approach is commonly used for sandbox simulations under normal gravity conditions (e.g. Rossetti et al. Reference Rossetti, Faccenna, Ranall and Storti2000; McClay & Whitehouse, Reference McClay, Whitehouse and McClay2004; Koyi & Vendeville, Reference Koyi and Vendeville2003; Lohrmann et al. Reference Lohrmann, Kukowski, Adam and Oncken2003). It should be noted that there is no significant bias of frictional sidewall effect in our experiments, as the ratio of the area of contact of the sand body with the glass sidewalls to its area of contact with the basement remains 0.05–0.1 (Souloumiac, Maillot & Leroy, Reference Souloumiac, Maillot and Leroy2012).
Sand models were deformed by moving a vertical rigid wall from the right side of the box at a constant velocity. The incremental deformation was photographically recorded using time-lapse photography at every 1.0 mm of shortening. Using a graphic software package, a set of parameters was symmetrically measured at 10 mm intervals to describe the evolution of the wedge. The terminology adopted for the description of the sandbox models follows McClay & Whitehouse (Reference McClay, Whitehouse and McClay2004). Table 2 summarizes the main parameters and results for the ten models presented, including the wedge height, wedge length, prowedge slope angle, and angle and displacement of the fault. We used the PIV system (particle imaging velocimetry) to quantify the velocity/displacement field and investigate the quartz sand pack deformation processes (Fig. 1), which provided high-resolution displacement measurements of the evolution of the patterns of progressive deformation in our models (e.g. Adam et al. Reference Adam, Urai, Wieneke, Oncken, Pfeiffer, Kukowski, Lohrmann, Hoth, Van der zee and Schmatzm2005; Hoth et al. Reference Hoth, Adam, Kukowski, Oncken, Willett, Hovius, Brandon and Fisher2006; Contardo et al. Reference Contardo, Kukowski and Cembrano2011). In our models the corresponding displacement is computed by cross-correlation from the sand particle pattern in successive images with a time lapse of 6–3000 s and a constant shortening distance of c. 3 mm.
Table 2. Summary of experimental parameters and results of experiment series.

Our experiments used ten time-change velocities over the range 0.001–0.5 mm s–1 in three set experiments (Table 1) as follows: (1) more than 100 times change in recent GPS velocity along the Himalaya to the Pyrenees; and (2) substantial changes in shortening rate which would probably enlarge the differential deformation model of an isotropic layer of quartz sand with a consistent boundary (Mulugeta & Koyi, Reference Mulugeta and Koyi1987; Mulugeta, Reference Mulugeta1988; Marshak & Wilkerson, Reference Marshak and Wilkerson1992; Gutscher et al. Reference Gutscher, Klaeschen, Flueh and Malavieille2001; Rossetti et al. Reference Rossetti, Faccenna and Ranall2002; Cubas, Maillot & Barnes, Reference Cubas, Maillot and Barnes2010). The first set of experiments is characterized by low velocities of 0.001, 0.002 and 0.005 mm s–1 (e.g. Bonini, Reference Bonini2001; Costa & Vendeville, Reference Costa and Vendeville2002; Smit, Brun & Soukoutis, Reference Smit, Brun and Soukoutis2003; Nilforoushan et al. Reference Nilforoushan, Koyi, Swantesson and Talbot2008); the second set is characterized by medium velocities of 0.01 and 0.05 mm s–1 (e.g. Rossetti et al. Reference Rossetti, Faccenna and Ranall2002; Cruz et al. Reference Cruz, Teyssier, Perg, Take and Fayon2008); and the third set is characterized by high velocities of 0.1, 0.2, 0.3, 0.4 and 0.5 mm s–1 (e.g. Marshak & Wilkerson, Reference Marshak and Wilkerson1992; Gutscher et al. Reference Gutscher, Klaeschen, Flueh and Malavieille2001; Hoth, Hoffmann-Rothe & Kukowski, Reference Hoth, Hoffmann-Rothe and Kukowski2007; Cubas, Maillot & Barnes, Reference Cubas, Maillot and Barnes2010). All experiments continued at a constant shortening magnitude of 300 mm (c. 38% shortening) for different time durations (0.2–100 h). In each experiment, models were reproduced at least twice to validate reproducibility. However, it should be noted that boundary effects, the different heights to which sand is deposited in models and many other parameters could affect the reproducibility of our results (e.g. Cubas, Maillot & Barnes, Reference Cubas, Maillot and Barnes2010; Souloumiac, Maillot & Leroy, Reference Souloumiac, Maillot and Leroy2012).
3. Experimental results
3.a. Low velocity
The geometric evolution and relative displacement vectors of the experiment are shown in Figure 2, with a velocity of 0.002 mm s–1. In this model, the initial 20 mm of shortening formed a foreland-vergent thrust together with a back thrust and its associated flat-topped pop-up structure, as a symmetric anticline indicated by a triangular-shaped displacement vector area with uplift-related displacement (Fig. 2a). Where there are distinct changes of displacement vectors, it indicates strain localization and active shear along thrusts (Adam et al. Reference Adam, Urai, Wieneke, Oncken, Pfeiffer, Kukowski, Lohrmann, Hoth, Van der zee and Schmatzm2005). A new foreland-vergent thrust nucleated with increased shortening. It accommodated a triangular-shaped displacement-vector area with uplift-related displacement, centred above the velocity discontinuity at 60 mm shortening (Fig. 2c). At 110 mm shortening, three well-developed closely spaced in-sequence imbricate thrusts nucleated at the velocity discontinuity, forming a triangular and horizontal displacement-vector area (i.e. the high-value displacement-vector area). This indicates an internal backstop (i.e. the axial zone) to allow forward-breaking thrust faults to nucleate. In this manner, the wedge was rapidly uplifted until it reached a critical wedge height (H c) of 72 mm at 110 mm of shortening. From this point onwards, the displacement along the previously active thrusts stopped and a distributed strain belt occurred in the frontal zone (i.e. the prowedge) (Fig. 2d). At 120 mm shortening, a new symmetric pop-up structure formed, with two triangular displacement-vector areas (Fig. 2e). The left is dominated by horizontal displacement vectors to propagate shortening and deformation; the right is dominated by uplift-related displacement vectors marking the new pop-up structure.

Figure 2. Low-velocity shortening experiment, an accretionary wedge with 0.002 mm s–1 shortening velocity. (a–i) Sequential photographs showing the structural evolution of accretionary wedge. Particle trajectories and velocities derived from the interval vector fields are consistent with the right area of accretionary wedge shown by red-dot box. (j) Interpretation of the final geometry of the 0.002 mm s–1 low-velocity shortening model. Thrusts and associated fold structures that subsequently developed are labelled in order of their formation. The fault displacement accommodated by each thrust is marked by an initial steep phase followed by a long period of quiescence.
With increased shortening the displacement along T4 substantially increased with nucleation of three back thrusts, and resulted in the previous thrust T3 being buried as a blinded fault. The thrust T4 reached its maximum displacement of 55.0 mm at 240 mm shortening, accompanied by substantial back-rotation of previous thrusts even to overturn thrusts T1 and T3 (Fig. 2g). The internal thrusts appeared to join thrust T1 at the base of the model, and apparent semi-flower structure geometry was observed (Fig. 2g, j). With increased shortening, the previously active faults stopped and a distributed strain belt occurred again, until a new foreland-vergent thrust T5 and its associated symmetric pop-up structure formed at 250 mm shortening (Fig. 2i). Until the final shortening, two new closely spaced back thrusts formed in the hanging wall from the region where the main thrust T5 propagated upwards (Fig. 2i). The wedge is characterized with slope angle of c. 10° and height and length of 87 mm and 274 mm, respectively.
Figure 3 depicts plots of wedge geometries (i.e. the height and length) and wedge slope angles measured during the evolution of three low-velocity shortening models (L1–L3), all showing consistency in evolution and kinematics of the wedge. The wedge grows rapidly both in height and length with progressive shortening, until the critical wedge height and angle are attained at 110–120 mm. The growth of the wedge is self-similar or quasi-stable after this point. At a later stage of the deformation, however, the growth in wedge height persists but at a slower rate. There were sharp jumps in the wedge length that reflect the nucleation of each new foreland-vergent thrust. The subsequent decrease in length prior to the development of the next new thrust indicates internal shortening within the wedge. In particular, each nucleation of new thrust post-dates an occurrence of distributed strain in the frontal zone. It implies that, for the wedge to overcome the basal and internal friction, it undergoes thickening with layer-parallel shortening until it again reaches a critical wedge slope that can overcome the friction, bringing about the localized strain along the thrust faults. In the three models, there is an increase in the wedge length and wedge slope angle with increased shortening velocity from 0.001 mm s–1 to 0.005 mm s–1, and a decrease in shortening to attain the critical wedge height and tape angle (Fig. 3).

Figure 3. Plot of geometries (i.e. the wedge slope angle, length and height) of accretionary wedge versus shortening displacement under 0.001 mm s–1, 0.002 mm s–1 and 0.005 mm s–1 shortening velocities. The wedge geometries show roughly increased wedge length and height with increasing shortening velocities. The length increases episodically with the formation of new thrust in each model; however, angle and height remain roughly constant after attaining a critical wedge.
3.b. Medium velocity
The geometric evolution and relative displacement vectors of a model with velocity of 0.05 mm s–1 (M2) are shown in Figure 4. The wedge geometries and wedge slope angles of both medium-velocity models (M1 has a velocity of 0.01 mm s–1) are shown in Figure 5.

Figure 4. Medium-velocity shortening experiment, an accretionary wedge with 0.05 mm s–1 shortening velocity. (a–h) Sequential photographs with particle trajectories and velocities showing the structural evolution of the accretionary wedge. (i) Interpretation of the final geometry of the 0.05 mm s–1 medium-velocity shortening model. The fault displacement accommodated by each thrust is marked by an initial steep phase followed by a long period of quiescence.

Figure 5. Plot of geometries of accretionary wedge versus shortening displacement under 0.01 mm s–1 and 0.05 mm s–1 shortening velocities. The wedge geometries show roughly increased wedge length and height with increasing shortening velocities.
The model wedge grows rapidly both in height and length with progressive shortening at the early stage, until a critical wedge height of 71 mm and a critical slope angle of c. 11° were attained at c. 100 mm shortening. At 25 mm of shortening, initial deformation was characterized by the development of a flat-topped, symmetric pop-up anticline. The uplift-related displacement vectors indicate that the deformation in the wedge is concentrated in the hanging wall of thrusts (Fig. 4a). With increased shortening, three well-developed in-sequence imbricate thrusts nucleated and formed an internal backstop, dominated by horizontal displacement vectors at 100 mm shortening. Due to the strain accumulation with distributed deformation, much of the layer-parallel shortening occurred in the prowedge (Fig. 4c).
At the stage of self-similar growth, the growth in the wedge geometries is characterized by a slower rate. The displacement along the previously active thrusts (i.e. thrusts T1, T2 and T3) has stopped, and new thrust T4 and its associated flat-topped pop-up structure are active at 110 mm shortening (Fig. 4d). The progressive shortening resulted in reactivation of thrust T3 and progressive backward tilting of thrust T2 at 140 mm shortening (Fig. 4e, i). At 240 mm shortening, the model accommodated the third flat-topped, symmetric pop-up anticline and thrust T5, after a certain strain accumulation with distributed deformation. The displacement vectors are dominated by horizontal displacement in the hinterland of the wedge and an uplift-related displacement in the new pop-up structure. Furthermore, displacement vectors suggest that similar strain accumulation occurred in a segment of width >150 mm in the frontal zone of the wedge, at c. 100 mm and 230 mm of shortening (Fig. 4c, f). This set of experiments was stopped at 300 mm shortening, with a final wedge height and length of 93 mm and 268 mm, respectively.
It should be noted that there is an increase in the wedge length and slope angle with increased shortening velocity from 0.01 mm s–1 to 0.05 mm s–1, and a decrease in shortening (i.e. c. 100 mm), to attain the critical wedge height and slope angle compared to that of low-velocity shortening models (i.e. 110–120 mm) (Fig. 5).
3.c. High velocity
This set of experiments consists of five models (H1–H5) with shortening velocities of 0.1 mm s–1 to 0.5 mm s–1. The geometric evolution and displacement vectors of the model at a velocity of 0.4 mm s–1 are shown in Figure 6. The wedge geometries and slope angles of all models are shown in Figure 7.

Figure 6. High-velocity shortening experiment, an accretionary wedge with 0.4 mm s–1 shortening velocity. (a–h) Sequential photographs with particle trajectories and velocities showing the structural evolution of accretionary wedge. (i) Interpretation of the final geometry of the 0.4 mm s–1 shortening model. The fault displacement accommodated by each thrust is marked by an initial steep phase, followed by a short period of quiescence and reactivation.
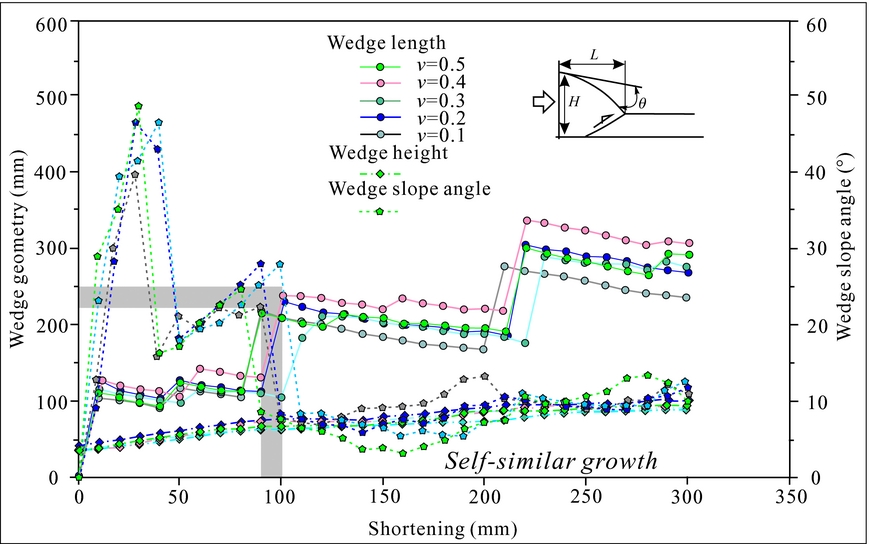
Figure 7. Plot of geometries of accretionary wedge versus shortening displacement under 0.1 mm s–1, 0.2 mm s–1, 0.3 mm s–1, 0.4 mm s–1 and 0.5 mm s–1 shortening velocities. The wedge geometries show roughly increased wedge length and height with increasing shortening velocities.
At 25 mm of shortening, initial deformation was characterized by the development of a flat-topped, roughly symmetri, pop-up anticline (Fig. 6a). With increased shortening, two closely spaced in-sequence imbricate thrusts nucleated at the velocity discontinuity. During this time they were longer lasting and displacement rates were higher than that of other low- to medium-velocity shortening models (shown by the gradient of displacement in Figs 2j, 4i, 6i). Furthermore, displacement vectors suggest that strain accumulation with distributed deformation occurred in a segment of width >200 mm in the frontal zone at c. 70–90 mm shortening (Fig. 6b). Such a similar strain accumulation is found at 200 mm shortening (Fig. 6e). Both resulted in much layer-parallel shortening occurring in the frontal zone. With progressive shortening, the wedge grows rapidly both in height and length, until a critical height of 68 mm and a c. 11° slope angle were attained at c. 90 mm shortening.
After a certain strain accumulation, a new thrust T3 nucleated and formed a flat-topped, asymmetric, pop-up structure at 95 mm shortening (Fig. 6c). However, the displacement vectors suggest that the localized deformation occurred only at the new pop-up structure, rather than across all the wedge. Such a localized deformation could be accounted for by rapid propagation of shear strain (e.g. Couzens-Schultz, Vendeville & Wiltschko, Reference Couzens-Schultz, Vendeville and Wiltschko2003; Smit, Brun & Soukoutis, Reference Smit, Brun and Soukoutis2003). With increased shortening, the nucleation of the subsequent two thrusts (T3 and T4), displayed the same trend as T1 and T2, and resulted in the previous thrust T1 being buried with substantial back-rotation. In particular, thrust T4 attained the highest displacement, reaching a value of 62 mm after reactivation at 210 mm shortening (Fig. 6i) coevally with nucleated thrust T5.
At 210 mm shortening, the model accommodated the third flat-topped, asymmetric, pop-up anticline and thrust T5 (Fig. 6f). With increased shortening, two back thrusts developed at the back limb of the new pop-up structure, and resulted in the blinded T4 (Fig. 6g). The displacement vectors reveal that an asymmetric shear strain might exist during the second and third pop-up structures. It is indicated by a triangular displacement-vector area with medium-value, uplift-related displacement at 245 mm shortening (Fig. 6g). In particular, distributed deformation still occurred at a segment of >100 mm width in the frontal zone. This set of experiments was stopped at 300 mm shortening, with final wedge height and length of 93 mm and 304 mm. Similarly to the low- to medium-velocity shortening models, there is an increase in the wedge length and wedge slope angle with increased shortening velocity from 0.1 mm s–1 to 0.5 mm s–1, and a decrease in shortening (i.e. c. 90 mm) to attain the critical wedge height and slope angle compared to that of low- to medium-velocity shortening models (Fig. 7).
4. Discussion
Our models provide insight into two aspects of accretionary wedge formation: (1) geometry and kinematics of the wedge; and (2) internal deformation during progressive shortening. Compared with previous experiments of brittle deformation (e.g. Mulugeta, Reference Mulugeta1988; Gutscher et al. Reference Gutscher, Kukowski, Malavieille and Lallemand1996, Reference Gutscher, Klaeschen, Flueh and Malavieille2001; Storti, Salvini & McClay, Reference Storti, Salvini and McClay2000; McClay & Whitehouse, Reference McClay, Whitehouse and McClay2004), there are common characteristics of accretionary wedges as follows: (1) a foreland-wards vergence and sequence of major thrust nucleation in a piggyback style; (2) development of secondary back thrusts that accommodate internal deformation within the thrust sheets; and (3) a rapid growth and subsequent slow self-similar growth. However, our experimental models indicate velocity-dependent geometry and kinematics of the wedge.
4.a. Decreased fault spacing with increased velocity of shortening
In an accretionary wedge foreland-vergent thrusts usually nucleate in a similar fashion, with fault spacing varying as a composite function of material properties, normal stress on the base and wedge thickness (Makel & Walters, Reference Makel and Walters1993; Strayer, Hudleston & Lorig, Reference Strayer, Hudleston and Lorig2001; Panian & Wiltschko, Reference Panian and Wiltschko2004). For example, the greater the wedge strength and/or normal stress, the wider the normalized fault spacing (Koyi & Vendeville, Reference Koyi and Vendeville2003). In our models with different shortening velocities, the fault spacing dominates with differing value and changes with progressive shortening (Fig. 8). Low- to medium-velocity models are characterized by increasing normalized fault spacing until the third pop-up structure at 200–250 mm shortening; in contrast, the normalized fault spacing of high-velocity shortening models has a two-stage increasing processes. Furthermore, there is distinct change in the normalized fault spacing with increasing velocity of shortening. At the early stage, high-velocity models produce much wider fault spacing than the low- to medium-velocity models, in particular the spacing of thrusts T3 and T2 is related to a critical wedge. In the high-velocity model, thrust T3 nucleated with a new pop-up structure after attaining a critical wedge with much wider spacing than the low- to medium-velocity models (Fig. 8). In the stage of self-similar growth, the low- to medium-velocity models have similar values of normalized fault spacing (i.e. normalized T3–T4 fault spacing of 3.5–3.7 and T4–T5 of 1.6–2.0), which is much larger than that for high-velocity models (i.e. T3–T4 spacing of 0.8–3.4 and T4–T5 of 0.7–1.8). A similar trend was reported by Mulugeta (Reference Mulugeta1988) in analogue models as well as the natural fold–thrust belts (e.g. Davis & Engelder, Reference Davis and Engelder1985; Koyi & Vendeville, Reference Koyi and Vendeville2003; Panian & Wiltschko, Reference Panian and Wiltschko2004, Reference Panian and Wiltschko2007).

Figure 8. Spacing between adjacent thrusts as a function of shortening velocity. The initial fault spacing is measured when the next-to-form thrust nucleates with progressive shortening. In addition, the spacing is normalized to the initial height of thrust sheet at the frontal-deformation zone. There is a distinct change in the normalized fault spacing with increased velocity of shortening.
4.b. Velocity-dependent geometry of accretionary wedge
The accretionary wedge grows episodically with cycles of wedge thickening and lengthening, as well as distributed strain/deformation in our models. Generally, a new foreland-vergent thrust accompanied by a pop-up structure nucleates in the frontal zone after a certain amount of strain accumulation. At low- to medium-velocity of shortening, the wedge is characterized by five foreland-vergent thrusts with maximum displacement of T1 and maximum ramp angle of T4 (Figs 2, 4). However, the wedge of the high-velocity model is characterized with 4–6 foreland-vergent thrusts, among which thrust T4 developed with the maximum displacement and ramp angle (Fig. 6). Moreover, the number of back thrusts in the frontal pop-up structure increases from two thrusts in the model with 0.002 mm s–1 velocity to four thrusts in the model with 0.4 mm s–1. The wedge slope angle and length (i.e. 10–11° and 230–300 mm) are therefore roughly larger and longer than that of low- to medium-velocity shortening models (i.e. c. 10° and 230–280 mm). We therefore prefer the theory that the high-velocity shortening models need shorter amounts of bulk shortening to attain a critical state; at this state the wedge has enough strength to sustain a larger slope angle and longer length in geometry.
4.c. Internal deformation in the accretionary wedge
Koyi (Reference Koyi1988, Reference Koyi1995) argued that changes in volumetric strain and bed length are correlated with basal friction, detachment dip, bulk shortening and the material properties of wedges (Koyi & Vendeville, Reference Koyi and Vendeville2003; Nilforoushan et al. Reference Nilforoushan, Koyi, Swantesson and Talbot2008). The bed-length shortening and volumetric strain at different depths of the wedge changed significantly as well as their calculated error (Mulugeta & Koyi, Reference Mulugeta and Koyi1987; Ahmad et al. Reference Ahmad, Dubey, Toscani, Bonini and Seno2014). In particular, the shallow sand layer in the wedge probably kept its initial length in contrast to the deeper layer undergoing 40–50% bed-length shortening (Koyi, Reference Koyi1995). In order to quantify internal deformation of the wedge in our models, volumetric strain and layer-parallel shortening were therefore calculated by comparing the cross-section area and length of the lowest marker layer between the initial stages and each 20 mm increment of shortening. The volumetric strain correlates with lateral compaction of the sand layers in the wedge as the sand grains are repacked, frictional slip occurring along sand grain contacts, and gravitational compaction correlates with shortening (Nihei et al. Reference Nihei, Hilbert, Cook, Nakagawa and Myer2000; Koyi et al. Reference Koyi, Sans, Teixell, Cotton, Zeyen and McClay2004).
In our models, volumetric strain and total layer-parallel shortening increased with progressive shortening (Fig. 9). Both were usually accommodated by shortening before the nucleation of a new thrust in the frontal zone. The displacement vectors imply that the sand layer suffered from distributed deformation by volumetric strain and layer-parallel shortening. Measurements show that a high-velocity shortening accommodated larger volumetric strain and layer-parallel shortening (Fig. 9) and a wider distributed deformation zone (Fig. 6) than that of low- to medium-velocity shortening. Under 300 mm shortening the low-velocity shortening models are characterized by 14–16% bed-length change, whereas the high-velocity models show 10–17% bed-length change. Furthermore, the low-velocity models exhibit 4–6% volumetric strain, less than the 6–7% volumetric strain of high-velocity models.

Figure 9. (a) Volumetric strain and (b) length change (the difference between initial length and restored length) as a function of shortening velocity, measured after each increment of 20 mm shortening.
4.d. Asymmetric structure with increased shortening velocity
With the increased shortening velocity in our models, the frontal pop-up structures are characterized by an asymmetry. To accommodate such an asymmetric structure a component of layer-parallel shear is required; otherwise, it would be dominated by symmetric pop-up structures (e.g. Davies & Fletcher, Reference Davies, Fletcher, Knipe and Rutter1990; Couzens-Schultz, Vendeville & Wiltschko, Reference Couzens-Schultz, Vendeville and Wiltschko2003). At higher shortening velocity, the asymmetry increases with increased back thrusts (Fig. 6i). The localized deformation in the frontal pop-up anticline is indicated by displacement vectors (Fig. 6c, f). Furthermore, there is a distinct increase in the displacement rate of foreland-vergent thrusts in high-velocity models. Recently, Nilforoushan et al. (Reference Nilforoushan, Pysklywec and Cruden2012) argued that increased shortening velocity accommodates much asymmetry in deformation, in particular with high cohesion of brittle materials. This could be interpreted by an increase in layer-parallel shear to propagate the deformation in our high-velocity models. In particular, the development of an asymmetric structure was facilitated by the presence of both a hinterland and a foreland inhomogeneity (e.g. Costa & Vendeville, Reference Costa and Vendeville2002; Cruz et al. Reference Cruz, Teyssier, Perg, Take and Fayon2008; Nilforoushan et al. Reference Nilforoushan, Pysklywec and Cruden2012).
Although the idea that weakening along faults depends on accumulated strain or strain rate is strongly debated, Ruh, Gerya & Burg (Reference Ruh, Gerya and Burg2014) used a three-dimensional numerical model to unravel the influence of shortening velocity in a strain-weakened model, and suggested that velocity weakening leads to different structural patterns. Theoretically, faster shortening velocity could result in a faster propagation of deformation. The model accommodated higher horizontal shear stresses along the previous thrust and basal detachment, and therefore a higher potential for the occurrence of reactivation of thrust and out-of-sequence thrusting. At high velocity, localized reactivation of thrusts dominates in the model with a velocity of 0.4 mm s–1 (Fig. 6i). It should be noted that there was an increase in back thrust and back rotation with increased shortening velocity in our models, resulting in some thrusts being overturned and blinded in the hinterland of the wedge (Fig. 10). In this model, piggyback thrust sheets were unstable and deformed during progressive shortening. These subsequently formed different patterns of wedge growth that exhibit the basic types of wedge structure and sequence of thrusts, for example forward-thrust, back-thrust, symmetrical pop-up and flip styles (Davis & Engelder, Reference Davis and Engelder1985; Bonini, Reference Bonini2001; Smit, Brun & Soukoutis, Reference Smit, Brun and Soukoutis2003). An increase in the wedge topography would result in the backwards rotation of the principal stress, thus favouring backwards vergence (e.g. Nilforoushan et al. Reference Nilforoushan, Koyi, Swantesson and Talbot2008). With increased shortening velocity, the number of back thrusts and reactivation of previous thrusts increased in models, resulting in the development of a backwards-to-forwards style (i.e. flip style; Smit, Brun & Soukoutis, Reference Smit, Brun and Soukoutis2003) of the wedge growth (Fig. 10).

Figure 10. Comparison of interpreted final model characterized with three patterns of wedge growth with increased shortening velocity: (a) 0.002 mm s–1; (b) 0.05 mm s–1; and (c) 0.4 mm s–1. From left to right, the displacement parameters correspond to incremental displacement per second (i.e. speed); instantaneous increment of horizontal speed (du/dx); and instantaneous increment of vertical speed (dv/dx). The ideal models are modified after Smit, Brun & Soukoutis (Reference Smit, Brun and Soukoutis2003). A symmetric pop-up style usually occurred in the frontal zone of the wedge in the low-velocity shortening models, while backwards-to-forwards style occurred in the high-velocity shortening models with increased back thrust.
In particular, pronounced differences in the incremental displacement and instantaneous increments of horizontal and vertical speed can be observed among the different growth models (Fig. 10), visualized by means of an optical method (Adam et al. Reference Adam, Urai, Wieneke, Oncken, Pfeiffer, Kukowski, Lohrmann, Hoth, Van der zee and Schmatzm2005; Hoth et al. Reference Hoth, Adam, Kukowski, Oncken, Willett, Hovius, Brandon and Fisher2006). The symmetric pop-up structure is characterized by symmetry in geometry and instantaneous increment (i.e. du/dx and dv/dx). In contrast, a pattern of backwards-to-forwards thrusts dominates the first-order style of backwards thrusting in displacement vectors, indicating an asymmetry in geometry and kinematics of the wedge.
4.e. Extrinsic versus intrinsic variability of models
Since both the extrinsic and intrinsic variability of the analogue models influence the wedge evolution, we can only obtain meaningful inferences from models if extrinsic variability is much larger than intrinsic variability (Cubas, Maillot & Barnes, Reference Cubas, Maillot and Barnes2010; Santimano, Rosenau & Oncken, Reference Santimano, Rosenau and Oncken2015). We therefore employed statistical analysis to study extrinsic (i.e. shortening velocity) and intrinsic variability (i.e. inherent properties of the wedge) at the stage of self-similar growth of wedges, following the methods of Santimano, Rosenau & Oncken (Reference Santimano, Rosenau and Oncken2015). Although the experiments have a systematic change in shortening velocity, the statistical results of coefficient of variation (CV) show that the parameters can be divided into two categories based on their CV values. Accordingly, the CV is lower for wedge height (CV=0.13–0.15), thrust-ramp angle (CV=0.03–0.08) and displacement (CV=0.06–0.12), and higher for wedge length (CV=0.25–0.36), volume strain (CV=0.12–0.32) and delta length (CV=0.2–0.43) (Fig. 11). The main difference between those parameters is that wedge length, volume strain and delta length are time dependent, which may reflect evolving wedge dynamics. While the lower CV parameters are not time dependent, they are related to properties of the entire wedge.
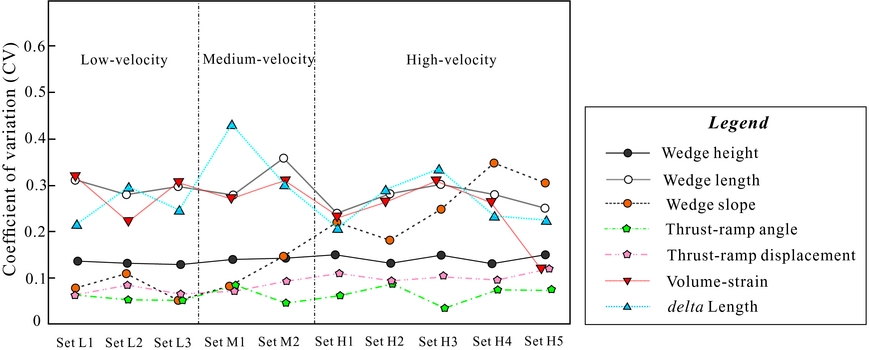
Figure 11. The coefficient of variation (CV) plot for each parameter in the different set-ups.
The wedge slope shows an increasing trend in CV (0.05–0.35) from the low-velocity models to the high-velocity models; however, most parameters show no increasing or decreasing trend with increased velocity. Furthermore, the statistical test ANOVA shows that p-values for thrust-ramp angle decrease from c. 0.8 in the L1–L3 experiments to c. 0.5 in the H1–H5 experiments and R 2 increases from c. 0.05 to c. 0.2. A similar trend is found in the thrust-ramp displacement: the p-values decrease from c. 0.8 to c. 0.4 and R 2 show an increase from c. 0.05 to c. 0.2 with increased shortening velocity. As we know, a large R 2 and smaller p-value suggests that the variation in our models is due to the experimental set-up or extrinsic sources, rather than variation with the system (Zar, Reference Zar2010; Santimano, Rosenau & Oncken, Reference Santimano, Rosenau and Oncken2015). In particular, a p-value >5% suggests repeatability of the data from different experiments of the same set-up, or reproducibility of the model. The statistical test ANOVA therefore recognizes that the variation in the observables (e.g. the thrust-ramp angle and displacement) is repeatable between our models. It further indicates an increased effect of the extrinsic variability, or greater susceptibility to extrinsic changes in the wedge when shortening velocity is increased. We therefore argue that a weak correlation between the shortening velocity with geometry and internal strain of the wedge can be found, which may cause a variation smaller than the intrinsic variability of high-CV parameters.
4.f. Comparison of the natural examples
Natural accretionary wedges and fold–thrust belts are considerably more complicated than our analogue models. Our purpose was not to replicate in detail the evolution of a specific accretionary wedge, but instead to unravel a basic kinematic framework that includes some general features in natural orogens. The Zagros and SW Taiwan fold–thrust belts have a greater affinity with our sandbox models because of both the rheology of the accreted material and variable shortening velocities along-strike. Their internal architecture provides a model that can be compared with our models.
The Zagros fold–thrust belt is located at the edge of the Arabian Plate, a result of convergence between the Arabia and Eurasia plates since Late Cretaceous time, of the width of which varies from 350 km in the east to 200 km in the west (Fig. 12). The Zagros can be divided into two belts from NE to SW, that is, the High Zagros and the Simple Fold Belt. The High Zagros comprises highly deformed metamorphic rocks of Mesozoic age, bounded to the NE by the Main Zagros Thrust (MZT) and the Main Recent Fault (MRF) (the boundary with Central Iran), and to the SW by the High Zagros Fault (HZF). The High Zagros overthrusts southwards to the Zagros Fold Belt, which consists of a 10 km thick Palaeozoic–Cenozoic sequence of sediments. Furthermore, the Zagros can be divided into two geological domains separated by the N–S-trending strike-slip Kazerun Fault (KF), the narrower North Zagros (the Dezful Embayment and Lorestan Zone) to the west and the wider Central Zagros (or Fars) to the east (Sepehr & Cosgrove, Reference Sepehr and Cosgrove2004; Hatzfeld et al. Reference Hatzfeld, Authemayou, Van der beek, Bellier, Lave, Oveisi, Tatar, Tavakoli, Walpersdorf, Yamini-Fadr, Leturmy and Robin2010). It should be noted that significant differences in mechanical stratigraphy exist between the North and the Central Zagros. It means the sedimentary cover of the latter has been deposited on top of the infra-Cambrian Hormuz Salt layer, whereas this layer is absent from the North Zagros.

Figure 12. Natural example of the Zagros fold–thrust belt. (a) Map of the Zagros region, showing NW decreased horizontal velocities (GPS velocities from Hessami, Nilforoushan & Talbot, Reference Hessami, Nilforoushan and Talbot2006; Hatzfeld et al. Reference Hatzfeld, Authemayou, Van der beek, Bellier, Lave, Oveisi, Tatar, Tavakoli, Walpersdorf, Yamini-Fadr, Leturmy and Robin2010). (b) Cross-sections in North Zagros showing different total amounts of shortening and structural styles (modified from Blanc et al. Reference Blanc, Allen, Inger and Hassani2003; McQuarrie, Reference McQuarrie2004).
The overall architecture and dynamics of this accretionary system in the North Zagros Fault show some basic similarities with our experiments (Fig. 12): (1) the strata consist mainly of sedimentary rocks with whole mechanical properties, as we assumed in our analogue models; (2) the GPS measurements indicate that it is currently shortening at c. 10 mm a–1 in the SE Zagros and 3–6 mm a–1 in the NW Zagros (Hessami, Nilforoushan & Talbot, Reference Hessami, Nilforoushan and Talbot2006; Tavakoli et al. Reference Tavokoli, Walpersdorf, Authemayou, Nankali, Hatzfeld, Tatar, Djamour, Nilforoushan and Cotte2008), indicating a distinct decrease in shortening velocities along-strike; (3) the balanced cross-sections suggest a northwards decrease in the total amount of shortening, both for the whole Zagros (from 85 km in the Dezful embayment to 56 km in the Lorestan zone) and for the Zagros Fold Belt (from 50 km to 35 km) (Blanc et al. Reference Blanc, Allen, Inger and Hassani2003; McQuarrie, Reference McQuarrie2004; Sherkati, Letouzey & De Lamotte, Reference Sherkati, Letouzey and De Lamotte2006); (4) topographical profiles from digital elevation model (DEM) data across the North Zagros show very gentle topographic slopes that subtly decrease from SE to NW (McQuarrie, Reference McQuarrie2004; Nilforoushan et al. Reference Nilforoushan, Koyi, Swantesson and Talbot2008); and (5) the structural styles indicated by surface and seismic data are dominated by asymmetric folds and pop-up structures at the Dezful embayment, in contrast to symmetric structures at the Lorestan zone across the North Zagros Simple Fold Zone (Blanc et al. Reference Blanc, Allen, Inger and Hassani2003; McQuarrie, Reference McQuarrie2004; Sherkati, Letouzey & De Lamotte, Reference Sherkati, Letouzey and De Lamotte2006). Given such similarities, we argue a comparable kinematics between the North Zagros and our analogue models. It indicates that the high-velocity shortening models undergo a higher amount of shortening, and accommodate a greater development of asymmetric structures.
The Plio-Pleistocene SW Taiwan fold–thrust belt has been presented as a key example for understanding the architecture of active fold–thrust belts (e.g. Suppe, Reference Suppe2007). The balanced cross-sections and wedge geometries indicate a northwards decrease in amount of shortening and percentage of shortening (Mouthereau et al. Reference Mouthereau, Lacombe, Deffontaines, Angelier and Brusset2001; Mouthereau & Lacombe, Reference Mouthereau and Lacombe2006) as well as in slope angle of the topography (Mouthereau et al. Reference Mouthereau, Deffontaines, Lacombe, Angelier, Byrne and Liu2002). Moreover, the availability of well-preserved growth strata has allowed the reconstruction of the thrusting events along the SW Taiwan fold–thrust belt (Mouthereau et al. Reference Mouthereau, Lacombe, Deffontaines, Angelier and Brusset2001), which suggests out-of-sequence thrusting occurred in the south (e.g. the Kuanmiao area) in contrast to the in-sequence thrusting in the north (e.g. the Yushing area). Such variations along the strike of the SW Taiwan fold–thrust belt show many similarities with our experimental results. This is probably related to a northwards decrease of shortening rates from 50–80 mm a–1 in the south to 10–30 mm a–1 in the north of the SW Taiwan Orogen (Yu, Chen & Kuo, Reference Yu, Chen and Kuo1997; Huang et al. Reference Huang, Wiltschko, Lin, Hichman, Fang and Bock1999), as revealed in our models. In particular, it indicates that a velocity-dependent geometry and internal strain in accretionary wedges may occur in natrual orogens.
The volumetric strain and layer-parallel shortening are expected to be greater in the accretionary wedges shortened with high velocity than those with low velocity. Such deformation has major implications for hydrocarbon systems within fold–thrust belts. Furthermore, high volumetric strain and layer-parallel shortening greatly facilitate the formation of fractured hydrocarbon reservoir systems and reservoir stimulation of unconventional hydrocarbons. In addition, different types of the wedge growth have major implications for hydrocarbon generation and migration.
5. Conclusions
Our models show that shortening velocity has an important influence on geometry and kinematics of the accretionary wedge. Models with high-velocity shortening develop wedges with higher numbers of foreland-vergent thrusts, larger fault spacing and displacement rate, and larger critical slope angle and height than for low- to medium-velocity shortening. At the same amount of bulk shortening, the high-velocity shortening models undergo a higher amount of volumetric strain and total layer-parallel shortening, and develop a greater number of back thrusts and asymmetric structures. Furthermore, the statistical analysis suggests a weak correlation between the shortening velocity and geometry and internal strain of wedge, indicating a weak velocity dependence on geometry of the accretionary wedge. However, the high-velocity shortening may result in the occurrence of overturned and blinded thrusts in the hinterland of the wedge. Also, a backwards-to-forwards style of wedge growth occurs in the frontal zone under a regime of high-velocity shortening.
Acknowledegments
This work was supported by the Natural Science Foundation of China (grant nos 41572111, 41402119, 41472107, 2014JQ0057 and 2017JQ0025). We acknowledge the assistance of Jansa Luba and Frank Thomas with English and Santimano with statistical analysis. We also thank the reviewer Faramarz Nilforoushan and Editor Mark Allen for thorough and constructive reviews.


