


1. Introduction
Fission-track (FT) analysis is a robust and powerful tool in unravelling the low-temperature cooling history in the upper crust and helps to constrain the exhumation history of mountain ranges (e.g. Kamp, Green & White, Reference Kamp, Green and White1989; Brandon, Roden-Tice & Garver, Reference Brandon, Roden-Tice and Garver1998; Reiners & Brandon, Reference Reiners and Brandon2006). If exhumation was controlled by normal faulting, then fission-track ages should display a systemic age relationship with respect to the fault (Foster & John, Reference Foster, John, Ring, Brandon, Lister and Willett1999; Ring et al. Reference Ring, Brandon, Willett, Lister, Ring, Brandon, Lister and Willett1999). Slip, exhumation and cooling rates as derived from fission-track age patterns in normal-faulting-controlled terrains are relatively fast, on the order of kilometres per Ma and tens of °C per Ma, respectively (John & Howard, Reference John and Howard1995; Foster & John, Reference Foster, John, Ring, Brandon, Lister and Willett1999; Brichau et al. Reference Brichau, Ring, Carter and Brunel2006, Reference Brichau, Ring, Carter, Bolhar, Monié, Stockli and Brunel2008). Erosional denudation, which can be equally fast, results in age–elevation relationships with the oldest ages corresponding with the highest altitude (Fig. 1; also see Kamp, Green & White, Reference Kamp, Green and White1989; Fitzgerald, Sorkhabi & Stump, Reference Fitzgerald, Sorkhabi and Stump1995).
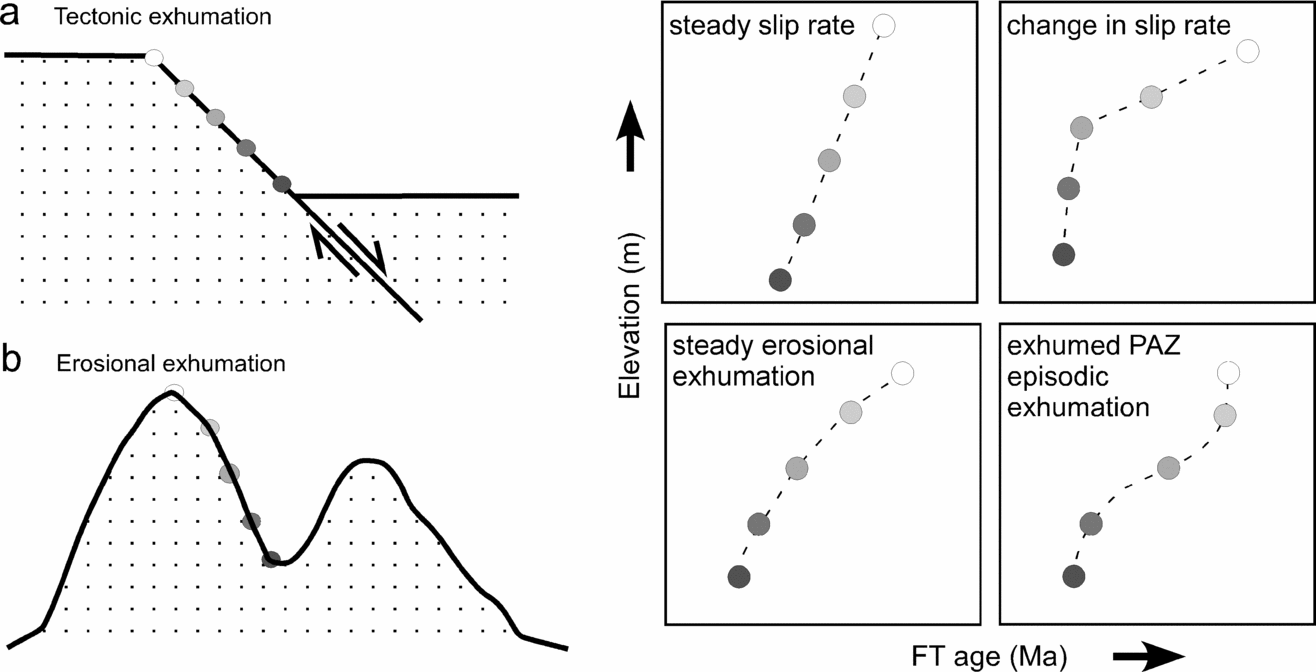
Figure 1. Conceptual figure showing potential age–elevation trends of fission-track ages in settings with steady or changing slip rates on normal faults during tectonic exhumation (a), or the case of steady or episodic (exhumed partial retention zone – PAZ) erosional exhumation (b).
The lithosphere of the west coast of the South Island of New Zealand is part of the Australian Plate, which is bounded to the east by the Alpine Fault (Wellman, Reference Wellman1955) (Fig. 2). High-grade gneisses and granitoids are exposed in the Paparoa, Victoria and Hohonu ranges (Tulloch & Kimbrough, Reference Tulloch and Kimbrough1989), the Fraser Complex, wedged between the Fraser and Alpine faults (Rattenbury, Reference Rattenbury1991), and the Bonar Range (Jongens, Reference Jongens2006). These gneisses have undergone amphibolite-facies metamorphism, have been variably deformed, and are faulted against low-grade Greenland Group metasediments (Nathan, Rattenbury & Suggate, Reference Nathan, Rattenbury and Suggate2002). Tulloch (Reference Tulloch1995) suggested that most of the amphibolite-facies gneissic uplifts are Cretaceous metamorphic core complexes. However, the Fraser Complex is thought to be different, and its exhumation is attributed to high-angle fault movement associated with strong late Tertiary erosion in the footwall of the Alpine Fault (White & Green, Reference White and Green1986; Rattenbury, Reference Rattenbury1987, Reference Rattenbury1991).
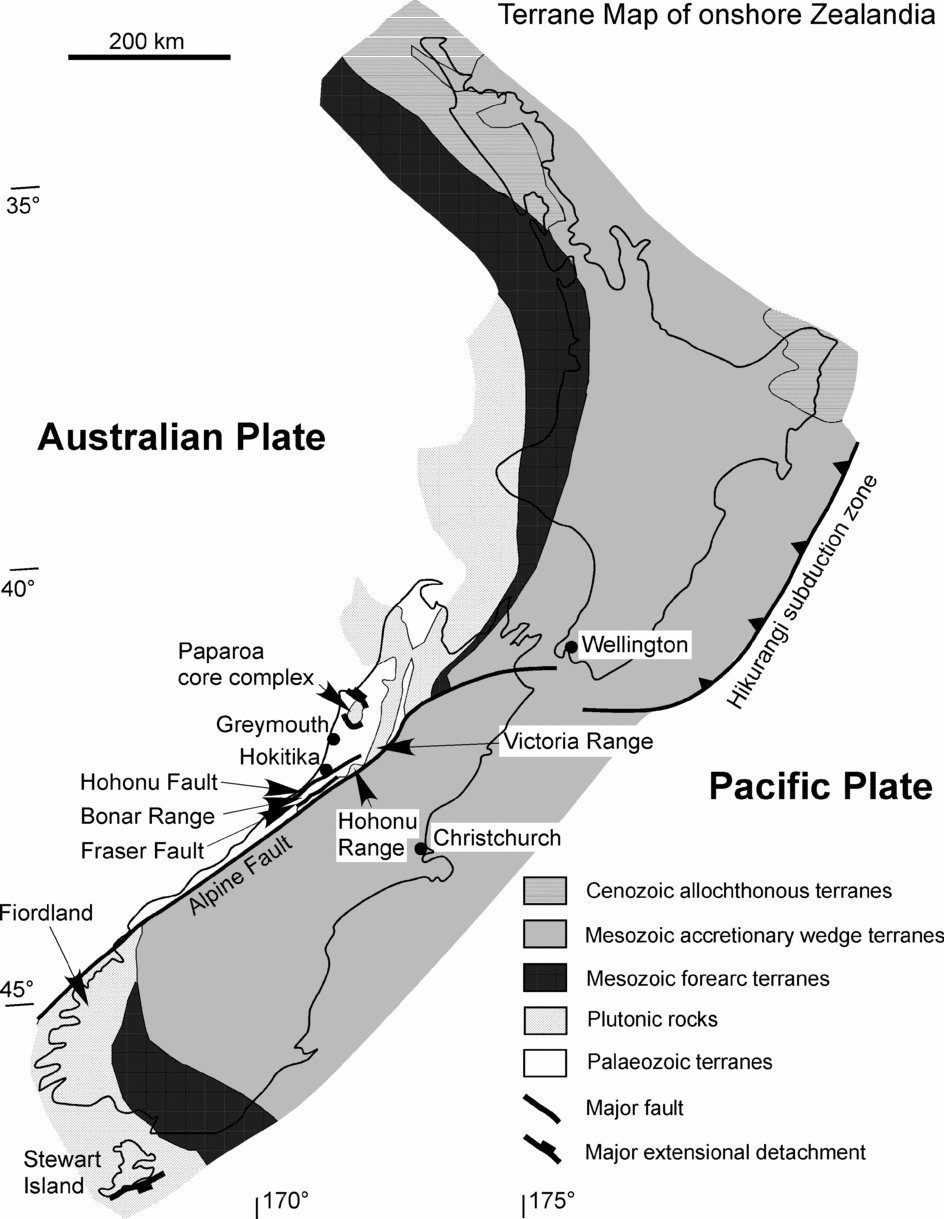
Figure 2. Tectonic overview map of onshore Zealandia with the distribution of high-grade gneisses and gneissic granitoids west of the Alpine Fault in Westland. The dextral–transpressive Alpine Fault is the plate boundary between the Pacific Plate to the east and the Australian Plate to the west and controls rapid uplift and erosional exhumation of the Southern Alps in its hangingwall. High-grade rocks between the Fraser Fault and Alpine Fault are collectively called the Fraser Complex. The Bonar Range location (Fig. 3) is indicated between the Fraser and Hohonu faults.
The core complexes on the west coast of the South Island (Westland) of New Zealand are generally interpreted as precursors of Tasman Sea rifting (Tulloch & Kimbrough, Reference Tulloch and Kimbrough1989). The most prominent of the Westland core complexes is the Paparoa core complex (Fig. 2), which had a major phase of extensional faulting at c. 110–100 Ma when the amphibolite-facies footwall cooled at rates of about 100 °C Ma−1 (Tulloch & Kimbrough, Reference Tulloch and Kimbrough1989; Spell, McDougall & Tulloch, Reference Spell, McDougall and Tulloch2000). Core complex formation on New Zealand's west coast took place within a former subduction-related magmatic arc, which has been shut off at 110–100 Ma (Kimbrough et al. Reference Kimbrough, Tulloch, Coombs, Landis, Johnston and Mattinson1994; Mortimer et al. Reference Mortimer, Tulloch, Spark, Walker, Ladley, Allibone and Kimbrough1999). Extension and the formation of the core complexes finally resulted in the formation of the Tasman Sea, initial spreading of which commenced at c. 84 Ma (Gaina et al. Reference Gaina, Muller, Royer, Stock, Hardebeck and Symonds1998).
The Southern Alps of New Zealand formed in the Late Tertiary by oblique shortening across the Alpine Fault (Kamp, Green & White, Reference Kamp, Green and White1989; Berryman et al. Reference Berryman, Beanland, Cooper, Cutten, Norris and Wood1992; Walcott, Reference Walcott1998; Batt & Braun, Reference Batt and Braun1999). Currently the Alpine fault accommodates about 11 mm Ma−1 of convergence in addition to approximately 38 mm Ma−1 of dextral transcurrent motion (Norris, Koons & Cooper, Reference Norris, Koons and Cooper1990; Norris & Cooper, Reference Norris and Cooper2001) and thus about 80–85 % of the plate-convergence related deformation in the South Island of New Zealand. The Southern Alps are one of the best examples on Earth for orographically controlled rainfall with a very wet and extremely quickly eroding western flank and a relatively dry and slowly eroding eastern side (Willett, Reference Willett1999). Despite the large number of studies on the uplift and exhumation history of the Southern Alps, it is still uncertain when they formed a topographic feature sustaining a pronounced rainshadow effect. Estimates range from 12 Ma to 2.5 Ma (Cutten, Reference Cutten1979; Kamp & Tippet, Reference Kamp and Tippet1993; Chamberlain & Poage, Reference Chamberlain and Poage2000).
In this contribution we report FT ages from the Bonar Range to the south of the Paparoa core complex (Fig. 3), to test whether or not the Bonar Range represents a Cretaceous core complex or a Miocene erosionally exhumed uplift like the Fraser Complex. A characteristic feature of the footwalls of core complexes is that they cool rapidly as they are dragged toward the surface (Miller et al. Reference Miller, Dumitru, Brown and Gans1999; Brichau et al. Reference Brichau, Ring, Carter and Brunel2006, Reference Brichau, Ring, Carter, Bolhar, Monié, Stockli and Brunel2008), and therefore low-temperature thermochronology is an excellent tool for establishing cooling rates and the timing of a possible extensional detachment in the Bonar Range. We collected 13 samples, mainly along a profile parallel to an ENE-trending stretching lineation reported by Jongens (Reference Jongens2006). If the Bonar Range is indeed a core complex, the FT ages in the footwall of the putative top-to-the-ENE displacing Waitaha fault should show a systematic younging trend, as has been demonstrated by FT studies from other core complexes (Forster & John, Reference Foster, John, Ring, Brandon, Lister and Willett1999; Wells, Snee & Blythe, Reference Wells, Snee and Blythe2000; Ring, Thomson & Bröcker, Reference Ring, Thomson and Bröcker2003; Kumerics et al. Reference Kumerics, Ring, Brichau and Glodny2005; Thomson & Ring, Reference Thomson and Ring2006; Brichau et al. Reference Brichau, Ring, Carter and Brunel2006, Reference Brichau, Ring, Carter, Monié, Bolhar, Stockli and Brunel2007, Reference Brichau, Ring, Carter, Bolhar, Monié, Stockli and Brunel2008; Thomson et al. Reference Thomson, Ring, Brichau, Glodny, Will, Ring and Wernicke2009). If, on the other hand, exposure of the Bonar Range was due to late Tertiary erosion in the footwall of the Alpine Fault, then FT ages should show corresponding age–elevation trends of Miocene and younger ages.
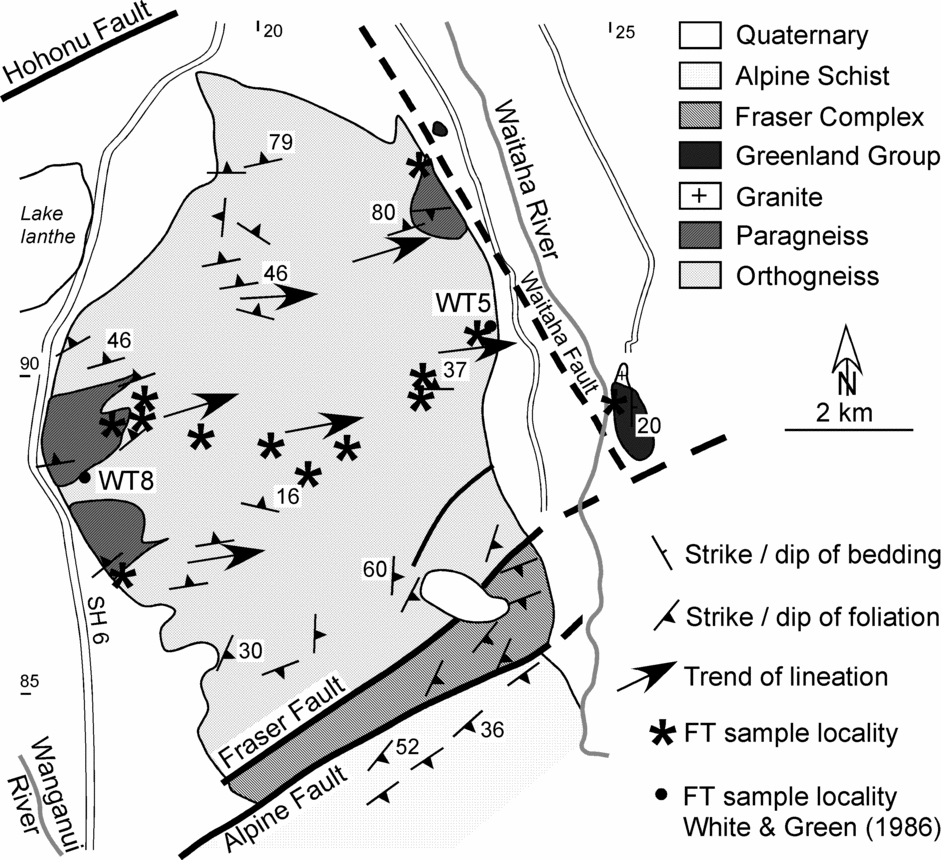
Figure 3. Geological and tectonic map of the Bonar Range after Jongens (Reference Jongens2006). Shown are strike and dips of the main foliation and the locations of the FT samples. Inferred NNW–SSE Waitaha fault is shown, according to Jongens (Reference Jongens2006). Fission-track thermochronology locations from White & Green (Reference White and Green1986) are also shown.
2. Geological setting
The geology of the Australian Plate on the west coast of New Zealand is made up of high-grade gneisses, abundant arc-related granitoids and low-grade Ordovician sedimentary rocks of the Greenland Group (Tulloch & Kimbrough, Reference Tulloch and Kimbrough1989; Rattenbury, Reference Rattenbury1991; Nathan, Rattenbury & Suggate, Reference Nathan, Rattenbury and Suggate2002). The gneisses have all undergone amphibolite-facies metamorphism. The age of high-grade metamorphism is not well constrained but appears to be Early Cretaceous in the Paparoa core complex (Kimbrough & Tulloch, Reference Kimbrough and Tulloch1989; Ireland & Gibson, Reference Ireland and Gibson1998) and Late Jurassic to Early Cretaceous in the Fraser Complex (Kimbrough, Tulloch & Rattenbury, Reference Kimbrough, Tulloch and Rattenbury1994). However, metamorphic ages for the Bonar Range appear to be older (see Section 2.a). Most of the granitoids formed in a long-lived subduction-related magmatic arc that fringed eastern Gondwana from Late Devonian to Early Cretaceous times (Tulloch, Reference Tulloch1983; Mortimer et al. Reference Mortimer, Tulloch, Spark, Walker, Ladley, Allibone and Kimbrough1999; Tulloch et al. Reference Tulloch, Ramezani, Mortimer, Mortensen, Van Den Bogaard, Maas, Ring and Wernicke2009).
At about 110–100 Ma the subduction system was shut off and the New Zealand continent underwent a major phase of extensional tectonism. Initially extension was manifested by the development of core complexes. This stage was followed by the opening of the Tasman Sea oceanic basin (Gaina et al. Reference Gaina, Muller, Royer, Stock, Hardebeck and Symonds1998). During the incipient opening of the Tasman Sea the Paparoa Basin formed at c. 80 Ma (Laird, Reference Laird and Ballance1993, Reference Laird, van der Lingen, Swanson and Muir1994). The Paparoa Basin was apparently regionally restricted to the area north of Greymouth, about 100 km north of the Bonar Range.
The next major event in New Zealand geology was the development of the Challenger Rift System, which was active through western New Zealand during Late Eocene to Late Oligocene times (Kamp, Reference Kamp1986). The Challenger Rift system is a contender for normal faulting, which pre-dated the formation of the present plate boundary zone. However, not much is known about the architecture and structural styles of the rift system.
The final and ongoing step in New Zealand tectonics is the building of the Southern Alps. Walcott (Reference Walcott1998) proposed that a major change in the motion of the Pacific Plate relative to the Australian Plate around 6.4 Ma caused dextral transpression across the Alpine Fault and uplift and erosion of the Southern Alps. Cande & Stock (Reference Cande and Stock2004) revised Pacific–Australia plate rotations. They found that changes in relative displacement along the Alpine Fault have been small over the last 20 Ma.
Bedrock apatite and zircon FT ages indicate rapid and widespread cooling of the Southern Alps since about 10–8 Ma (Adams & Nathan, Reference Adams and Nathan1978; Tippett & Kamp, Reference Tippett and Kamp1993), which was interpreted to be the time when the kinematics of the plate boundary changed from dextral strike-slip to obliquely convergent. This kinematic change should have resulted in surface uplift, enhanced erosion and thus cooling and exhumation, the latter of which in the Southern Alps above the Alpine Fault may be as fast as 10 km Ma−1 (Kamp, Green & White, Reference Kamp, Green and White1989). Kamp, Green & Tippett (Reference Kamp, Green and Tippett1992) showed that beneath the Alpine Fault in the foreland of the Southern Alps, exhumation rates are 0.4 to 2 km Ma−1, with slower rates in the north. Based on reset bedrock zircon fission-track (ZFT) ages, Garver & Kamp (Reference Garver and Kamp2002) argued for an important phase of rapid cooling from 8 Ma in the south (near Haast) to 5 Ma in the northern part (near Hokitika) of the Southern Alps. Detrital FT grain-age spectra from the Hokitika River about 40 km north of the Bonar Range are between about 150 and 2 Ma, and in this age range two principal peak ages occur at c. 73 Ma and c. 6.5 Ma (Garver & Kamp, Reference Garver and Kamp2002).
2.a. Bonar Range
The Bonar Range trends in a north–northwest direction for approximately 7 km between the Fraser and Hohonu faults. It is bounded to the northeast by the Waitaha River and to the southwest by the Wanganui River (Fig. 3). Quaternary glacial advance deposits cover the margins of the range and adjacent river valleys. Morgan (Reference Morgan1908) was the first to recognize ‘gneissic and dark schists’ in the Bonar Range. The dominant rock type of the Bonar Range is a Palaeozoic granitic to granodioritic gneiss referred to as the Bonar orthogneiss (Jongens, Reference Jongens2006). Sillimanite forming in the main foliation in the orthogneiss, and the presence of subordinate amphibolite-facies paragneisses attest to high-grade metamorphism (Jongens, Reference Jongens2006). Five analyses of monazite from the gneiss gave ages between 349 and 370 Ma, and five U–Pb analyses of zircon gave dates between 369 and 881 Ma. The monazite and youngest zircon U–Pb ages both indicate a late Devonian to earliest Carboniferous crystallization age for the granodiorite (T. R. Ireland & M. S. Rattenbury, unpub. data, 2001).
The gneissic foliation in the Bonar Range dips moderately to steeply to the north, and swings in strike from northeast along the western part of the range, through an easterly strike, to a southeast strike in the eastern part of the range (Fig. 3; Jongens, Reference Jongens2006). Jongens (Reference Jongens2006) mapped 10–60 m thick zones of mylonite and protomylonite that developed during greenschist-facies reworking of the amphibolite-facies gneiss. The protomylonitic foliation is associated with an ENE-trending stretching lineation (Fig. 3), mainly expressed by quartz ribbons. Feldspar porphyroclasts with asymmetric tails, mica fish and asymmetric shear bands indicated a top-to-the-ENE sense of shear. The age of protomylonitization is unknown, but because it occurred under greenschist-facies conditions, it pre-dates zircon FT cooling ages (see Section 4.a).
In contrast to the high-grade rocks of the Bonar Range, rocks immediately to the northeast consist of low-grade Greenland Group metasediments cut by undeformed Devonian granite (Cox & Barrell, Reference Cox and Barrell2007). The change in metamorphic grade and the degree of deformation was attributed to an inferred fault parallel to the Waitaha River (Jongens, Reference Jongens2006). Jongens (Reference Jongens2006) suggested this fault could be related to Cretaceous core-complex-style extension and/or the Late Cenozoic building of the Southern Alps.
The only ZFT study in the region was carried out by White & Green (Reference White and Green1986), who dated deformed granite from the Bonar Range (WT5 and WT8), and two mylonites and a single gneiss sample from the adjacent Fraser Complex (Fig. 3). The deformed granite from the Bonar Range yielded c. 79–75 Ma ages, indicating they had undergone no subsequent ductile deformation (White & Green, Reference White and Green1986; Kamp, Green & Tippett, Reference Kamp, Green and Tippett1992). The three samples from the Fraser Complex all yielded ages between 10 and 8 Ma and were inferred by White & Green (Reference White and Green1986) and Kamp, Green & Tippett (Reference Kamp, Green and Tippett1992) to reflect late Cenozoic exhumation along the Fraser Fault.
3. Fission-track analysis
3.a. Methods
Apatite and zircon grains were separated from bulk samples using standard heavy mineral separation techniques. Apatites were mounted in epoxy, polished and etched for 20 seconds in 5.5 molar HNO3 at 21 °C. Zircons were mounted in Teflon®, polished and etched at 228 °C for 3 to 30 hours in a laboratory oven. Randomly selected apatite and zircon grains of all samples were dated with the external detector method, using Durango and Fish-Canyon Tuff age standards for apatite and Buluk and Fish Canyon Tuff age standards for zircon, together with and IRMM540 glass standards (15 ppm uranium) as neutron fluence monitors during irradiation at the Saclay Research Reactor, Gif-sur-Yvette, France. Mica detectors were etched for 18 minutes in 48 % HF at 20 °C. FT ages were calculated with the BINOMFIT program of Brandon, as described in Ehlers et al. (Reference Ehlers, Chaudhri, Kumar, Fuller, Willett, Ketcham, Brandon, Belton, Kohn, Gleadow, Dunai, Fu, Reiners and Ehlers2005), using zeta calibration factors (Hurford & Green, Reference Hurford and Green1983) of 290.9 ± 14.5 (apatite) and 343.5 ± 6.35 (zircon). All samples were counted dry with a BH-2 Olympus microscope and FTStage 4 automated system at 1250× magnification at the FT laboratory in Grenoble.
For apatite of typical Durango composition (0.4 wt % Cl), experimental and borehole data (Green et al. Reference Green, Duddy, Laslett, Hegarty, Gleadow and Lovering1989; Ketcham, Donelick & Carlson, Reference Ketcham, Donelick and Carlson1999) show that over geological time, tracks begin to anneal at a sufficient rate to be measurable above about 60 °C, with complete annealing and total resetting of the apatite FT age occurring between 100 °C and 120 °C. This range (60–120 °C) of temperatures is labelled the apatite FT partial annealing zone. For samples that have undergone moderate to fast cooling at rates of 10–40 °C Ma−1, a closure temperature of 110 ± 10 °C can be reasonably assumed for the most common apatite compositions (e.g. Ketcham, Donelick & Carlson, Reference Ketcham, Donelick and Carlson1999; CLOSURE program of Brandon in Ehlers et al. Reference Ehlers, Chaudhri, Kumar, Fuller, Willett, Ketcham, Brandon, Belton, Kohn, Gleadow, Dunai, Fu, Reiners and Ehlers2005; Reiners & Brandon, Reference Reiners and Brandon2006). In zircon, tracks are stable at higher temperatures. For pristine zircon, annealing over geological time begins at about 250 ± 20 °C, with total resetting occurring above about 310 ± 20 °C (Tagami et al. Reference Tagami, Galbraith, Yamada, Laslett, Van den Haute and De Corte1998), although these temperatures are lower in zircons with high accumulated radiation damage (Brandon, Roden-Tice & Garver, Reference Brandon, Roden-Tice and Garver1998; Rahn et al. Reference Rahn, Brandon, Batt and Garver2004; Garver et al. Reference Garver, Reiners, Walker, Ramage and Perry2005). This translates into a closure temperature of about 280 ± 20 °C for fission tracks in zircon of average radiation damage at moderate cooling rates (Bernet, Reference Bernet2009).
3.b. Results
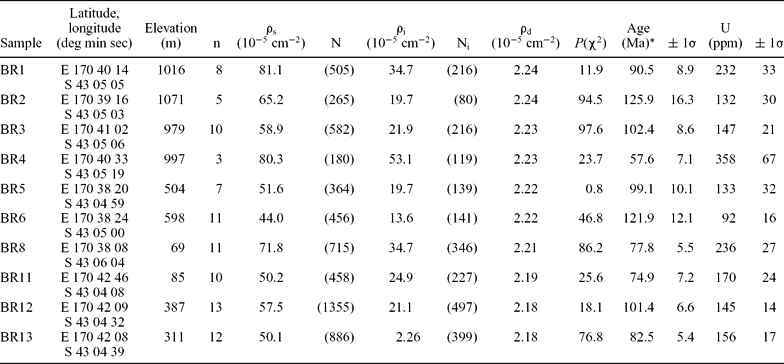
Given the sampled metamorphic lithologies, the quality of apatite and particular zircon grains for FT analysis was relatively poor. Most grains contained fracture inclusions and zoning, and many zircon grains were metamict. Nonetheless, the goal was to date 15 grains per sample, which was possible for most apatite samples but not for the zircon samples. Therefore, of the 13 collected samples only 10 yielded ZFT ages (Table 1, Fig. 4). The track density in our apatite samples is unfortunately too low to allow for sufficient measurements of horizontally confined tracks for time–temperature history modelling. Overall the data are scattered and have large errors, but they do show consistent and interpretable patterns.
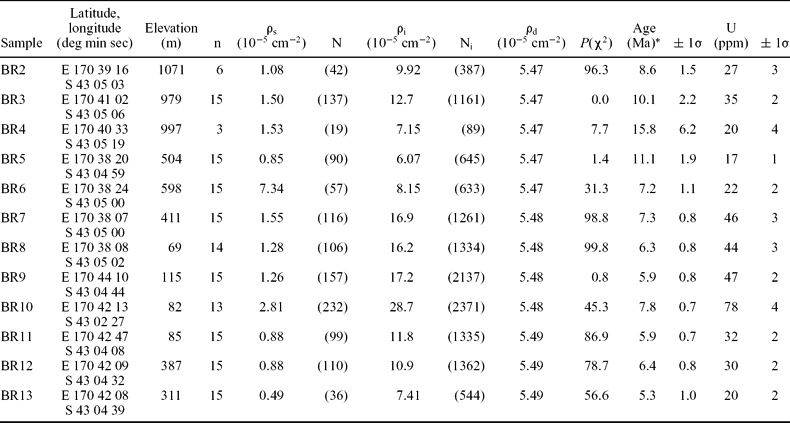
Table 1. Zircon fission-track ages from the Bonar Range
Note: Fission-track age is given as Central Age. Samples were counted dry with a BH-2 Olympus microscope at 1250 × magnification. Ages were calculated with the BINOMFIT program of Brandon (Ehlers et al. Reference Ehlers, Chaudhri, Kumar, Fuller, Willett, Ketcham, Brandon, Belton, Kohn, Gleadow, Dunai, Fu, Reiners and Ehlers2005), using a zeta value of 343.52 ± 6.35 (M. Bernet) and the IRMM 540 uranium glass standard (15 ppm U).
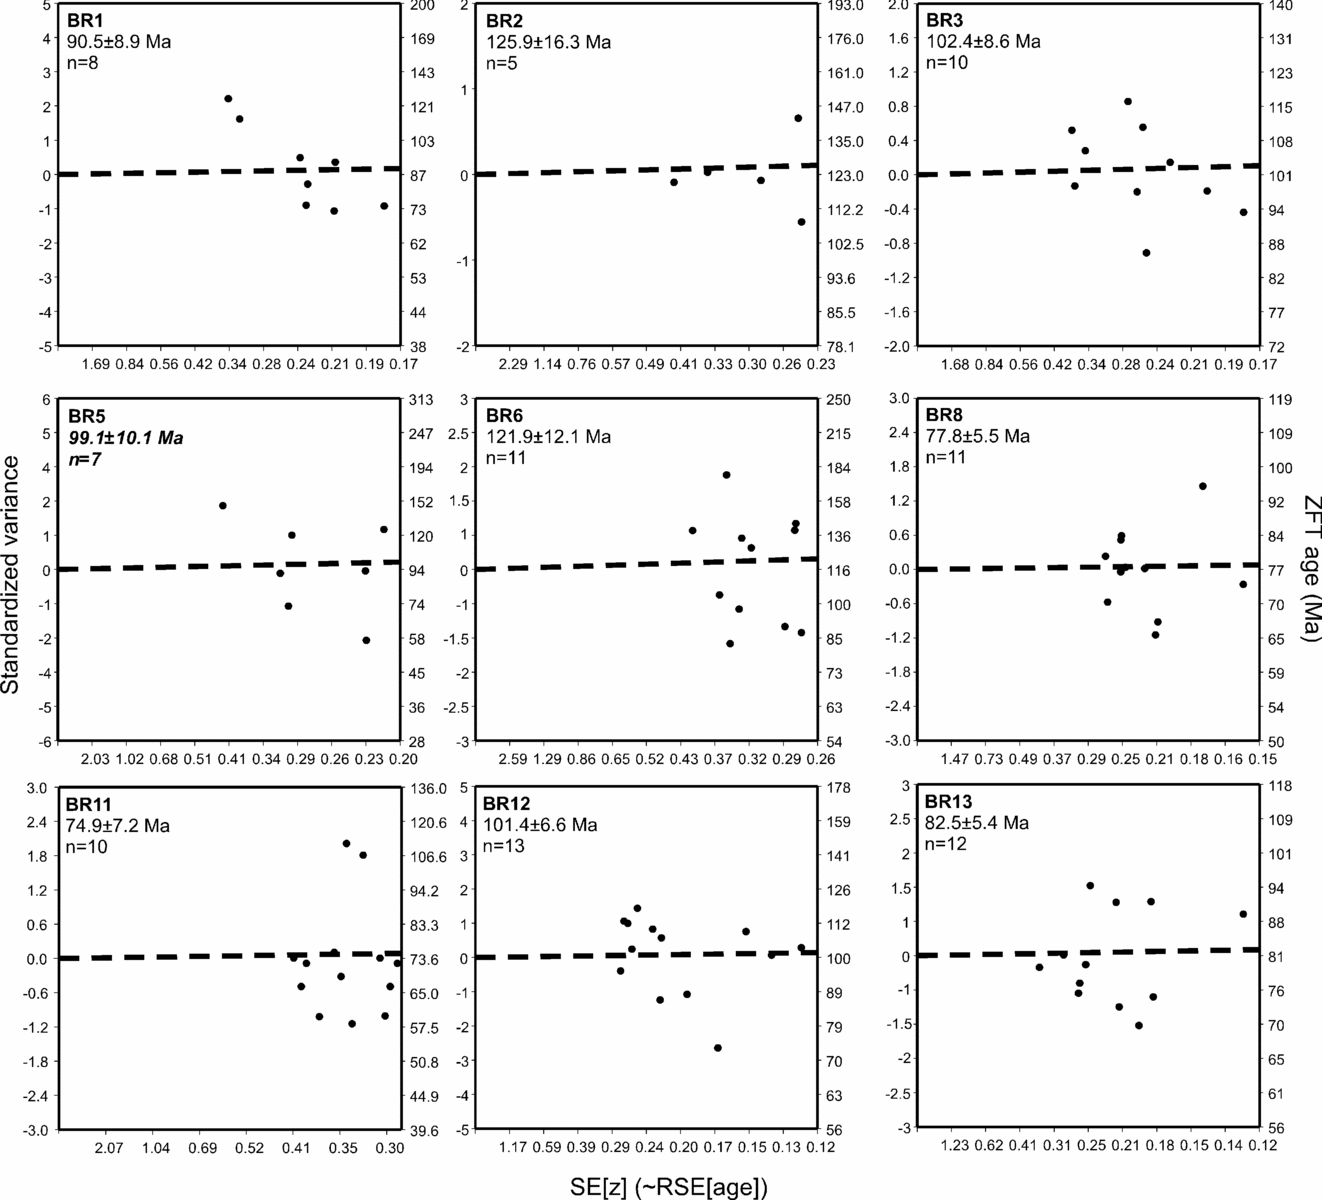
Figure 4. Radial plots of zircon fission-track (ZFT) ages of the Bonar Range. The radial plots show the spread of individual grain ages. The relative standard error is indicated on the X-axis. The Y-axis on the left shows the standard variance of the age determination and the right Y-axis gives the fission-track age. The dashed line shows the central age of the sample.
The age of sample BR4 is based on only three zircons and is not further considered here. The remaining nine samples show a pattern of relatively young ages of 77.8 ± 5.5 Ma and 74.9 ± 7.2 Ma at the low-altitude western and eastern ends of the profile (Fig. 5). The ages become gradually older towards the central high-elevation part of the Bonar Range (90.5 ± 8.9 Ma to 125.9 ± 16.3 Ma) (Fig. 5). The low-altitude samples are very similar in age to low-altitude samples in similar localities reported by White & Green (Reference White and Green1986). Sample BR9 from the hangingwall of the inferred Waitaha fault yielded no zircon and thus a break in ages across the fault cannot be verified.
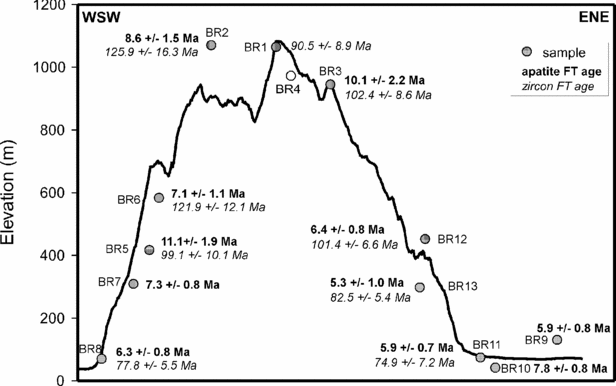
Figure 5. ZFT and AFT ages plotted along ENE–WSW profile across the Bonar Range. Note that the ages show a remarkably symmetric pattern with youngest ages occurring on either side of the profile, and that ages become progressively older towards the central high-elevation part of the Bonar Range.
The 12 AFT ages cluster around 7–5 Ma (Table 2, Fig. 6), with the two samples from the high-elevation central part of the Bonar Range being older (11.1 ± 1.9 Ma and 10.1 ± 2.2 Ma; note that the age of sample BR4 is again based on three apatite grains only and is therefore not being considered). Our AFT ages are similar to the ZFT ages of 10–8 Ma reported by White & Green (Reference White and Green1986) and Kamp, Green & Tippett (Reference Kamp, Green and Tippett1992) from the Fraser Complex.
Table 2. Apatite fission-track ages from the Bonar Range
Note: Fission-track age is given as Central Age. Samples were counted dry with a BH-2 Olympus microscope at 1250 × magnification. Ages were calculated with the BINOMFIT program of Brandon (Ehlers et al. Reference Ehlers, Chaudhri, Kumar, Fuller, Willett, Ketcham, Brandon, Belton, Kohn, Gleadow, Dunai, Fu, Reiners and Ehlers2005), using a zeta value of 290.89 ± 14.49 (M. Bernet) and the IRMM 540 uranium glass standard (15 ppm U).
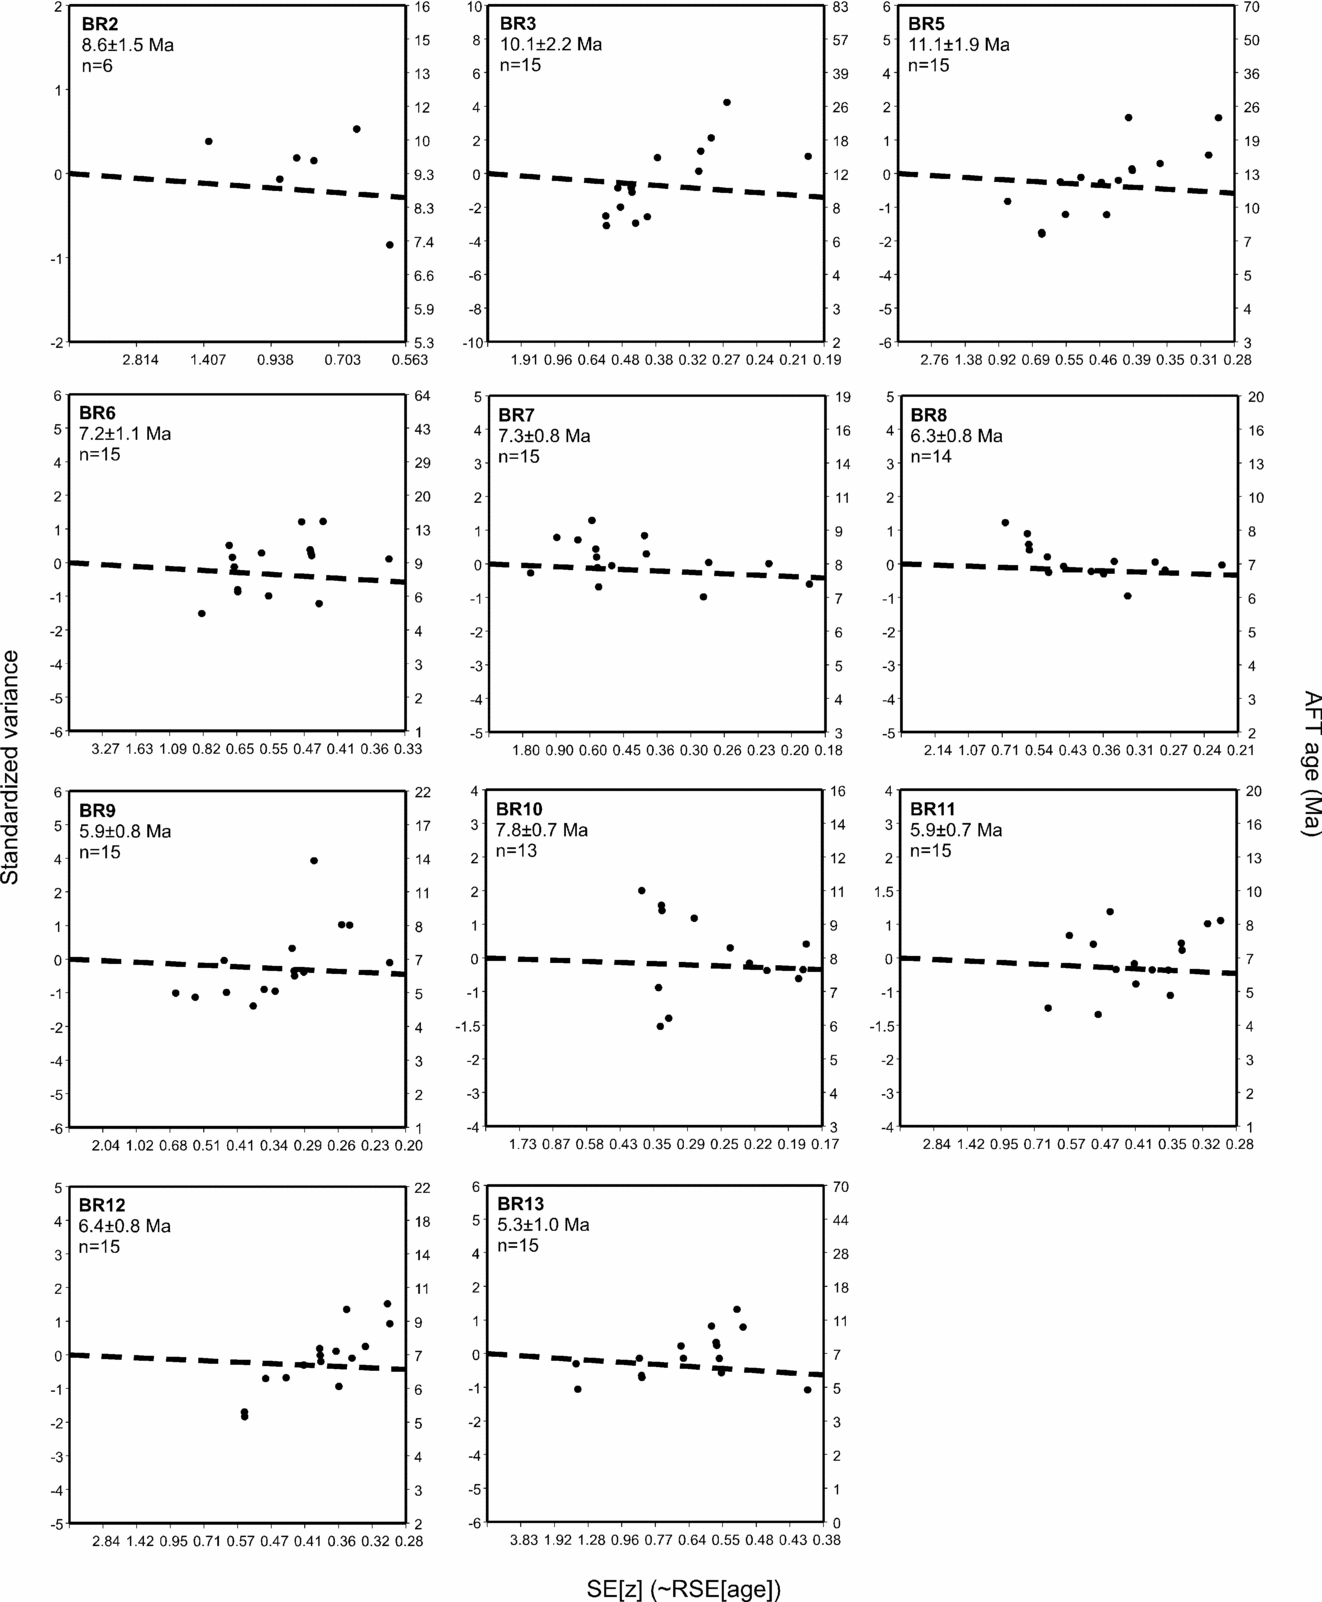
Figure 6. Radial plots of apatite fission-track (AFT) ages of the Bonar Range. The radial plots show the spread of individual grain ages. The relative standard error is indicated on the X-axis. The Y-axis on the left shows the standard variance of the age determination and the right Y-axis gives the fission-track age. The dashed line shows the central age of the sample.
4. Tectonic interpretation
4.a. Zircon fission-track ages
The ZFT ages show a remarkably symmetric pattern (Fig. 7a), which at first glance might be interpreted to suggest bivergent core-complex symmetry or an exhumed partial annealing zone. For the inferred Waitaha fault on the eastern side of the Bonar Range, age–distance relationships of the data would suggest a crude average slip rate of about 0.1–0.2 km Ma−1. For a putative normal fault on the western side of the Bonar Range, age–distance relationships would suggest an even smaller slip rate of less than 0.1 km Ma−1. Slip rates reported from core-complex regions such as the Basin and Range and the Aegean extensional provinces are usually on the order of > 3 to 20 km Ma−1 (Foster & John, Reference Foster, John, Ring, Brandon, Lister and Willett1999; Wells, Snee & Blythe, Reference Wells, Snee and Blythe2000; Gessner et al. Reference Gessner, Ring, Johnson, Hetzel, Passchier and Güngör2001; Ring, Layer & Reischmann, Reference Ring, Layer and Reischmann2001; Kumerics et al. Reference Kumerics, Ring, Brichau and Glodny2005; Brichau et al. Reference Brichau, Ring, Carter and Brunel2006; Brichau, Thomson & Ring, Reference Brichau, Thomson and Ring2010) and are thus, in general, orders of magnitude greater.
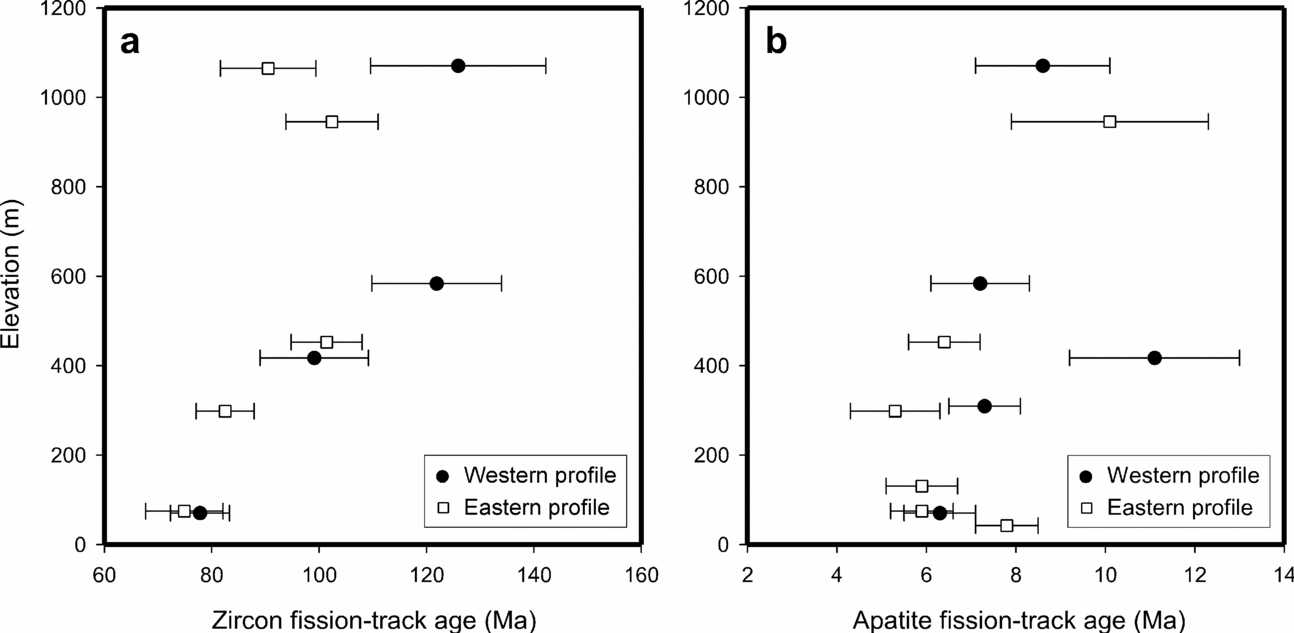
Figure 7. (a) Age–elevation plots for ZFT ages from the western and eastern parts of the Bonar Range. (b) Age–elevation plots for AFT ages from the western and eastern parts of the Bonar Range.
The ZFT age–elevation plots from the western and eastern flanks of the Bonar Range could be interpreted to depict an exhumed partial annealing zone, at least for the samples up to 600 m elevation (Fig. 7a). However, this would be a rather thin ZFT partial annealing zone of less than 600 m thickness with an exceptionally high palaeo-thermal gradient of over 80 °C km−1 for common orogenic cooling rates. If the lowermost samples indeed reflected an exhumed partial annealing zone, resetting would have occurred up to at least 75 Ma, assuming that the lowest samples mark the base of the partial annealing zone.
While acknowledging the possibility of partial resetting to some degree of the lowermost samples, we prefer discussing the results to present a reasonably well-defined linear trend (Fig. 7a). This linear trend translates into time-averaged exhumation rates of 50–100 m Ma−1 (assuming pre-exhumation geothermal gradients of 20–30 °C km−1 and, because of the slow exhumation rates, insignificant upward advection of the geotherms). These slow rates are again many orders of magnitude slower than the exhumation rates from footwalls of core complexes, which are typically on the order of 3000 m Ma−1 or more (Miller et al. Reference Miller, Dumitru, Brown and Gans1999; Ring et al. Reference Ring, Johnson, Hetzel and Gessner2003; Kumerics et al. Reference Kumerics, Ring, Brichau and Glodny2005; Thomson et al. Reference Thomson, Ring, Brichau, Glodny, Will, Ring and Wernicke2009). Based on the very slow rates, we suggest that the Bonar Range is not a Late Cretaceous core complex.
If this interpretation is accepted, then the inferred fault in the NW-trending Waitaha River valley cannot be a Late Cretaceous extensional detachment. It seems more likely that the juxtaposition of the amphibolite-facies gneisses of the Bonar Range with low-grade Greenland Group sediments is due to late Cenozoic faulting. We consider it likely that a NE-dipping normal fault running parallel to the Waitaha River formed during dextral strike-slip along the NNE-striking Alpine Fault. This NE-dipping normal fault would then have juxtaposed the weakly metamorphosed Greenland Group sediments with the Bonar Range amphibolite-facies gneisses. Whether or not the inferred Waitaha River normal fault had an early Tertiary ‘Challenger Rift system’ precursor or actually had its main movement during this time remains speculative.
Furthermore, we interpret the very slow rates inferred from the ZFT ages to be inconsistent with an active tectonic setting between c. 125 and 75 Ma. The exhumation rate of 50–100 m Ma−1 is probably due to very slow erosion. Landscapes in active, reasonably well-drained mountain belts have long-term erosion rates greater than 500–1000 m Ma−1 (Montgomery & Brandon, Reference Montgomery and Brandon2002; Ring, Reference Ring2008), which are an order of magnitude greater than the one for the Cretaceous Bonar Range. At the lower end of the age spectrum at c. 125 Ma, the Bonar Range was part of a magmatic arc that was tectonically thickening in other parts of the South Island, such as Fiordland (Fig. 2; Hollis et al. Reference Hollis, Clarke, Klepeis, Daczko and Ireland2003; Flowers et al. Reference Flowers, Bowring, Tulloch and Klepeis2005). It appears that crustal thickening within the Cretaceous magmatic arc did not affect the entire arc in a uniform fashion and the Bonar Range apparently represents a part of that arc that was largely inactive in the Cretaceous and eroded very slowly until at least 75 Ma. The total exhumation in the Bonar Range was about 3 km between Late Cretaceous and Late Miocene times.
Batt et al. (Reference Batt, Kohn, Braun, McDougall, Ireland, Ring, Brandon, Lister and Willett1999) have suggested an interval between 81 and 68 Ma characterized by localized anatectic partial melting at depth, which may have been related to the formation of the Paparoa basin. It is likely that this event resulted in higher than normal heat flow and thermal resetting of ZFT ages (Garver & Kamp, Reference Garver and Kamp2002). If so, the ZFT ages from below about 600 m elevation may actually reflect Late Cretaceous partial resetting and thus the lower part of the ZFT age–elevation profile may indeed represent an exhumed partial annealing zone. Therefore, one could speculate that part of our samples show a link to the Paparoa basin and an 81–68 Ma thermal event. If the lower elevation ZFT ages are indeed partially reset, then our slow Cretaceous cooling interpretation would be slightly weakened. However, the exhumation rate would only be marginally greater and still nowhere near the typical core-complex-style exhumation rates.
The protomylonites in the Bonar Range must pre-date the ZFT because the activation temperatures for quartz ductility of 270–280 °C are slightly above the closure temperature of fission tracks in zircon (Reiners & Brandon, Reference Reiners and Brandon2006; Brichau et al. Reference Brichau, Ring, Carter and Brunel2006; Bernet, Reference Bernet2009). Therefore, protomylonitization must have occurred prior to c. 125 Ma.
Kamp, Green & Tippett (Reference Kamp, Green and Tippett1992) reported ZFT ages from northern Westland, which range between 419 Ma and 0.6 Ma. ZFT ages decrease to the east, which is strongly correlated with proximity to the Fraser and Alpine faults (Kamp, Green & Tippett, Reference Kamp, Green and Tippett1992, fig. 12). Our ZFT ages fit very well into the age pattern reported by Kamp, Green & Tippett (Reference Kamp, Green and Tippett1992).
4.b. Apatite fission-track ages
The AFT ages show trends basically similar to those of the ZFT ages. The age pattern is fairly symmetric (Fig. 5) and an age–elevation plot (Fig. 7b) shows a linear trend suggesting an exhumation rate of c. 200 m Ma−1 in the Late Miocene. This Miocene exhumation rate is slightly smaller than rates of 400–1200 m Ma−1 reported by Kamp, Green & Tippett (Reference Kamp, Green and Tippett1992) for different parts of north Westland to the northwest of the Alpine Fault.
Our bedrock AFT ages of 7–5 Ma from the Bonar Range are very similar to the youngest peak in detrital ZFT ages of 6.5 Ma from the Hokitika River (Garver & Kamp, Reference Garver and Kamp2002). Following Garver & Kamp (Reference Garver and Kamp2002), we propose that this age represents the timing of significant cooling/exhumation associated with a major phase of uplift and erosion of the central part of the Southern Alps. Our oldest AFT ages of c. 11 Ma from the top of the Bonar Range might reflect the very early stages of Southern Alps uplift and erosion. Total exhumation from the Late Miocene to the present is then on the order of 2 km.
Kamp, Green & White (Reference Kamp, Green and White1989) showed that erosional exhumation of the Southern Alps in the hangingwall of the Alpine Fault occurred at very rapid rates of 5–10 km Ma−1. Our exhumation rates from the Bonar Range are more than an order of magnitude smaller. This significant difference is thought to be due to the location of the Bonar Range in the footwall of the Alpine Fault and also in the footwall of the Fraser Fault. Our AFT ages suggest onset of uplift and exhumation at about 11 Ma, a figure that is comparable with the one derived by Kamp, Green & Tippett (Reference Kamp, Green and Tippett1992).
However, these relatively old AFT ages (> c. 11–5 Ma) occur only in the footwall of the Alpine Fault. Directly above the Alpine Fault, AFT ages are generally younger than 5 Ma, in some cases < 1 Ma (Kamp, Green & White, Reference Kamp, Green and White1989). We interpret this pattern to reflect that initial cooling as a response of crustal thickening and erosion from c. 11 to c. 5 Ma was widely distributed and is now documented in the AFT ages from the footwall of the Alpine Fault (Fig. 8a). After about 5 Ma, enough topography in the Southern Alps was created to establish a sustained rainshadow effect, which caused pronounced precipitation and erosion on the western side of the Southern Alps (Fig. 8b). Strong erosion basically pinned deformation and erosion in the Southern Alps above the Alpine fault and therefore concentrated exhumation and cooling to the areas in the hangingwall of the Alpine Fault. As a result, hardly any tectonic activity and cooling occurred in its footwall.
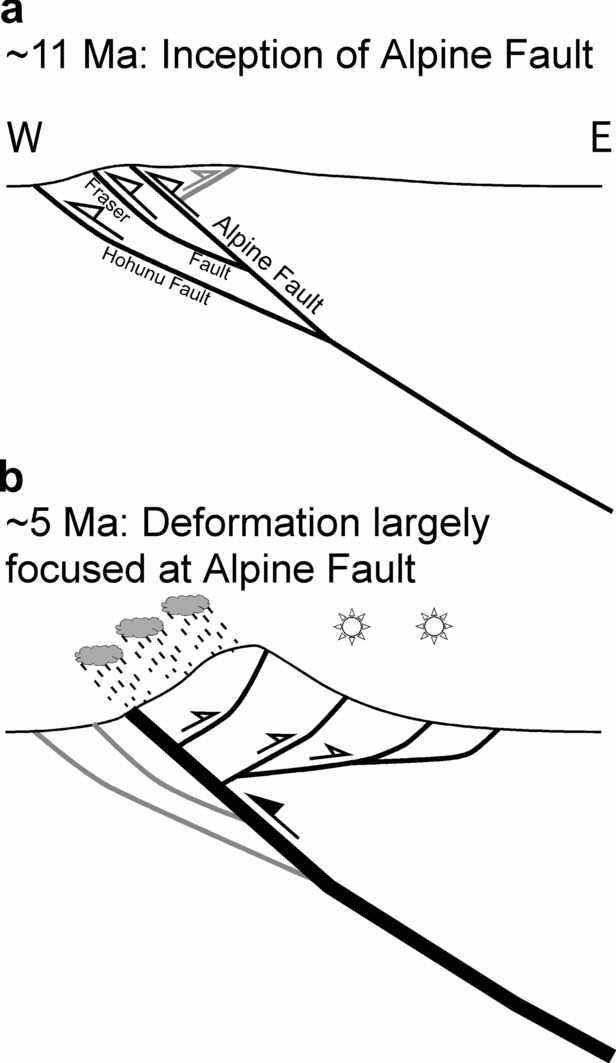
Figure 8. (a) Inception of the Alpine Fault and associated thrust faults at about 11 Ma. No pronounced topography had developed at this stage and our AFT ages suggest moderate erosionally controlled exhumation rates of about 200 m Ma−1. Thrusts in grey are inferred to be largely inactive. (b) At c. 5 Ma enough topography had developed in the Southern Alps to create a sustained rainshadow effect that in turn controlled the orographically controlled tectonic development of the Southern Alps by localizing more than 80 % of the current relative plate motion at the Alpine Fault.
An age of c. 5 Ma for the formation of pronounced topography in the Southern Alps is in accord with the estimate Chamberlain & Poage (Reference Chamberlain and Poage2000) derived from stable-isotope analysis. Nonetheless, based on the plate motion analysis by Cande & Stock (Reference Cande and Stock2004) and Furlong & Kamp (Reference Furlong and Kamp2009) for the Southern Ocean, we do not believe that pronounced topography in the Southern Alps resulted from a change in relative plate motion from strike-slip to oblique convergence. In line with the work by Cande & Stock (Reference Cande and Stock2004), we rather suggest that crustal thickening and erosion in the Southern Alps commenced by about 11 Ma and that at about 5 Ma, a topographic threshold was established that allowed the development of a rainshadow effect that in turn controlled, at least in part, the growth of the Southern Alps. We also note that the relative plate motion of the Pacific Plate relative to the Australian Plate increased by about 5 Ma (Furlong & Kamp, Reference Furlong and Kamp2009), which might be causally linked to increased erosion and the consequent tectonic adjustments in the Southern Alps.
5. Conclusions
ZFT ages from the Bonar Range in Westland, New Zealand, show a rather large age spread from 121.9 ± 12.1 Ma to 74.9 ± 7.2 Ma (1σ errors). If the ZFT ages are unreset, age–elevation relations indicate a slow exhumation rate of 50–100 m Ma−1, which we relate to slow erosion of a tectonically inactive area in the Cretaceous. The main significance of the paper is that it demonstrates that not all of 110–90 Ma Zealandia was necessarily participating in extreme core complex-related extension but that there were enclaves of lithosphere that underwent slow erosion. This modifies the picture of 110–90 Ma Zealandia that is usually envisaged to be characterized by widespread extensional and magmatic activity.
Miocene AFT ages range from 11.1 ± 1.9 Ma to 5.3 ± 1.0 Ma. Age–elevation relationships suggest a slightly faster exhumation rate of about 200 m Ma−1. We relate the AFT ages to the inception of transpressive motion across the Alpine Fault and suggest that significant topography and a rainshadow effect was established by c. 5 Ma. The Bonar Range was exhumed from about 5 km depth from the beginning of Cretaceous times.
Acknowledgements
Funded by the Brian Mason technical trust. We thank Richard Jongens for a joint field trip and Peter Kamp and Nick Mortimer for constructive reviews.


