Introduction
Folvikite is a new Sb-bearing oxyborate mineral of the ‘pinakiolite group’ of Strunz and Nickel (Reference Strunz and Nickel2001). It was found at the Kitteln mine of the Nordmark ore field, north of Filipstad, Värmland, Sweden (59°49'59’’N, 14°05'59’’E). The Kitteln mine is also the type locality for the Sb-bearing oxyborate blatterite (Raade et al., Reference Raade, Mladeck, Din, Criddle and Stanley1988; Cooper and Hawthorne, Reference Cooper and Hawthorne1998).
The mineral is named after Harald O. Folvik (born 1941). Mr. Folvik is a prominent Norwegian amateur mineralogist who has a particular interest in Långban-type deposits and is a member of The Långban Society. The mineral described here was noticed initially by him, and he collected the specimens that were used in this work. Both the mineral and the name have been approved by the Commission on New Minerals, Nomenclature and Classification of the International Mineralogical Association (IMA2016-026). The polished mount used for electron probe microanalysis is kept at the Natural History Museum, University of Oslo, Norway (catalogue number 43574). The crystal used for the structural study, powdered material used for IR spectroscopy and subsequent powder X-ray diffraction and the rock piece that yielded this material were deposited at the Canadian Museum of Nature, Ottawa (catalogue number CMNMC 87087).
Occurrence
The mines of the Nordmark ore field (Magnusson, Reference Magnusson1929) were essentially worked for iron ore. Manganese ores were produced from two small mines: Östra Mossgruvan and Kitteln. The manganese ore at Östra Mossgruvan, originally mined for iron, was discovered in 1876 and consisted mainly of hausmannite with grains of manganosite (Sjögren, Reference Sjögren1876, Reference Sjögren1878). Production of manganese ore at the Kitteln mine, also at first mined for iron, began in 1887, and the ore was similar to that from Östra Mossgruvan (Sjögren, Reference Sjögren1887).
The folvikite-bearing rock material in the Kitteln mine, as well as the blatterite-bearing material, was evidently dumped there from elsewhere. In the description of blatterite, Brattforsgruvan was tentatively suggested as the most probable source, based on the fact that katoptrite occurs with blatterite at Kitteln, and Brattforsgruvan is the type locality of that mineral. However, manganese ore has not, as far as we know, been reported from Brattforsgruvan, and Östra Mossgruvan is more likely to be the source. The distance between Kitteln and Östra Mossgruvan is only ~130–140 m. It is also conceivable that the backfill originates from the Kitteln mine itself. Considering this uncertainty, the Kitteln mine, where the material was collected, should be regarded as the type locality of both blatterite and folvikite.
Associated minerals
Folvikite occurs embedded in calcite. Other minerals identified in the assemblage are hausmannite, tegengrenite and a Mg-dominant analogue of sonolite or jerrygibbsite, (Mg,Mn)9(SiO4)4(OH)2; the latter species may occur as inclusions in folvikite. Blatterite and folvikite do not occur together, blatterite being confined to manganosite-bearing ore.
Physical properties
Folvikite forms strongly lustrous, elongate prismatic crystals up to 0.3 mm long. They are commonly striated along their length due to twinning by 180° rotation about c*; an aggregate, 0.1 mm wide, of five parallel individuals, was reported by Raade and Folvik (Reference Raade and Folvik2013). Crystals are elongated along [010] with indeterminate interpenetrating {h0l} forms (Fig. 1). Folvikite is black to dark reddish-brown with a reddish-brown streak. It has a submetallic lustre and the diaphaneity is generally opaque except at thin edges where the colour is dark red-brown. Cleavage and parting were not observed, folvikite is brittle and has conchoidal fracture. Mohs hardness is 6, and folvikite does not luminesce in ultraviolet light. The calculated density is 4.14 g/cm3 (from the empirical formula). Folvikite is biaxial with indeterminate optic sign due to pervasive twinning. The optical axial angle was measured with a spindle stage using the program Excalibr2 (Bartelmehs et al., Reference Bartelmehs, Bloss, Downs and Birch1992) and is 68.9(4)°. Refractive indices were not measured; the calculated mean refractive index is 1.85. The long axis of the crystal is parallel to the optic normal and hence Y = b. Strong pleochroism was observed in plane-polarized light: AB = brown (intermediate), OB = dark brown (maximum) and ON = honey brown (minimum).
Fig. 1. Back-scattered electron image of crystals of folvikite; note the interpenetrating forms.
Chemical composition
Crystals were analysed with a Cameca SX100 electron microprobe (EMPA) operated in wavelength-dispersive mode at 15 kV and 15 nA and using a beam diameter of 1 µm. Concentrations of Ca and Ti were below the detection limits of EMPA. The following standards were used: Sb2S3 (Sb), MgO (Mg), pyrophanite (Mn), Al2O3 (Al) and Fe metal (Fe). Boron was analysed by electron counting during crystal-structure refinement (Hawthorne and Grice, Reference Hawthorne and Grice1990), and its presence in the structure was also confirmed by infrared spectroscopy (see below). Lithium is below detection using LA-ICP-MS (laser ablation inductively coupled plasma mass spectrometry). Table 1 gives the chemical composition (mean of seventeen points from three grains). The empirical formula unit, calculated to give a cation sum (excluding B) of 11.74 apfu with B = 4 apfu (atoms per formula unit) is: (Sb5+1.02Mn3+1.34Al0.05Fe3+0.05 Mg5.46Mn2+3.82□0.26)Σ12O8(BO3)4; the simplified formula is Sb5+Mn3+(Mg,Mn2+)10O8(BO3)4 (Z = 1) (see later discussion for justification of this procedure).
Table 1. Chemical composition (wt.%) of folvikite.
Below detection: Ca and Ti (EMPA); Li (LA-ICP-MS);
*calculated to give a cation sum (excluding B3+) of 11.74 apfu;
**calculated to give B3+ = 4 apfu.
Infrared spectroscopy
The Fourier-transform infrared (FTIR) spectrum was collected using a Bruker Hyperion 2000 IR microscope equipped with a liquid-nitrogen-cooled mercury-cadmium-telluride detector. The spectrum in the range 4000–650 cm–1 was obtained by averaging 100 scans with a resolution of 4 cm–1. The infrared spectrum of folvikite is shown in Fig. 2. The spectrum shows no absorption bands in the OH-stretching region (4000–3000 cm–1), which is in accord with the absence of OH groups and H2O in the structure. Absorption bands in the region 1500–900 cm–1 (with strong bands at 1335, 1275 and 1240 cm–1, and medium to low intensity bands at 1124, 948, 934 and 906 cm–1) may be assigned to B–O stretching vibrations of the borate group. Bands at 723 and 666 cm–1 are due to bending modes of the borate group.
Fig. 2. The FTIR spectrum of folvikite.
Powder X-ray diffraction
The powder-diffraction pattern for folvikite was recorded at the Canadian Museum of Nature using a Bruker D8 Discover micro-powder diffractometer with a Hi-Star multi-wire 2D detector at 12 cm, calibrated following Rowe (Reference Rowe2009) and using a pseudo-Gandolfi approach on a powdered sample of folvikite that was crushed using a diamond micro-anvil. The unit-cell dimensions were refined using the program UNITCELL of Holland and Redfern (Reference Holland and Redfern1995). The powder pattern is given in Table 2, together with the refined cell-dimensions which are in close accord with the values derived by single-crystal X-ray diffraction.
Table 2. X–ray powder diffraction pattern** of folvikite.
a = 5.388(2), b = 6.220(2), c = 10.933(3) Å, β = 94.40(3)° and V = 365.27(15) Å3
*Excluded in least–squares refinement; **the subscript SXL denotes single-crystal diffraction data.
The six strongest lines are given in bold.
Crystal structure: data collection, structure solution and refinement
A single (twinned) crystal (5 µm x 6 µm x 40 µm) was attached to a tapered glass fibre and mounted on a Bruker D8 three-circle diffractometer equipped with a rotating anode generator (MoKα X-radiation), multilayer optics and an APEX-II detector. In excess of a Ewald sphere of data was collected to 60°2θ using 26 s per 0.2° frame with a crystal-detector distance of 8 cm. A preliminary evaluation of the diffraction pattern at a crystal-detector distance of 5 cm showed that the crystal contained a significant non-merohedral twin component [twin law: 180° rotation about c*], and the detector was moved back to 8 cm to further enhance resolution of the partly overlapping twin component. Twin integration gave 30,684 total reflections, with 11,869 [component 1], 11,935 [component 2] and 6880 [both components] constituent reflections. The reflections were averaged and merged [R int = 5.8%] to give 1166 reflections (single reflections from the primary domain, plus composites involving both domains) for structure (twin) refinement. The unit-cell dimensions were obtained by least-squares refinement of 7131 reflections with I > 10σI.
An oriented ‘precession’ slice (h0l) was constructed from the raw data frames and is shown in Fig. 3; the diffraction spots from the primary domain (green h0l labelling) are related to the diffraction spots from the twin domain (red h0l labelling) by a 180° rotation about c*. Note the different inter-spot spacing along c* for different values of H; complete overlap occurs for (00l) reflections, and nearly so for (h0l) reflections with H = 3 and –3. All diffraction maxima from the X-ray crystal can be indexed on the small monoclinic cell (5.38 × 6.21 × 10.94 Å) with the inclusion of the twin law. Structure (twin) refinement from 1166 reflections (including 607 composites) gave a final R 1 value of 4.1% (for 1070 observed reflections, |F o| > 4σF). The Flack parameter refined to –0.03(16), indicating a correct absolute structural configuration. The twin volume fraction (i.e. twin contribution to composites) refined to 0.417(2), suggesting a very significant twin fraction (as is indicated on the precession slice in Fig. 3). Miscellaneous information concerning structure solution and refinement is listed in Table 3. Atom positions and displacement parameters are given in Table 4, selected interatomic distances in Table 5, site-scattering values and site assignments in Table 6 and a bond-valence calculation in Table 7. The crystallographic information files have been deposited with the Principal Editor of Mineralogical Magazine and are available as Supplementary material (see below).
Fig. 3. The (h0l) precession layer for folvikite generated from the single-crystal X-ray diffraction data. Twin law = 180° rotation about c*. Primary-domain indexing in green and twin-component indexing in red.
Table 3. Miscellaneous information concerning data collection and structure refinement for folvikite.
R 1 = Σ(|Fo| – |Fc|) / Σ|Fc|
wR 2 = [Σw(F 2o – F 2c)2 / Σw(F 2o)2]1/2, w = 1 / [σ2(F 2o) + (0.0122 P)2 + 3.90 P] where P = (max(F 2o,0) + 2F 2c) / 3
Table 4. Atom positions and equivalent isotropic-displacement parameters (Å2) for folvikite.
Table 5. Selected interatomic distances (Å) in folvikite.
Table 6. Site-scattering values (epfu) and assigned site-populations (apfu).
aSite multiplicity
bAssigned scattering factors
cRefined site-scattering values (epfu)
dAssigned electrons per formula unit [Z = 1]
*Total refined site-scattering over all X sites = 42.8 epfu attributed to (Mn2+1.45Mg0.55)
Table 7. Bond-valence (in valence units) table for folvikite.
*Using the bond-valence parameters of Brown and Altermatt (Reference Brown and Altermatt1985); all bond-valence multipliers (i.e. x2) apply to the summations at the cations; bond valences in bold font are for a simple X(1), X(4) ordered arrangement.
Crystal structure: site assignment and formula normalization
The crystal structure of folvikite contains both positionally ordered M-cations (octahedral coordination), positionally disordered X-cations (coordination numbers [4], [5] and [6]), and ordered BO3 groups. There are eight M-cation sites and five X-cation sites, and all give refined site-scattering values (Hawthorne et al., Reference Hawthorne, Ungaretti and Oberti1995) that suggest multiple occupants at each of these sites. There are primarily five constituents to assign over the thirteen (M + X) sites: Sb5+, Mg2+, Mn2+, Mn3+ and □ (vacancy); we combined the minor Al3+ and Fe3+ contents from the chemical data with Mn3+ on the basis of their similar charge and radii (Shannon, Reference Shannon1976).
As the structure of folvikite contains the same architectural elements as in other zigzag borates (i.e. F- and C-walls; and S-columns; Cooper and Hawthorne, Reference Cooper and Hawthorne1998), we use many of the same general crystal-chemical arguments to help assign cations in the folvikite structure. The M sites in folvikite have refined site-scattering values spanning the range 8.9–41.6 epfu (electrons per formula unit), and a vacancy (□) must be associated with at least one of these sites, as Mg (12 electrons) is the weakest X-ray scattering species present. With a known vacancy present for at least one M-site, and additionally at the positionally disordered X sites, the overall cation sum for folvikite is not fixed. An additional variable involves the partitioning of Mn as Mn2+ and Mn3+. The most feasible approach to normalizing the chemical data therefore involves an anion-normalization scheme [i.e. (BO3)4O8 = 28–], with an assessment of both the vacancy content and the Mn2+/Mn3+ ratio via crystal-chemical arguments from the structure refinement. The M(1) site has the largest refined site-scattering value (41.6 epfu) and the shortest mean bond length (<M(1)–O> = 2.019 Å) of all the M sites and must contain significant Sb5+ (Table 6). Note that there is no Sb3+ present in folvikite, as Sb3+ is a lone-pair stereoactive cation that has very different stereochemistry that we do not observe here (Mills et al., Reference Mills, Christy, Chen and Raudsepp2009). The M(2) site has the lowest refined site-scattering value (8.9 epfu) and a < M(2)–O > distance of 2.119 Å; without knowing the constituent size of a vacancy, or whether there is more than one type of cation present, the simplest assignment to be made for the M(2) site involves Mg + vacancy (Table 6). The next two smallest M-octahedra involve the M(4) and M(5) sites with < M(4)–O> = 2.065 Å and < M(5)–O> = 2.071 Å; the refined site-scattering values for these two sites (~23 epfu), in combination with the observed < M–O > distances, suggest dominant Mn3+. In addition, by comparison with other zigzag borate structures, we expect these edge-sharing [ = M(4) = M(5) =] strips of octahedra within the C-wall to be occupied by Jahn-Teller-distorted Mn3+ octahedra. Most of the pinakiolite-group minerals contain [4 + 2]-distorted Mn3+-bearing octahedra with four short and two long bonds; however in folvikite, the Mn3+ octahedra show [2 + 2 + 2] distortion (i.e. two short, two intermediate and two long bonds) and are occupied by ~33% other cations. This situation is analogous to that of the M(4) octahedron in fredrikssonite (Burns et al., Reference Burns, Cooper and Hawthorne1994) in which a similar [2 + 2 + 2] distortion occurs and the M(4) site is occupied primarily by Mn3+ with ~22% other cations. The cations Mg, Mn2+ and minor Sb5+ were assigned to the remaining M sites [M(3), M(6), M(7) and M(8)] in folvikite in accord with the relative site-scattering values and observed bond lengths. The positionally disordered X sites adjacent to the Jahn-Teller-distorted Mn3+ octahedral strips of the C-wall are considered to be occupied predominately by Mn2+, with subordinate Mg. There are five X sites in total, and we propose maximum occupancy for this region of the structure (i.e. 2 apfu), whereby close X–X′ contacts preclude local mutual occupancy of many X–X′ pairs.
The total refined site-scattering at all (M + X) sites is 247.3 epfu [Z = 1], in good agreement with the scattering value of 248.7 epfu calculated for the chemical formula derived from electron-microprobe analysis. The chemical data were normalized to 20 O2– anions, with 4 B apfu, i.e. [O8(BO3)4] = 28–, with a Mn3+/(Mn3+ + Mn2+) value adjusted to give an [M + X] cation sum of 11.74 apfu [i.e. 12.00–0.26 M(2)□]. The constituent radii for the M-site assignments are plotted against the observed < M–O > distances in Fig. 4, and a linear regression gives < M–O> = 0.834 (r) + 1.497 Å. A similar regression line constructed for the octahedrally coordinated sites in blatterite gave < M–O> = 0.8325 (r) + 1.5060 (Cooper and Hawthorne, Reference Cooper and Hawthorne1998), and the congruency between the two relations supports the site assignments for these two homologous structures. Finally, the incident bond-valence sums at the M sites (Table 7) are in close accord with the aggregate formal charge of the constituent cations at these sites, with a mean deviation of 0.07. Moreover, the incident bond-valence sums at the B sites (Table 7) are in accord with their occupancy by B3+.
Fig. 4. The constituent radii for the M-site assignments versus the observed < M–O > distances for folvikite.
Crystal structure: description
As the structure of folvikite is related closely to the structure of pinakiolite, we describe its relation to its closest structural (and chemical) relative: Sb-rich pinakiolite from Långban, Sweden (Hansen et al., Reference Hansen, Hålenius and Lindqvist1988; Norrestam and Hansen, Reference Norrestam and Hansen1990). Folvikite and Sb-rich pinakiolite share the same style of structural connectivity, but differ in terms of unit cell and space group: folvikite crystallizes in P2 and has a cell volume half that of Sb-rich pinakiolite which crystallizes in C2/m.
F-walls
In the crystal structure of folvikite, M(1), M(2), M(3) and M(6) octahedra share edges to form the F-wall (Fig. 5a), whereas in Sb-rich pinakiolite the F-wall is comprised of M(3) and M(6) edge-sharing octahedra (Fig. 5b). The largest difference between the F-walls of the two structures involves ordering of Sb5+: in Sb-rich pinakiolite, the M(3) site is occupied by Sb5+0.38Mn2+0.32Mg0.30, whereas in folvikite, the comparable octahedron strip has Sb5+ segregated differently between M(1) = (Sb5+0.75Mg0.25) and M(3) = (Mn2+0.44Mg0.40Sb5+0.16) (Table 6). This cation ordering at M(1) and M(3) in folvikite leads to a mean difference in octahedron size that is large enough to be visually discernible (Fig. 5a). Many zigzag-borate minerals bearing significant Sb (i.e. folvikite, Sb-rich pinakiolite and blatterite) have so far shown that all Sb is present as Sb5+ that occupies octahedrally coordinated sites within the F-wall (Norrestam and Hansen, Reference Norrestam and Hansen1990; Cooper and Hawthorne, Reference Cooper and Hawthorne1998). We note here that the Sb2O5 content is essentially the same for both folvikite (18.15 wt.%; Table 1) and Sb-rich pinakiolite (18.09 wt.%; Hansen et al., Reference Hansen, Hålenius and Lindqvist1988).
Fig. 5. The F-wall in: (a) folvikite and (b) Sb-rich pinakiolite. Yellow = (Mg > Mn2+); green = (Mn2+ > Mg); and orange = Sb5+ dominant.
C-walls
The C-walls for folvikite and Sb-rich pinakiolite are shown in Figs. 6a and 6b, with simplified idealized (Mn2+,Mg) octahedra [X(1), X(4) in folvikite; M(4), M(5) in Sb-rich pinakiolite] occupying the disordered region between the Mn3+-dominant strips of octahedra [M(4), M(5) in folvikite; M(1), M(2) in Sb-rich pinakiolite]. Although there are differences between the individual sites of the two structures (e.g. details of Jahn-Teller polyhedron distortions, Mn3+ content, Mn2+/Mg ratio, occupancy of positionally disordered sites), the basic chemical prevalence at analogous sites is similar: the Jahn-Teller-distorted octahedra [M(4), M(5) in folvikite; M(1), M(2) in Sb-rich pinakiolite] are dominated by Mn3+, and the intervening disordered cations [X(1) to X(5) in folvikite; M(4), M(5), M(45) in Sb-rich pinakiolite] are dominantly (Mn2+ > Mg), although folvikite is significantly enriched in Mn2+ relative to Sb-rich pinakiolite.
Fig. 6. The C-walls in: (a) folvikite and (b) Sb-rich pinakiolite. Blue = Mn3+ dominant and green = (Mn2+ > Mg).
S-columns
The S-columns in both folvikite [M(7) and M(8)] and Sb-rich pinakiolite [M(7)] are dominated by Mg octahedra; however, folvikite contains ~⅔ Mg + ~⅓ Mn2+ at these octahedra, compared to octahedra fully occupied by Mg in Sb-rich pinakiolite.
Connectivity
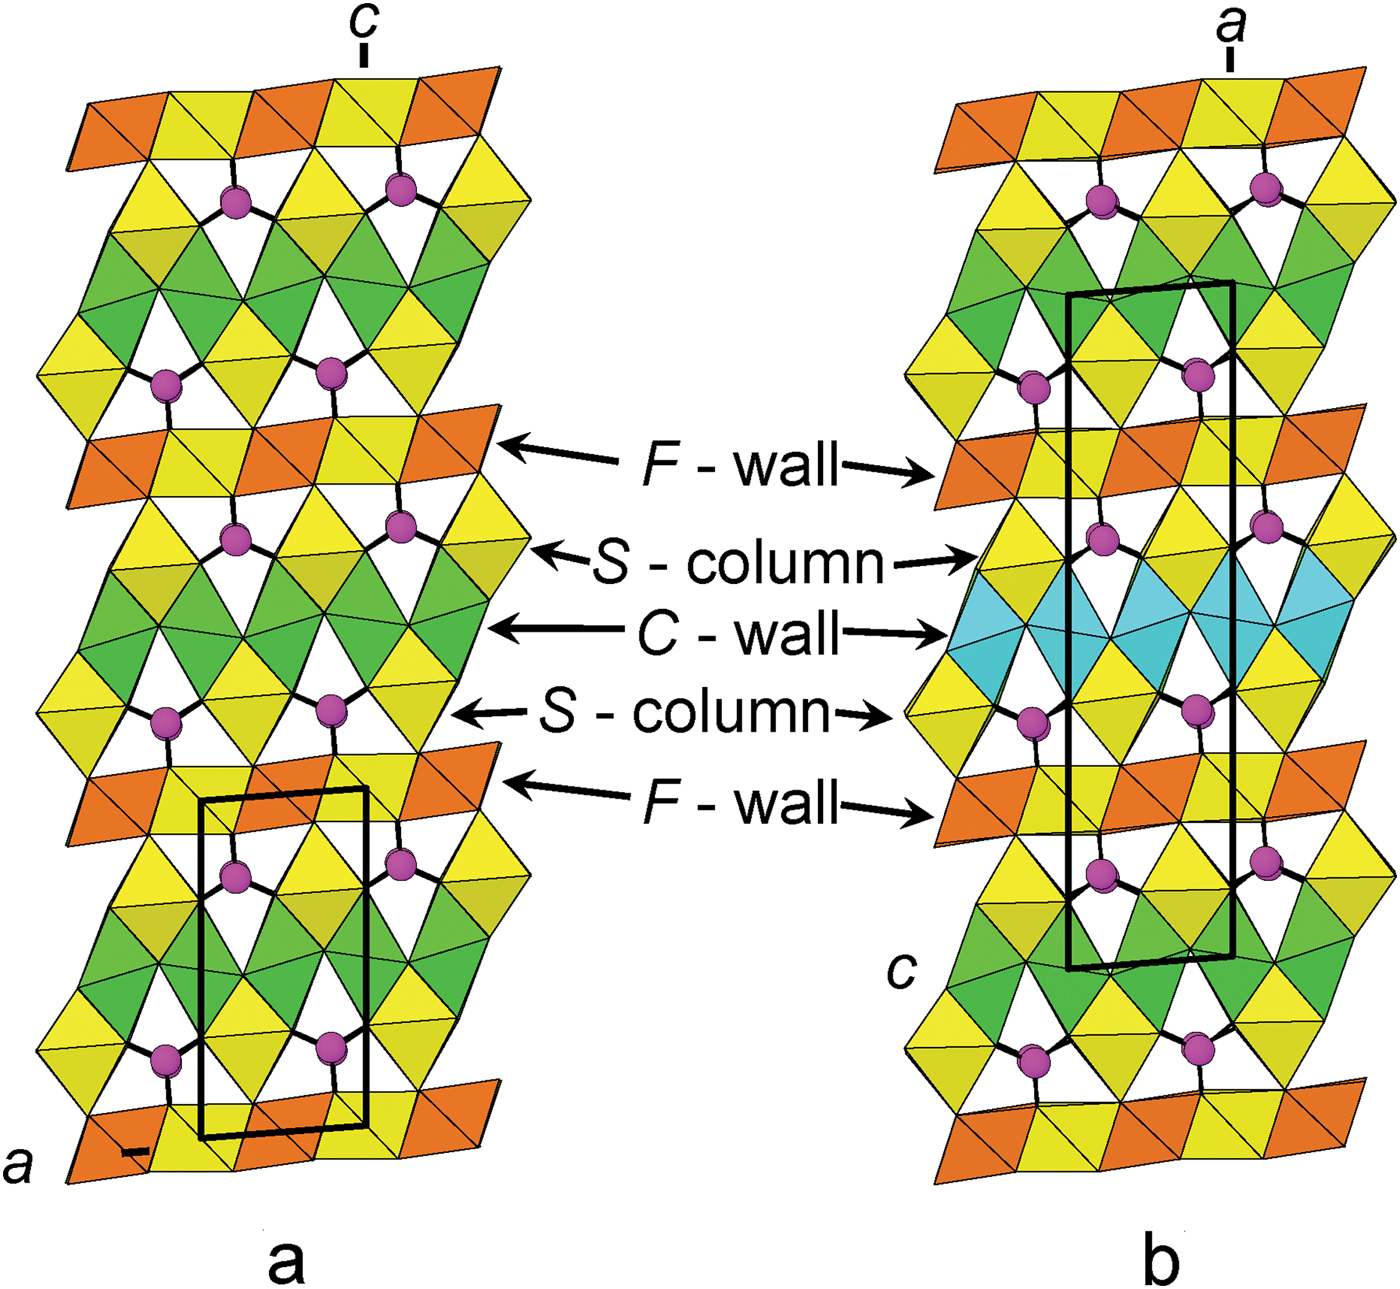
The connectivity between F-walls, C-walls, S-columns and BO3 groups is shown in Fig. 7 for folvikite (Fig. 7a) and Sb-rich pinakiolite (Fig. 7b). The general topology is the same for both minerals. The unit-cell translation ‘up-the-page’ for folvikite is ½ that of Sb-rich pinakiolite. In Sb-rich pinakiolite, successive C-walls along [100] are displaced by ½y relative to each other, such that Mn3+ octahedral strips alternate with disordered Mn2+–Mg strips in a given (010) section (Fig. 7b). In folvikite, successive C-walls along [001] are not offset from each other in the (010) plane. Note that the M(1)Sb5+–M(3)Mn2+ ordering within the F-wall of folvikite is not apparent in Fig. 7a because only M(1)Sb5+ octahedra are present at the (010) level shown (cf. Fig. 5a).
The chemical formula of pinakiolite, Sb-rich pinakiolite and folvikite
Pinakiolite
The IMA Master List [http://nrmima.nrm.se//imalist.htm], gives the formula for pinakiolite as (Mg,Mn)2(Mn3+,Sb5+)O2BO3, which is conveniently collapsed to a compact O2(BO3) anion component (Z = 8). However, this formula lacks utility for Sb-bearing pinakiolites, as the Sb5+ content must be zero in order to maintain charge balance. The pinakiolite structure contains seven cation sites (other than B), of which three Mn(1–3) are clearly occupied by dominant Mn3+ and four Mg(1–4) by dominant Mg, providing Mn3+Mg2 pfu (Moore and Araki, Reference Moore and Araki1974). The empirical formula for pinakiolite given by Moore and Araki (Reference Moore and Araki1974) is:
The pinakiolite formula can be written as Mn3+(Mg,Mn2+)2O2(BO3) (Z = 8) for Sb-free pinakiolite.
Sb-rich pinakiolite
In Sb-rich pinakiolite, the M(3) site occupancy is reported as (Sb0.38Mn0.32Mg0.30) with Sb dominant at the site. However, it was stated that the Mn and Mg contents at M(3) were not determined reliably (Norrestam and Hansen, Reference Norrestam and Hansen1990). The M(3) site has a < M(3)–O > distance of 2.05 Å, and applying our general relation between bond length and constituent radii < M–O> = 0.834(r) + 1.497 from folvikite, gives a constituent radius of 0.66 Å for the M(3) site in Sb-rich pinakiolite, which can be regarded as a good approximation for this homologous structure. Thus, the relatively short < M(3)–O > distance of 2.05 Å is not compatible with significant occupancy by the larger Mn2+ cation (0.83 Å radius, Shannon, Reference Shannon1976), and any Mn content must be dominated by Mn3+ (0.645 Å radius), as in pinakiolite. The individual M(3)–O bond lengths show very little variation in Sb-rich pinakiolite, and as Mn3+ is expected to induce bond-length distortions associated with Jahn-Teller effects, the absence of such a distortion indicates little or no Mn3+ at the M(3) site. The site occupancy reported for M(3) by Norrestam and Hansen (Reference Norrestam and Hansen1990) is (Sb0.38Mn0.32Mg0.30) which corresponds to a site-scattering of 30.98 electrons per site. If we exclude Mn from the M(3) site, this site-scattering value is concordant with the site occupancy (Mg0.51Sb0.49) which has an aggregate ionic radius of 0.66 Å. We therefore suggest that only Sb5+ and Mg are present at M(3), and that all Mn3+ fully occupies the M(1) and M(2) sites, resulting in Mn3+0.5 pfu (Z = 8). The Sb-rich pinakiolite formula calculated using the electron-microprobe results of Hansen et al. (Reference Hansen, Hålenius and Lindqvist1988) with B = 1, Mn3+ = 0.5 and 5 anions pfu (Z = 8) gives:
The Sb5+0.238 content (pfu; Z = 8), if entirely ordered at the M(3) site, would result in an Sb5+ site-occupancy of 0.476, which is in good agreement with the (Mg0.51 Sb0.49) site occupancy proposed above. Sb-rich pinakiolite is derived from pinakiolite via Sb5+ + Mg replacing Mn3+ at the M(3) site, with additional homovalent Mn2+ → Mg substitution occurring at the disordered M sites within the C-wall. An M(3) site fully occupied by Mn3+ (i.e. pinakiolite) would require substitution by ⅓ Sb5+ + ⅔ Mg to maintain charge balance, but the proposed M(3) site content of ~ Sb0.5 exceeds this value, and an additional heterovalent substitution at another site(s) is required to achieve charge balance; this might involve divalent cations (Mn2+, Mg) at the trivalent (Mn) M(1) and M(2) sites, and/or vacancies at the disordered M(4,45,5) sites within the C-wall. If we constrain the Sb5+ to occur at M(3) in subordinate fashion following the exchange ⅓ Sb5+ + ⅔ Mg → Mn3+, we can convey the difference between pinakiolite and Sb-rich pinakiolite in the formula unit by reducing the Z value to 4, as shown in Table 8. The F-wall contains the M(3) and M(6) sites, the C-wall contains the ordered M(1) and M(2) sites and the disordered M(4–5) sites, and the S-column contains the M(7) site.
Table 8. The differences between the M sites in Sb-rich pinakiolite and pinakiolite.
Folvikite
The P2 structure of folvikite contains a distinct Sb-dominant site, and the empirical formula (Sb5+1.02Mn3+1.34Mg5.46Mn2+3.82Al0.05Fe3+0.05□0.26)Σ12O8(BO3)4 can be simplified to Sb5+Mn3+(Mg,Mn2+)10O8(BO3)4 (Z = 1) to show the Sb5+ site-dominant character. In comparing folvikite with Sb-rich pinakiolite: (1) both have similar Sb2O5 content; (2) folvikite contains less Mn2O3 and MgO, but more MnO, relative to Sb-rich pinakiolite.
As is apparent from the above discussion, folvikite and Sb-rich pinakiolite are structurally and chemically quite similar; Table 9 compares selected properties of these two minerals. However, their habit and colour are quite distinct. Folvikite occurs as striated prisms whereas Sb-rich pinakiolite occurs as tabular platy crystals. Moreover, folvikite is black to reddish brown whereas Sb-rich pinakiolite is light olive-green to yellow-brown; presumably the additional Mg in Sb-rich pinakiolite serves to inhibit charge-transfer effects between heterovalent transition-metals.
Table 9. Comparison of selected properties for folvikite and Sb-rich pinakiolite.
* Mn3+ / (Mn2+ + Mn3+) adjusted to provide Mn3+ = 1 apfu; ** calculated using B = 4 (folvikite) and B = 2 apfu (Sb-rich pinakiolite).
Acknowledgements
Muriel Erambert assisted with the electron microprobe analysis, and the SEM BSE image was captured by Harald Folvik. We thank an anonymous referee, Tony Kampf, Pete Leverett and Principal Editors Peter Williams and Stuart Mills for their helpful comments on this paper. This work was supported by a Discovery grant from the Natural Sciences and Engineering Research Council of Canada and by grants from the Canada Foundation for Innovation to FCH.
Supplementary material
To view supplementary material for this article, please visit https://doi.org/10.1180/minmag.2017.081.059