


Osteopontin (OPN) is a multifunctional integrin binding phospho-glycoprotein involved in a wide range of physiological processes such as bone mineralization and remodeling, tissue transformations and immune modulation (Christensen and Sørensen, Reference Christensen and Sørensen2016; Lok and Lyle, Reference Lok and Lyle2019). OPN is synthesized by a variety of cell types and is present in most tissues and body fluids, with by far the highest levels reported in human milk (Schack et al., Reference Schack, Lange, Kelsen, Agnholt, Christensen, Petersen and Sørensen2009a; Bruun et al., Reference Bruun, Jacobsen, Ze, Husby, Ueno, Nojiri, Kobayashi, Kwon, Liu, Yan, Yang, Zachariassen, Chen, Zhou, Christensen and Sørensen2018). The amino acid sequences of bovine and human OPN are very similar and all important structural elements such as the integrin binding sequences, sites for post-translational modifications and regulatory proteolytic cleavage sites are conserved between the two species (Christensen and Sørensen, Reference Christensen and Sørensen2016). In human and bovine milk, OPN is extremely heterogeneously phosphorylated and O-glycosylated and consequently exists in many different isoforms (Sørensen et al., Reference Sørensen, Højrup and Petersen1995; Christensen et al., Reference Christensen, Nielsen, Haselmann, Petersen and Sørensen2005). Furthermore, it has been shown to form complexes with other milk proteins (Azuma et al., Reference Azuma, Maeta, Fukuchi and Kanno2006; Yamniuk et al., Reference Yamniuk, Burling and Vogel2009). In addition, in bovine milk, OPN is present both as the intact full-length protein (constituting approximately 25% of the total amount) and as a group of N-terminal-derived fragments (75%), primarily consisting of residues 1–151 resulting from proteolysis in the milk (Christensen and Sørensen, Reference Christensen and Sørensen2014). The C-terminal fragment consisting of residues 152–262 is presumably degraded by milk proteases (Christensen and Sørensen, Reference Christensen and Sørensen2014).
The role of OPN in milk is not well defined, but studies suggest that it plays a role in immunological processes and development in infants. OPN has been shown to possess cytokine-like properties and regulate the Th1/Th2-type cytokine balanced immune response (Ashkar et al., Reference Ashkar S, Panoutsakopoulou V, Sanchirico, Jansson, Zawaideh, Rittling, Denhardt, Glimcher and Cantor2000), induce the expression of interleukin-12 from intestinal mononuclear cells (Schack et al., Reference Schack, Lange, Kelsen, Agnholt, Christensen, Petersen and Sørensen2009a,) and mark bacteria for opsonization by immune cells (Schack et al., Reference Schack, Stapulionis, Christensen, Kofod-Olsen, Skov Sørensen, Vorup-Jensen, Sørensen and Höllsberg2009b). OPN is relatively resistant to proteolysis by gastric juices (Chatterton et al., Reference Chatterton, Rasmussen, Heegaard, Sørensen and Petersen2004) and a bioactive fragment consisting of residues Trp27-Phe151 has been shown to resist simulated gastrointestinal digestion in a form that enables interaction with integrins (Christensen et al., Reference Christensen, Karlsen, Jørgensen, Jacobsen, Ostenfeld, Petersen, Müllertz and Sørensen2020), suggesting a mechanism for the beneficial effects of orally administered OPN reported in intervention studies.
Supplementation of formulas with bovine milk OPN shifts the intestinal gene expression in infant rhesus monkeys significantly towards that found in breast-fed infants (Donovan et al., Reference Donovan, Monaco, Drnevich, Kvistgaard, Hernell and Lönnerdal2014). Likewise, a clinical trial with human infants administered formula supplemented with bovine milk OPN showed significantly reduced levels of pro-inflammatory cytokines and fewer days of fever compared with infants fed regular formula (Lönnerdal et al., Reference Lönnerdal, Kvistgaard, Peerson, Donovan and Peng2015). Thus, it is hypothesized that milk OPN provides an important immunological signal to the infant during development and bovine milk OPN is now marketed as an ingredient for use in infant formulas.
In cattle, OPN has been suggested to be an important regulatory protein during lactation that specifically plays a role for milk protein gene expression (Sheehy et al., Reference Sheehy, Riley, Raadsma, Williamson and Wynn2009; Strucken et al., Reference Strucken, Laurenson and Brockmann2015). Furthermore, specific gene variants of OPN have been associated with milk production traits (Leonard et al., Reference Leonard, Khatib, Schutzkus, Chang and Maltecca2005; Khatib et al., Reference Khatib, Zaitoun, Wiebelhaus-Finger, Chang and Rosa2007) and lactation persistency (Bissonnette, Reference Bissonnette2018). Current knowledge on the OPN level in bovine milk is based on two smaller studies, comprising very few cows (Dudemaine et al., Reference Dudemaine, Thibault, Alain and Bissonnette2014; Schack et al., Reference Schack, Lange, Kelsen, Agnholt, Christensen, Petersen and Sørensen2009a). In the present study we have developed a milk sample preparation process and an enzyme linked immunosorbent assay (ELISA) method for measurement of OPN in bovine milk. By this method, the OPN concentration in milk from 661 individual Danish Holstein cows was determined and the data was used for identification of factors underlying the variation of OPN concentration in this large population, as well as to estimate heritability.
Material and methods
All procedures to collect the samples followed the protocols approved by the National Guidelines for Animal Experimentation and the Danish Animal Experimental Ethics Committee. All sampling was restricted to routine on-farm procedures that did not cause any inconvenience or stress to the animals.
Milk samples
Milk samples were collected once from 661 Danish Holstein cows during morning milking and skimmed as described (Poulsen et al., Reference Poulsen, Gustavsson, Glantz, Paulsson, Larsen and Larsen2012; Gebreyesus et al., Reference Gebreyesus, Lund, Buitenhuis, Bovenhuis, Poulsen and Janss2017). Briefly, milk from 322 cows were collected in 2009 (Poulsen et al., Reference Poulsen, Gustavsson, Glantz, Paulsson, Larsen and Larsen2012) and milk from 339 cows in 2013 (Gebreyesus et al., Reference Gebreyesus, Lund, Buitenhuis, Bovenhuis, Poulsen and Janss2017). All herds used an indoor total mixed ration feeding strategy without grazing. Cows were sampled from 21 herds at different stages of lactation (days 4 to 877 in milk) and parity (1 to 6). P1 = parity 1 (n = 261), P2 = parity 2 (n = 243), P3 = parity 3 (n = 141), P4 = parity 4, 5, and 6 (n = 16). Representative milk samples of at least 0.5 l were placed on ice during transport to the laboratory, where skim milk samples were prepared by centrifugation (2643 × g for 30 min at 4 °C) and stored at −80 °C until analysis.
Preparation of osteopontin standards and antibodies
OPN was purified from bovine milk as described (Sørensen and Petersen, Reference Sørensen and Petersen1993), and the full-length protein and the N-terminal fragments were separated by gel filtration on a Superdex 200 HR 10/30 column (GE Healthcare, Uppsala, Sweden) connected to a GE Healthcare LKB system as described (Christensen and Sørensen, Reference Christensen and Sørensen2014). The purity of the OPN was determined by SDS-PAGE and Edman sequencing, and the concentration was determined by amino acid analysis. A polyclonal antibody using the purified OPN as antigen was raised in rabbits at Dako A/S (Glostrup, Denmark). In the ELISA, the purified N-terminal milk OPN fragment was used as standard. The monoclonal antibody MAB193P, which recognizes an epitope located in the N-terminal part of both human and bovine OPN was purchased from Maine Biotechnology Services (Portland, ME)
Osteopontin ELISA
Skimmed milk samples were incubated at 95 °C for 30 min and subsequently the caseins and denatured whey proteins which can form complexes with OPN, were precipitated by addition of hydrochloric acid to a concentration of 40 mM, followed by centrifugation at 10 000 g at 4 °C for 10 min. It was verified by Western blotting that no OPN was precipitated in the milk samples by this treatment (data not shown). The supernatant was collected and diluted 400–1600 times in phosphate-buffered saline (PBS) (pH 7.4) containing 0.1% Tween 20 and the biotinylated MAB193P antibody (2.5 μg/ml). The ELISA was performed using MaxiSorp immunoassay plates (ThermoFisher Scientific, Roskilde, Denmark) coated overnight at 4°C with polyclonal antibodies against bovine milk OPN (5 μg/ml in 0.1 M of sodium carbonate, pH 9.8). The plates were washed extensively with PBS and blocked with 2% ovalbumin (Merck, Rødovre, Denmark) in PBS for 1 h at 37 °C and washed three times with the washing buffer (PBS containing 0.1% Tween 20). The milk supernatant and standard samples pre-incubated with the MAB193p antibody were added and incubated for 1 h at 37 °C followed by extensive washing. Captured OPN (both full-length and N-terminal OPN fragments) was detected by incubation with 100 μl of horseradish peroxidase-conjugated streptavidin (diluted 1:10 000) for 1 h at 37°C. After the final wash, TMB-one Peroxidase Substrate (Kem-En-Tec Diagnostics, Copenhagen, Denmark) was added and the plates were incubated for 15 min, after which the reaction was quenched by addition of 0.2 M H2SO4. The plates were read at 450 nm using an ELISA reader (Bio-tek Instruments Inc., Winooski, VT). For determination of intra-assay variation, a milk supernatant sample was diluted and measured in eight wells on the same ELISA plate. For determination of inter-assay variation, a milk supernatant sample was measured on six different ELISA plates on six different days. Sample concentrations were calculated relative to the OPN standard using four-parameter logistic curve fitting.
Genotypes
Of the 661 cows included in the study, DNA samples were available from 650 animals. Genomic DNA was extracted from ear tissue and genotyping was performed using the BovineHD Illumina Beadchip for 372 cows or the BovineSNP50 Beadchip for the remaining 278 cows. SNPs that overlapped between these two genotyping arrays were combined and subjected to quality control. Quality parameters used to select SNPs were: (1) minimum call rates of 90% for individuals and 95% for loci, (2) exclusion of SNPs with a minor allele frequency (MAF) lower than 5% and (3) detection from HW proportion at P < 0.05. Finally, 36 000 SNPs across the 29 bovine autosomes were available for the analyses (Gebreyesus et al., Reference Gebreyesus, Lund, Buitenhuis, Bovenhuis, Poulsen and Janss2017).
These 36 000 SNPs were used to generate the genomic relationship matrix G according to the first method as described (VanRaden, Reference VanRaden2008). After matching the OPN phenotypes with the genotypes 637 animals remained for genetic analysis. The genetic variance and parameters were estimated using restricted maximum likelihood estimation (REML) as implemented in DMU (Madsen and Jensen, Reference Madsen and Jensen2013). The general model used was:
 $$Y_{ijkl} = {\rm \mu } + {\rm parit}{\rm y}_i + {\rm \beta }_1DIM_j + {\rm \beta }_2e^{{-}0.05DIM_j} + {\rm her}{\rm d}_k + {\rm Anima}{\rm l}_l + e_{ijkl}\comma \;$$
where Yijkl was the observation of the individual, in parity i and herd k; μ was the fixed mean effect; parityi was a fixed effect (i = 1, … ,4), β1 was the regression coefficient for days in milking (DIM)j; and DIMj was a covariate describing the effect of days j in milk. Wilmink adjustment (e −0.05DIM) was used for DIM, β2 was the regression coefficient for the Wilmink adjustment (Wilmink, Reference Wilmink1987); herdk was the random herd effect of the herd with distribution  $N\lpar {0\comma \;I{\rm \sigma }_h^2 } \rpar $; animall was the random additive genetic effect based on G of animal l with distribution
  $N\lpar {0\comma \;G{\rm \sigma }_a^2 } \rpar $ and eijkl was the random residual effect, which was assumed to be normally distributed with
  $e\sim N\lpar {0\comma \;I{\rm \sigma }_e^2 } \rpar $.
The heritability (h 2) was estimated using:
 $$h^2 = {\rm \sigma }_a^2 /\lpar {{\rm \sigma }_a^2 + {\rm \sigma }_h^2 + {\rm \sigma }_e^2 } \rpar \comma \;$$
where  ${\rm \sigma }_a^2 $ was the genetic variation,
 $\;{\rm \sigma }_h^2 \;$was the herd variation and
  ${\rm \sigma }_e^2 $ was the residual variation obtained from model 1.
The proportion of phenotypic variance explained by herd was defined as:
 $$h_{herd}^{} = {\rm \sigma }_h^2 /\lpar {{\rm \sigma }_a^2 + {\rm \sigma }_h^2 + {\rm \sigma }_e^2 } \rpar \comma \;$$
where  ${\rm \sigma }_a^2 $ was the genetic variation,
 $\;{\rm \sigma }_h^2 $was the herd variation and
  ${\rm \sigma }_e^2 $was the residual variation obtained from model 1.400
For the association study, model 1 was extended with an allele substation effect (β3) and a covariate SNPm indicating if a SNP is heterozygote (1), or homozygote (0.2). The effect of the SNP was tested using a Wald test with a null hypothesis of H 0: β3 = 0. To correct for multiple testing the false discovery rate (FDR) was used as implemented in the R package ‘qvalue’ version 1.34.0. A SNP was considered significant at an FDR of P < 0.10.
Results
The OPN content in 661 Holstein milk samples was determined by ELISA. The intra- and inter-assay coefficients of variation (% CV) were 5.3% and 13.1%, respectively (Table 1). The sensitivity of the ELISA was 1.25 ng/ml, defined as the background optical density plus two standard deviations. The median value of OPN in the milk samples and the frequency distribution of the combined results are shown in Fig. 1. The determined OPN concentrations obtained for the individual bovine milk samples ranged from 0.4 mg/l to 67.8 mg/l, with a median value of 21.9 mg/l (sd 12.2 mg/l). The main part of the samples had OPN concentrations close to the median value, however, a substantial part of samples had OPN concentrations below 5 mg/l or above 45 mg/l (Fig. 1).
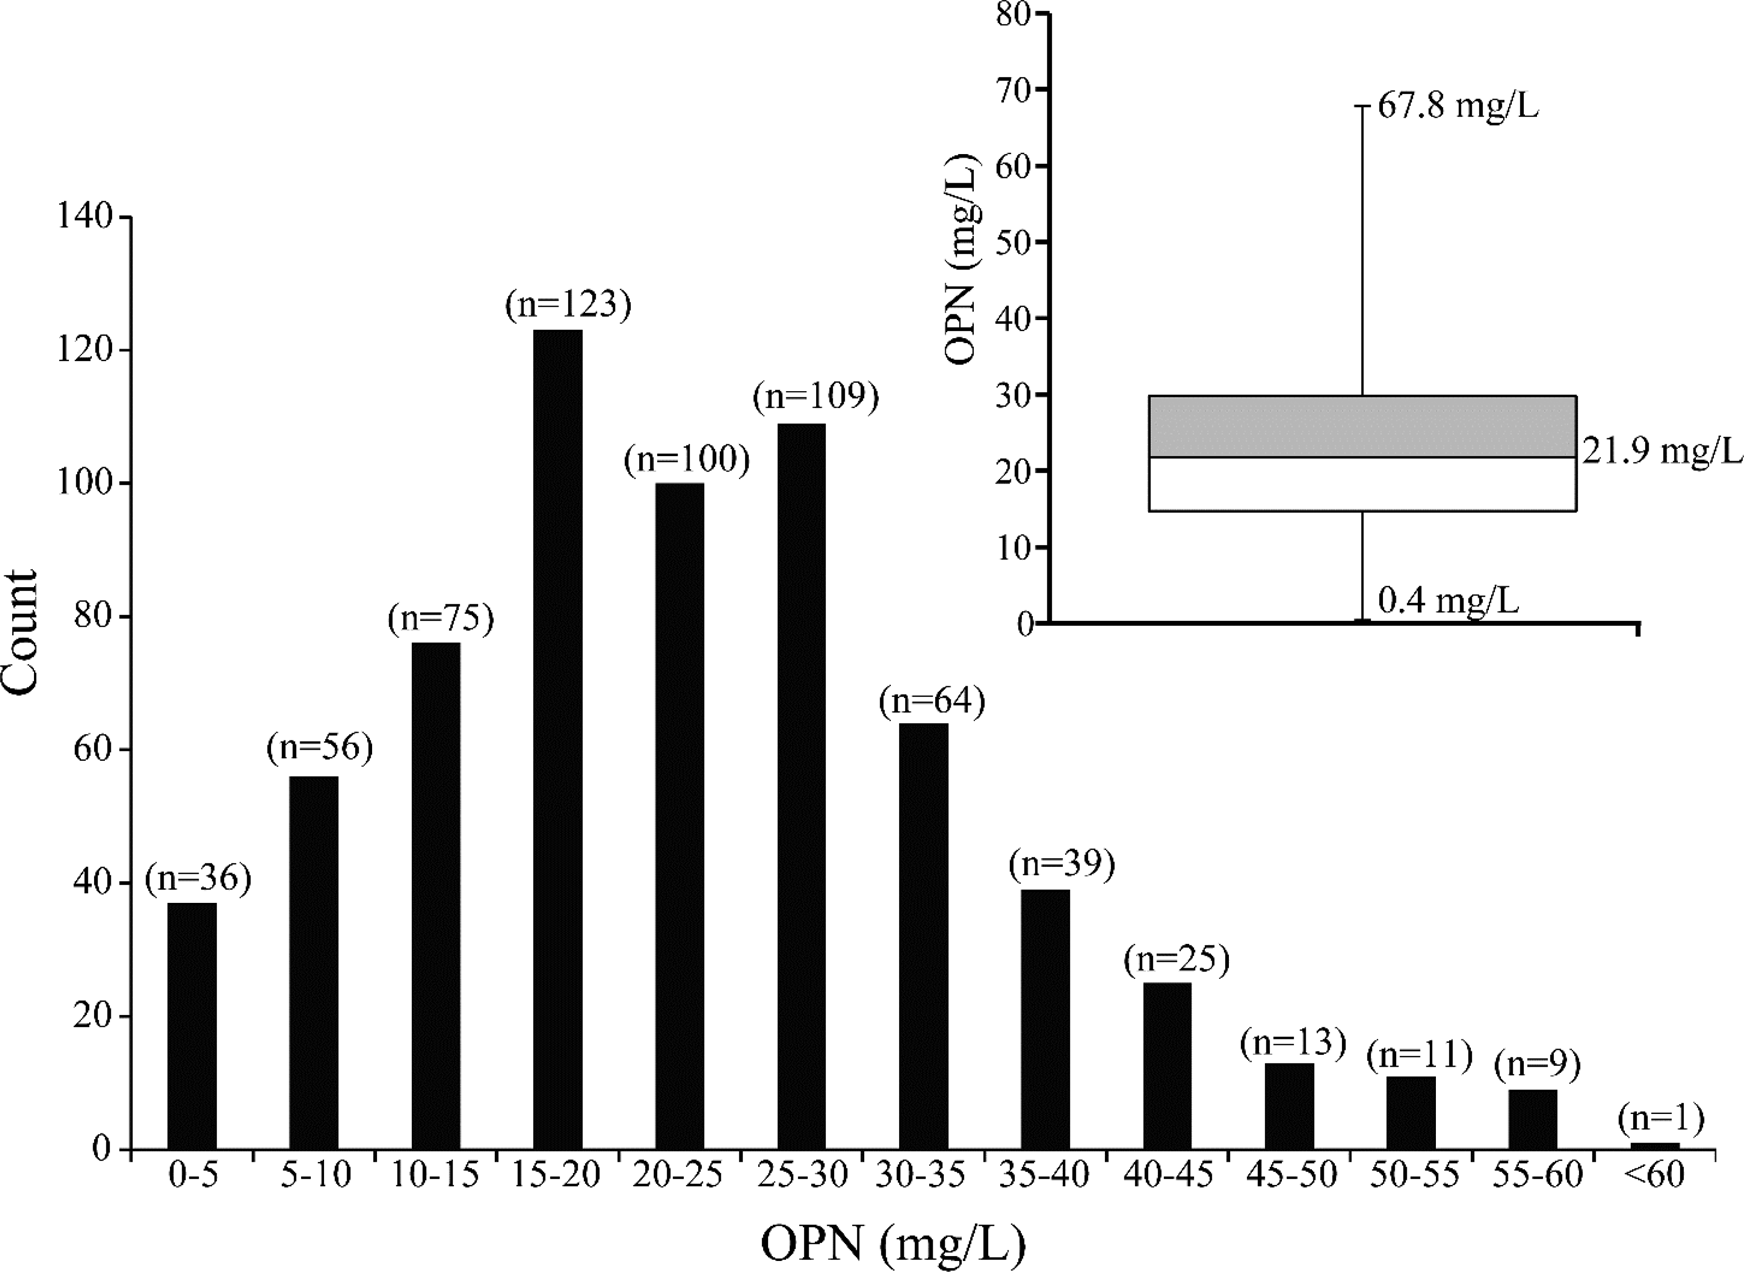
Fig. 1. The distribution of OPN concentrations (mg/l) in milk from 661 Holstein cows. The Box plot inset shows the median OPN concentration. The horizontal line in the box is the median concentration. The lower and higher horizontal lines are the 25th and 75th quartile values of the distribution, respectively. The ends of the vertical lines represent the lower and upper limit of the distribution.
Table 1. Intra- and inter-assay variation for the bovine milk OPN ELISA

a The intra-assay variation of the OPN ELISA was determined by analysing eight replicates of the same milk sample.
b The inter-assay variation was determined by measuring the same milk sample on six different assays over six different days.
The OPN concentration in milk was significantly affected by both DIM and by parity (Table 2). The OPN concentrations increased with DIM, but decreased in concentration with increasing parity. The analysis of OPN in bovine milk showed that apart from the phenotypic variation, there was genetic variation as well. The heritability of the OPN concentration in bovine milk was 0.19 (se: 0.15) (Table 3). In addition, it was shown that the proportion of total phenotypic variation explained by the herd was low, 0.04 (se 0.035).
Table 2. Least-square estimates (±se) of the effect of parity and days in milking (DIM) on the OPN content in bovine milk.

a Significance level is shown for the effect of parity and DIM compared to the mean. ***P < 0.01
Table 3. Variance components (Varanimal, Varherd, Varresidual), heritabilitya (h 2) and part of phenotypic variance for milk OPN content explained by herdb (h herd) for Danish Holstein (n = 637) cows

a h 2 = Varanimal / Varphenotypic, Varphenotypic = Varanimal + Varherd + Varresidual.
b h herd = Varherd / Varphenotypic.
In Fig. 2, a Manhattan plot is presented of the GWAS results of OPN in milk. No SNP markers reached the FDR P value <0.1 significance level.

Fig. 2. Manhattan plot of the GWAS results of OPN content in milk of Danish Holstein. The Y-axes show the –log10 (P-value) of single-marker association tests. The X-axes show marker positions in base pairs.
Discussion
OPN is heterogeneously phosphorylated and subjected to proteolytic cleavage by endogenous milk proteases (Sørensen et al., Reference Sørensen, Højrup and Petersen1995; Christensen and Sørensen, Reference Christensen and Sørensen2014). Furthermore, OPN can form complexes with other milk proteins such as lactoferrin, lactoperoxidase and IgM through electrostatic or affinity interactions (Azuma et al., Reference Azuma, Maeta, Fukuchi and Kanno2006; Yamniuk et al., Reference Yamniuk, Burling and Vogel2009). These complications have to be taken into account in development of an ELISA for OPN in bovine milk. The antibodies used in the presented ELISA recognize both phosphorylated and non-phosphorylated OPN variants, as well as both the N-terminal fragments of OPN and the full-length protein. Prior to the ELISA, milk samples were heated to 95 °C and acidified to eliminate OPN interactions with other milk components and to precipitate major milk proteins that may interfere with OPN binding to the antibodies. OPN is an intrinsically disordered protein, which remains fully soluble after the heat and acid treatment of milk (Sørensen and Petersen, Reference Sørensen and Petersen1993), so this treatment is known not to cause any loss of OPN in the samples to be analyzed. The developed ELISA detects the natural mixture of full-length OPN (approx. 25%) and N-terminal OPN fragments (approx. 75%) that is present in pooled bovine milk (Christensen and Sørensen, Reference Christensen and Sørensen2014). In the study, we have used the purified N-terminal OPN fragment as standard in the ELISA, as this represents the major form of OPN in milk. In an ideal ELISA set-up, the standard protein is identical to the protein to be measured, but as the degree of OPN fragmentation in milk varies among individual cows, such a standard is not obtainable. Using the N-terminal fragment as standard may result in a slight underestimation of OPN content when converting the ELISA read-out to concentration in the milk, as the N-terminal fragment has a molecular mass of 19.2 kDa (Boskey et al., Reference Boskey A, Christensen, Taleb and Sørensen2012) and the weighted average molecular mass of the mixture of full-length OPN and the N-terminal OPN fragment in milk is 22.8 kDa. In summary, this ELISA method and the preceding milk sample treatment was developed to avoid the complications of OPN heterogeneity, proteolytic fragmentation and complex formation, which is associated with measuring OPN in bovine milk.
Analyses of milk from 661 Danish Holstein cows showed a median OPN value of 21.9 mg/l (sd 12.2) (Fig. 1) and a corresponding average concentration of 23.0 mg/l. This concentration is similar to the average concentration of 18 mg/l reported for pooled bovine milk (Schack et al., Reference Schack, Lange, Kelsen, Agnholt, Christensen, Petersen and Sørensen2009a). In a study investigating the OPN content in milk from five cows, levels were found to fluctuate around ~70 mg/l from parturition to lactation week 25, whereafter the concentration increased to ~150–250 mg/l between week 25 and 30 (Dudemaine et al., Reference Dudemaine, Thibault, Alain and Bissonnette2014). The cows in that study were selected based on specific genetic variations that had an effect on the OPN promotor activity (Dudemaine et al., Reference Dudemaine, Thibault, Alain and Bissonnette2014). Furthermore, a commercially available full-length bovine OPN standard was used for the quantification of the protein. In our ELISA, this standard reacted very poorly with the antibodies resulting in unrealistic high OPN levels (data not shown). These factors could contribute to the differences in OPN levels reported in the two studies.
In the present study, a considerable individual variation was observed between the cows, with levels varying from 0.4 mg/l to 67.8 mg/l. Such large individual variation in OPN levels has not previously been reported, as earlier studies have only comprised a very limited number of cows (Schack et al., Reference Schack, Lange, Kelsen, Agnholt, Christensen, Petersen and Sørensen2009a; Dudemaine et al., Reference Dudemaine, Thibault, Alain and Bissonnette2014). We also showed that the OPN content in cow's milk increases significantly with DIM (Table 2). This is in line with the study by Dudemaine et al. (Reference Dudemaine, Thibault, Alain and Bissonnette2014), where a significant increase in bovine OPN levels were observed after lactation week 25. The present study is the first to indicate an effect of parity, as OPN levels decrease with increasing parity (Table 2). The reason for this is not known. However, OPN plays a role in tissue remodeling and has been associated with lactation persistency (Bissonnette, Reference Bissonnette2018), and the lower OPN levels in later parities and DIM could suggest that changes occur in the mammary gland, which may affect the mammary gland directly, but also lead to changes in milk composition as reported by others (Leonard et al., Reference Leonard, Khatib, Schutzkus, Chang and Maltecca2005; Khatib et al., Reference Khatib, Zaitoun, Wiebelhaus-Finger, Chang and Rosa2007).
The genetic analysis of OPN variance showed that the OPN concentration in bovine milk is heritable, indicating that there is both phenotypic as well as genetic variation for OPN in Danish Holstein milk. In addition, the proportion of the total phenotypic variance explained by the herd was low, indicating that management factors such as feed regime have little or no impact on the OPN concentration in bovine milk. The OPN gene (SPP1) is associated with milk production traits and lactation persistency (Leonard et al., Reference Leonard, Khatib, Schutzkus, Chang and Maltecca2005; Khatib et al., Reference Khatib, Zaitoun, Wiebelhaus-Finger, Chang and Rosa2007; Bissonnette, Reference Bissonnette2018). This association of SPP1 to production traits is interesting. However, in our data-set it was not possible to associate the SPP1 gene to OPN performing a genome-wide association approach (Fig. 2).
In conclusion, the presented ELISA method provides a tool for investigation of bovine OPN in complex mixtures, as it measures OPN regardless of fragmentation and phosphorylation state, and in complexes with other proteins. To our knowledge this is the first study to document large variability in OPN content between cows. This variation was related to DIM and parity. In case one would like to pursue selective breeding this study showed that the heritability was 0.19, however with a relatively large standard error. In contrast, the variation explained by the herd was very low, which suggests that the milk OPN content cannot be influenced by farm management or feeding, but rather relates to some unexplained individual physiological effects that is not accounted for in the current study.
Acknowledgements
The project received funding from the Danish Milk Levy Fund and Arla Foods Ingredients Group P/S, Denmark.


