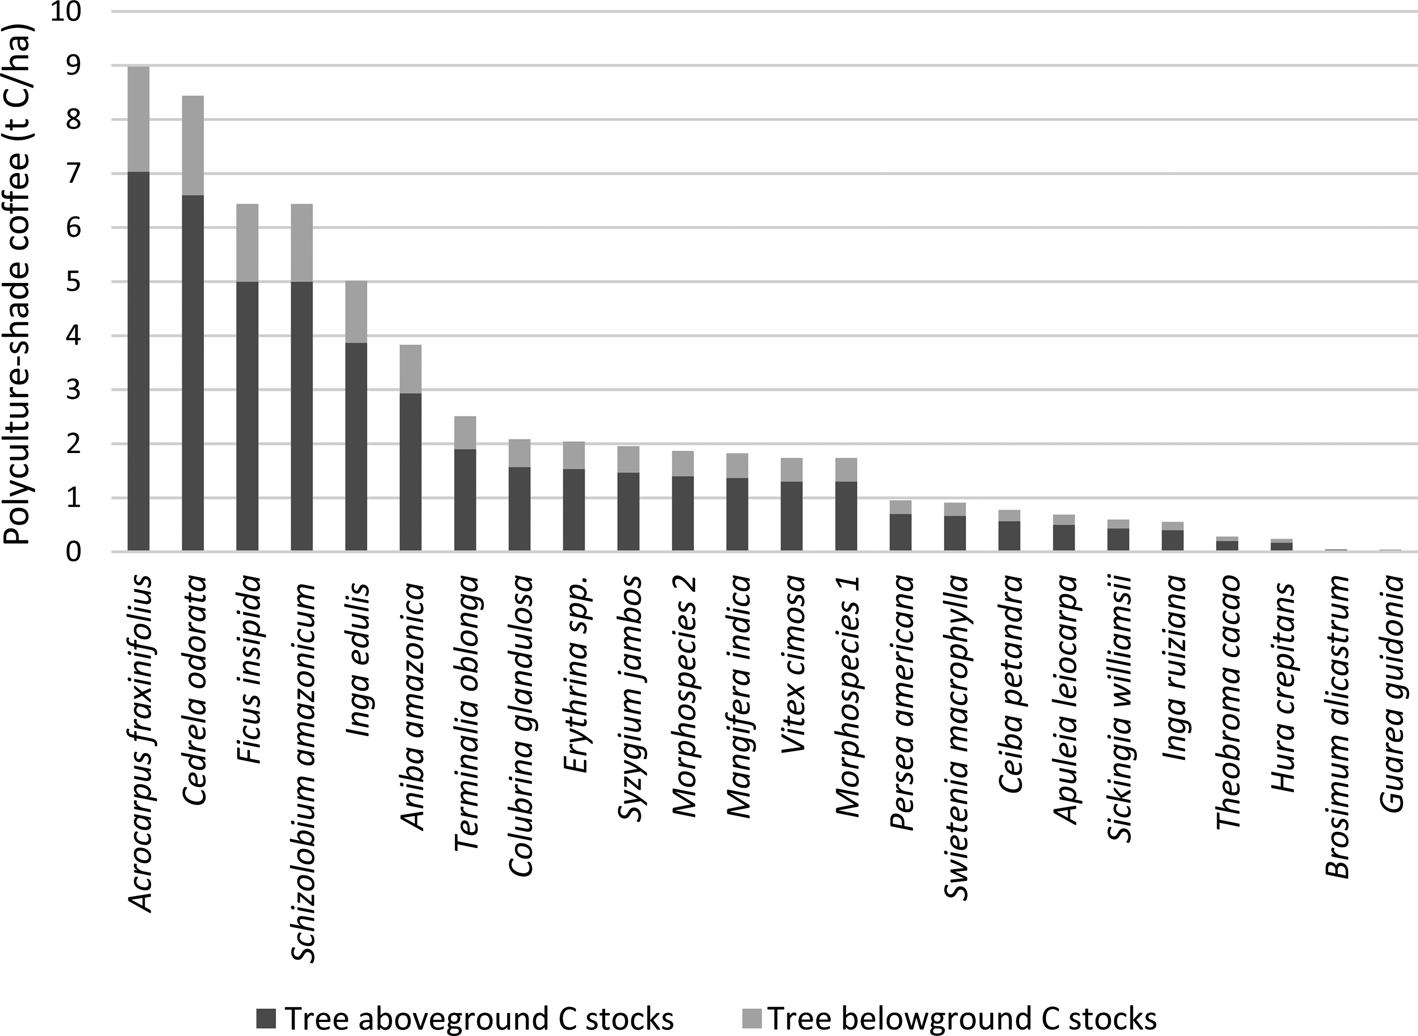
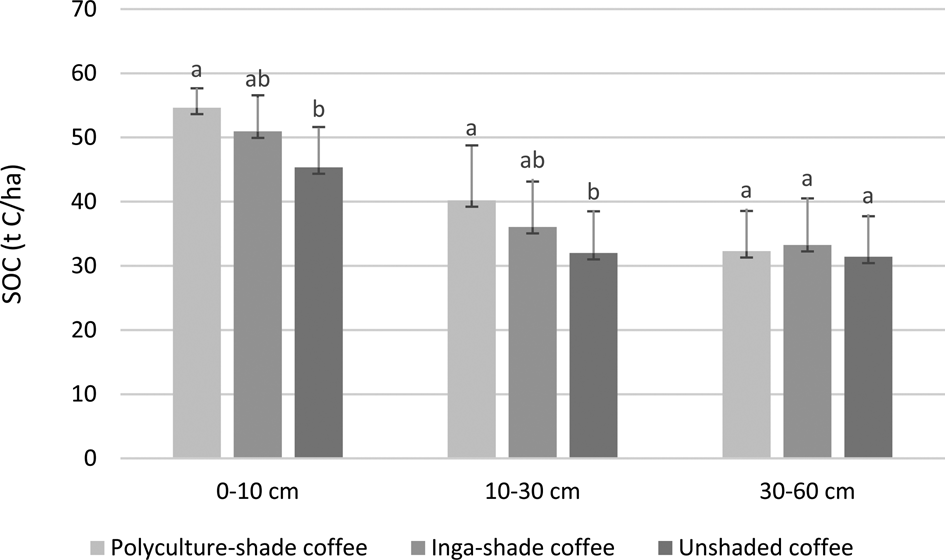
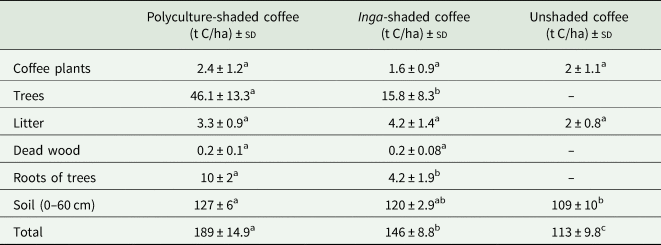
Table 5, Figures 3 and 4 were mistakenly presented with units as Mg C ha−1: the units should have been t C/ha to conform to journal policies and match the units elsewhere in the paper. The corrected versions are presented below.

Fig. 3. Above- and belowground carbon stocks of trees at species level in polyculture-shaded coffee.

Fig. 4. Soil organic carbon (SOC) content in relation to depth in different coffee growing systems. Bars with equal letters in each soil depth do not differ according to the Tukey test (P < 0.05).
Table 5. Summary of carbon stocks in the different compartments in three coffee growing systems

sd, standard deviation.
Means followed by equal letters in the rows do not differ according to the Tukey test (P < 0.05).


