


Introduction
Irregular mounds surrounded by moats and embankments were first noted in north-east Thailand over a century ago (Damrong Rajanubhap 1995). Since then these sites have continued to be the focus of archaeological interest (Williams-Hunt Reference Williams-Hunt1950; Vallibhotama Reference Vallibhotama1984; Moore Reference Moore1988; Welch Reference Welch1989; Higham Reference Higham1998, Reference Higham2014; Talbot & Janthed Reference Talbot and Janthed2001). The sites typically include a raised occupation mound surrounded by at least one moat (often as wide as c. 100m) and a raised embankment. Some sites have up to five encircling moats and embankments. One hundred and fifty-one of these sites have been identified by several projects since 1950 (Williams-Hunt Reference Williams-Hunt1950; Vallibhotama Reference Vallibhotama1984; Moore Reference Moore1988; Welch & McNeill Reference Welch and McNeill1988–89; Higham Reference Higham1998; McGrath & Boyd Reference McGrath and Boyd2001; Talbot & Janthed Reference Talbot and Janthed2001; Higham Reference Higham2011) but a further 146 sites are now known (Scott Reference Scott2013; O’Reilly & Scott Reference O’Reilly and Scott2015). The majority were constructed in the mid- to late Iron Age (c. AD 1–600) (McGrath & Boyd Reference McGrath and Boyd2001), although some were first inhabited during the Bronze Age (c. eleventh century BC) and at least one is known to have been occupied during the Neolithic period (c. seventeenth century BC) (McGrath & Boyd Reference McGrath and Boyd2001; Higham & Kijngam Reference Higham and Kijngam2013). At these early sites, however, the moats were later additions constructed during the Iron Age phases of occupation.
Despite considerable research (Vallibhotama Reference Vallibhotama1984; Moore Reference Moore1988; McNeill & Welch Reference McNeill and Welch1991; Higham Reference Higham1998), the purpose of the moats remains unresolved. Here we present evidence of a correlation between the location and morphology of these sites and rainfall patterns, which suggests that moats and embankments were created to retain water. We will begin by discussing the geography and hydrology of the Khorat Plateau in north-east Thailand before offering a brief review of recent research that has identified many more moated sites on the plateau than were previously known. The methodology for assessing the distribution of moated sites will then be outlined; this is based on statistical analyses that incorporate rainfall patterns and variables including site size, location and the number of moats surrounding a site. Finally we present our interpretation of the data.
Geography and hydrology of the Khorat Plateau
The Khorat Plateau of north-east Thailand covers an area of 170226km2 (Moore Reference Moore1988: 13) and is bounded on the west by the Phetchabun Mountains and to the south by the Dangrek Mountains (Figure 1). The Phetchabun Mountain range reaches a height of 1780m and produces a rain shadow effect over the western parts of the Plateau (Riethmuller Reference Riethmuller, Manshard and Morgan1988: 78; Supapoj et al. Reference Supapoj, Naklang, Konboon, Ladha, Wade, Dobermann, Reirchardt, Kirk and Piggin1998: 162). The Khorat Plateau comprises two major drainage basins: the Sakon Nakhon Basin to the north and the Khorat Basin to the south. The vast majority of moated sites are found in the Khorat Basin, which is drained by the Mun and Chi rivers. These flow eastward to join the Mekong River, which forms the eastern and northern boundaries of the Plateau. The geography of the Mun and Chi valleys is characterised by broad, gently sloping floodplains. Precipitation on the Khorat Plateau increases in volume from west to east, ranging from an annual average of 1000–2400mm. Modern rainfall data are generally applicable to the past due to evidence of broad consistency in weather patterns in this region since the Iron Age (Riethmuller Reference Riethmuller, Manshard and Morgan1988: 78; Kealhofer & Penny Reference Kealhofer and Penny1998: 91; Boyd & McGrath Reference Boyd and McGrath2001: 309; Penny Reference Penny2001: 126; Maxwell Reference Maxwell2004: 235). Data collected between 1981 and 2010 indicate that the western portion of the Khorat Plateau receives an average 1200mm less precipitation than the east (Figure 2). Rainfall is heaviest during the wet season, between May and September (Supapoj et al. Reference Supapoj, Naklang, Konboon, Ladha, Wade, Dobermann, Reirchardt, Kirk and Piggin1998: 162), but annual fluctuations in the duration and intensity of the wet season are well documented and can have a significant impact on crop yield (Paul Reference Paul1984; Bruins et al. Reference Bruins, Evenari and Nessler1986; Parnwell Reference Parnwell1988; Fox & Ledgerwood Reference Fox and Ledgerwood1999).
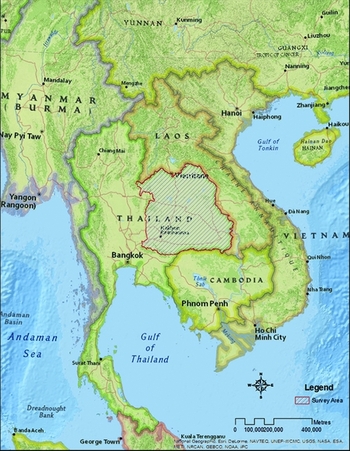
Figure 1. Map of Southeast Asia with survey area marked (image from National Geographic, Esri).

Figure 2. Annual rainfall distribution in the Khorat Plateau; average rainfall recorded from 1976–2004 (GIS data from the Thai Meteorology Department).
Much of the research focused on the Khorat Plateau has aimed to understand alterations in the hydrology of the Plateau throughout the Holocene (Boyd & McGrath Reference Boyd and McGrath2001; McGrath & Boyd Reference McGrath and Boyd2001: 360; Boyd Reference Boyd, Higham, Kijngam and Talbot2007; Boyd & Habberfield-Short Reference Boyd, Habberfield-Short, Higham, Kijngam and Talbot2007; McGrath et al. Reference McGrath, Boyd and Bush2008). Boyd and McGrath (Reference Boyd and McGrath2001: 309) have noted that the current hydrology of the region is very different to that of the early Holocene. It is accepted that at the beginning of the Iron Age (c. 2500 years ago), the Khorat Plateau shifted from a system of deep, single-channel waterways to one of multiple short-lived, narrow and shallow drainage channels (Boyd & Habberfield-Short Reference Boyd, Habberfield-Short, Higham, Kijngam and Talbot2007: 24–25). This is cited as evidence for a decline in rainwater run-off and the beginning of a climate similar to that of the present day, with a marked difference between dry and wet seasons (Boyd & Habberfield-Short Reference Boyd, Habberfield-Short, Higham, Kijngam and Talbot2007; McGrath et al. Reference McGrath, Boyd and Bush2008). This environmental change is supported by recent oxygen isotopic research (King et al. Reference King, Bentley, Tayles, Viŏarsdóttir, Nowell and Macpherson2013). Samples were taken from human dental enamel sourced from burials at Ban Non Wat to indicate the level of fractionation occurring in the water during the Iron Age (King et al. Reference King, Bentley, Tayles, Viŏarsdóttir, Nowell and Macpherson2013: 1684). The results of the analysis showed an increase in δO18 since the Iron Age, which reflects a drier environment with higher levels of water lost through evaporation (King et al. Reference King, Bentley, Tayles, Viŏarsdóttir, Nowell and Macpherson2013: 1888).
Recent research identifying moated sites
Building on the work undertaken by previous researchers (Moore Reference Moore1988; Welch Reference Welch1989), we undertook a remote visual survey of the entire area of the Khorat Plateau, using Google Earth® to produce a comprehensive dataset of site locations and the structure of individual sites (O’Reilly & Scott Reference O’Reilly and Scott2015). The objective was to produce a dataset of moated sites detailing for each site: soil texture, precipitation rates and aspects of construction, including location, size and number of moats.
Sites were recorded where they met the following well-established criteria: presence of a demonstrable raised central mound and a visible moat or embankment system encircling the central mound (Moore Reference Moore1988; Boyd et al. Reference Boyd, Higham and McGrath1999; Talbot & Janthed Reference Talbot and Janthed2001; Higham Reference Higham2011). In cases where sites had been degraded or altered they were included in the dataset if at least one third of the circumference of the mound was encircled by a moat. Sites that are no longer extant but were recorded by Moore (Reference Moore1988) and Higham (Reference Higham2011) were also included in the current dataset.
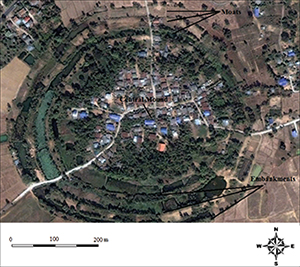
The survey identified 297 circular moated sites, the majority of which are located in the southern portion of the Khorat Plateau, particularly in the Mun River Basin. Most are surrounded by one or two moats but some have as many as five (Figure 3). The area of the occupation mound at these sites, as delimited by the innermost moat, ranges from 0.5–171ha; within that range however, 50% of sites have an occupation mound between 6.2 and 19.7ha, with a mean area of 15.9ha.

Figure 3. A site surrounded by moats and embankments in north-east Thailand (15° 0'0 N, 102°49'23 E).
Statistical methodology
The identification of moated sites and their mapping demonstrated several intuitively recognisable distribution patterns. In particular, the GIS software (ArcGIS) applied a kernel density model to the data that confirmed that the greatest density of sites of this type was in the Mun River valley. Site density is not consistent throughout the valley and clusters of occupation were noted. Several statistical analyses were applied to the data including a k-means analysis, a chi-squared test of independence and a residual maximum likelihood (REML) model. The first of these was applied to the site location data to confirm clusters that were identified in the kernel density model. The potential for site density to be associated with rainfall was analysed using chi-squared tests of independence. To evaluate the influence of rainfall on the size of sites a residual maximum likelihood analysis was undertaken; this demonstrated whether site size and geographic location were related to rainfall.
K-means analysis
As noted above, a kernel density model (Figure 4) revealed variations in the density of circular moated sites across the landscape. This is true of the entire Khorat Plateau, and is also evident on a finer scale along the Mun River. In order to explore these apparent groupings, a k-means analysis for non-hierarchical clustering was applied to the site location data using the Euclidean distance metric. This utilised locational data for sites, converted into the Universal Transverse Mercator (UTM) coordinate system, to chart sites by longitude and latitude. The k-means analysis produced a series of 10 models with a range of 5–15 site groups (clusters) from the data. The sums-of-squares criterion values decrease as the number of clusters increase until a point of consistency is reached, where the trend levels off (Figure 5). For this set of data the point where the criterion value ceases to decrease by any real degree is achieved with the model set at eight clusters; dividing the data into more clusters does not change how well the groups are statistically separated. This finding was used as the basis to divide the moated sites into eight distinct groups.

Figure 4. Kernel density model of circular moated sites in the Khorat Plateau; the model demonstrates several clusters of densely packed sites along the Mun River (DEM from the ASTER GDEM project).

Figure 5. Criterion values for the k-means test with the number of groups set from 5–15.
Chi-squared test of independence
A chi-squared test provides a measure of the degree to which patterns in data are likely to represent real relationships rather than having occurred by chance. As such, a significant χ2 value indicates that the pattern present reflects a real association between the factors (Drennan Reference Drennan2004: 183). The P value obtained through the chi-squared test shows if the pattern is statistically significant (P = 0.05 or less); whereas Cramer's V is used to show the strength of the relationship. Cramer's V ranges from 0–1, with 1 indicating a very strong relationship (Drennan Reference Drennan2004: 199). For all the chi-squared tests, measures were taken to eliminate as many nil (0) values as possible. This involved grouping together small categories with few values in the data (i.e. values for 4 or 5 moats per site were grouped into one class). A single small value (e.g. less than 5) in a chi-squared table will have some effect on the chi-squared test, but will not impact greatly on the conclusion unless the result is of borderline significance.
Residual maximum likelihood (REML)
Relationships between site size, rainfall, fertility and soil texture (e.g. silt, clay or sand) were tested using a REML. In order to fit the requirements for the analysis, the values for site area were standardised using a natural log transformation (Jiang Reference Jiang1996). This removed the issue of heterogeneity in the residuals (the difference between the observed and predicted values for each data point) and created a normal distribution curve. The ‘test for fixed effects’ in the REML analysis is divided into two parts: sequentially adding terms to the model and dropping individual terms (while leaving the other terms in the model). Table 1 presents the Wald and F statistics showing the contribution of each explanatory variable after the other terms have been included in the model. In this first stage of the analysis rainfall is the only variable shown to have a significant relationship to site size. The second stage of the REML drops the terms to individually analyse each variable. At this stage it is revealed that elevation is significantly related to site size (Table 2). From this initial analysis a second REML was run using only rainfall and elevation. Table 3 shows that, when considered together, both variables (rainfall and elevation) demonstrate clearly significant relationships with site size. The particular effect of each variable on site size can also be assessed in more detail by examining its table of means.
Table 1. Wald and F statistics showing the contribution of each explanatory variable after the other terms have been included in the model (sequentially adding terms to fixed model).

Table 2. The second stage of the residual maximum likelihood individually analysing each variable (dropping individual terms from full fixed model).

Table 3. Residual maximum likelihood: showing elevation and rainfall together (remaining terms from full fixed model).

Results of statistical analyses
Relationship between rainfall and site density
Overlaying the distribution of moated sites on a rainfall distribution map (Figure 6) indicates that the majority of moated sites are located in regions with the lowest precipitation, those receiving c. 1000–1200mm and 1200–1400mm annually (Figure 7). This is confirmed by the kernel density model.

Figure 6. Rainfall map with circular moated sites overlayed.

Figure 7. Frequency of circular moated sites by amount of rainfall.
Relationship between rainfall and site size
Assuming a correlation between the areal extent of the archaeological mounds and population size, it was reasoned that site size may have varied in relation to the amount of precipitation. Arid areas would not be able to support large populations and so the size of sites in relation to the amount of rainfall was also examined. Table 4 illustrates the change in the predicted average site size according to each rainfall category. The predicted mean size of sites is smallest in the area of the Khorat Plateau receiving the least annual rainfall. The table shows that there is very little difference between the predicted means for the rain bands ranging from 1200–1400ml and 1400–1600ml, which contain the sites with the largest average area. The average site area then drops off slightly in the band receiving the most rainfall (1600–2000ml), although it should be noted that only four sites fall in this region. In order to identify a statistically significant difference the value for the average standard error of difference (0.3377) is multiplied by 2 to produce the least significant difference (LSD) to measure against. This produces an LSD value of 0.6754, which means that only the difference between the first and third rainfall bands is statistically significant. In addition, the difference between the first and second band is only just outside the statistically significant range. This demonstrates a trend in which sites are generally larger in the areas of greater rainfall.
Table 4. Means for rainfall: showing changes in predicted mean for site size in each category.

Relationship between rainfall and the number of moats at a site
The pattern of distribution noted above may indicate that moats were constructed around these sites to collect and store water; if so it would stand to reason that sites in the driest areas would have multiple moats to collect as much water as possible. To test the validity of this hypothesis, we undertook statistical analyses on the number of moats per site. A chi-squared test of independence was applied to the data. To fulfil the requirements for the test, sites with four and five moats were merged into one group and all bands of rainfall of 1400mm and above were brought into one band (Table 5). The χ2 value obtained (13.6) is statistically significant (P = 0.034). The value for Cramer's V, however, which gauges the strength of the pattern, is only 0.15. This suggests that the amount of annual rainfall has a slight influence on the number of moats at a site. It can be expected that, on average, sites in regions of less annual rainfall have more moats than those in areas of more plentiful rainfall.
Table 5. Chi-squared observed values table for number of moats and rainfall.

Water loss is another consideration that must be taken into account. Water can be lost either through evaporation or through the soil. It is contended that if water was being lost, it must have been due to variable soil permeability across the landscape, because the meteorological parameters, and therefore evaporation rates, are broadly similar across the Khorat Plateau (Ohba & Ponsana Reference Ohba and Ponsana1987). The permeability of the soil on which the sites are located also plays a role in determining possible moat function. Moats being used to store water for extended periods of time would function most efficiently if seepage were at a minimum. Indeed most of the moated sites (95.6%) in the Mun floodplain are located on soils with low or low–medium permeability (Figure 8). Only 3.4% of sites are found in areas with high soil permeability.

Figure 8. Frequency of circular moated sites by permeability of the soil.
The results of the statistical testing demonstrate several significant trends in estimated rainfall and in the distribution and morphology of circular moated sites. It is apparent that the majority of moated sites on the Khorat Plateau (81.8%) lie in areas with low annual precipitation (Figure 7). A slight relationship was identified between the amount of annual precipitation and the number of moats surrounding a site, with multi-moat sites being more common in areas of low precipitation. We have also seen that the amount of rainfall had a relationship to site size, with sites increasing in size as the amount of annual rainfall increases.
Possible functions of moats
Several theories have been offered to explain the function of moats and embankments on the Khorat plateau including defence, intra-moat agriculture or aquaculture, symbolism, flood defence and water storage. Each of these hypotheses may be challenged on various grounds but the latter seems the most plausible, although it is possible that moats had multiple uses.
The defensive theory for the moat and embankment system was first suggested by Williams-Hunt who referred to them as “defended towns characterized by multiple, concentric earthworks and very regular, almost circular construction” (1950: 32). Others, including Vallibhotama (Reference Vallibhotama1984) and Nitta (Reference Nitta1991) have put forward this possibility as well. There is evidence that several centuries after the moats and embankments were constructed there were military incursions into the region. A Sanskrit inscription from Phnom Hanchey (K. 81), dating to the sixth century, mentions that fighting was undertaken during the dry season when moats were waterless (Parry Reference Parry1992: 13). The moats referred to in the inscription may not be those around Iron Age sites, as the text slightly post-dates the period under examination here, but it does hint that moats did serve as a deterrent against military aggression. If the moats were indeed empty during the dry season that would, however, greatly diminish their credibility as defensive features.
Further reducing their efficacy for defence is the shape of the moats around these sites. Boyd et al. (Reference Boyd, Higham and McGrath1999) analysed the profiles, revealing broad U-shaped bottoms that would not greatly hinder an attacker. A moat with a V-shaped base is better at slowing attackers (Boyd et al. Reference Boyd, Higham and McGrath1999; O’Reilly Reference O’Reilly2008: 380). Furthermore, there is no evidence for palisades or other protective structures atop the embankments that one would expect to find were the features defensive in nature (Higham Reference Higham2011).
If the moats and embankments were constructed for defensive purposes then arguably the number of moats per site should increase proportionately with the density of neighbouring sites. Conversely, sites with only one or two moats should be found in areas of low site density. A density analysis on the moated sites of north-east Thailand indicates that site density does not demonstrate any relationship to the number of moats encircling a site (Scott Reference Scott2013). There is some evidence for conflict during the period when the moats were constructed (Higham Reference Higham2014), but given the weight of the evidence it appears unlikely that the moats were primarily defensive in nature.
Vallibhotama (Reference Vallibhotama1984) and Higham (Reference Higham1998) have suggested an agricultural or aquacultural function in which the moats were dug to grow wet-rice (in effect the moat served as a paddy field) or to keep fish. The argument for rice cultivation is problematic in that the moats surrounding these sites would have been much deeper during the Iron Age than they are today (Boyd et al. Reference Boyd, McGrath and Higham1999; O’Reilly Reference O’Reilly2008: 380). The depth exceeds that appropriate for growing paddy rice and, in any case, the amount of rice that could be grown within the area of the moats would have been negligible. Fish farming would require the moats to be full of water for the entire year, which may not have been the case.
The possibility that the moats are symbolic in nature has been explored by one of the present authors (O’Reilly Reference O’Reilly2008) who suggested that the moats functioned to delineate territorial claims. While this explanation cannot be ruled out, it also cannot be confirmed and remains hypothetical. Again, the possibility of dual or multiple functions should be considered.
McGrath et al. (Reference McGrath, Boyd and Bush2008) have suggested that the moats served to protect sites from flooding. Given the climatic evidence we have for increasing periods of drought it seems doubtful that such a massive investment would have been made to ensure against an unlikely flood.
The use of moats for water management in which water would have been stored for domestic consumption and released, when needed, to irrigate surrounding fields in times of drought, has more recently been suggested (O’Reilly Reference O’Reilly2014). This argument contends that the majority of these sites were surrounded by moats with sufficient cubic capacity to irrigate paddies that could grow sufficient rice to feed the site's population. One issue is that, to date, no irrigation channels or outlets have been identified at the moated sites of the Khorat Plateau. Historic and pre-historic agricultural systems documented elsewhere in the world do, however, use moats to store water and irrigate fields without irrigation channels (Nabhan Reference Nabhan1979; Paul Reference Paul1984; Bruins et al. Reference Bruins, Evenari and Nessler1986; Hatibu & Mahoo Reference Hatibu, Mahoo, Kaumbutho and Simalenga1999; Dominguez & Kolm Reference Dominguez and Kolm2005, Mupangwa et al. Reference Mupangwa, Love and Twomlow2006; Mbilinyi et al. Reference Mbilinyi, Tumbo, Mahoo and Mkiramwinyi2007). Such systems are generally found in regions that are similar to the Khorat Plateau in that they experience a distinct wet and dry season (Bruins et al. Reference Bruins, Evenari and Nessler1986; Prinz Reference Prinz2002). It must be noted, however, that further research is required to clarify whether the gradient from the moats to the rice paddies is sufficient to irrigate the fields.
Given the results of the statistical analyses presented here relating rainfall patterns to site location, site size and the number of moats that surrounded these mounds, it is suggested that water storage is the most plausible primary explanation for the creation of the moats and embankments.
Conclusion
Our geographic study of Iron Age moated sites in north-east Thailand has examined 297 sites on the Khorat Plateau and their rainfall patterns. This analysis shows that the vast majority of moated mound sites are located in the Mun and Chi valleys. Furthermore, several interesting relationships have been revealed between site location, morphology and precipitation rates. The majority of moated sites are located in the two areas of lowest annual rainfall, with very few sites located in the high rainfall areas. This suggests that sites were constructed in areas where communities could not rely on regular rainfall. Statistical associations support this hypothesis, including the level of rainfall and number of moats, and level of rainfall and frequency and size of sites. Patterns in the data demonstrate that the average size of sites (and therefore the population that would have been supported) increased in areas of greater rainfall. They also show that rates of precipitation are correlated with the number of moats per site, with more moats at sites in areas of lower rainfall. The accumulated evidence suggests moats were necessary for water storage, acting as buffer supplies for irregular wet seasons and long periods of drought. It should be stressed, however, that moats may have been multi-purpose and also potentially have served a symbolic role. There is the possibility therefore, that multiple secondary functions, such as symbolism, may have diluted an even stronger correlation in the statistical relationships of variables, particularly that between rainfall and the number of moats at a site.
Acknowledgements
The authors would like to extend their gratitude to Bob Forrester of the Australian National University's Statistical Consulting Unit, Watinee Thavorntam, the Thai Meteorological Department, the Mekong River Commission, and Duncan Wright and Charles Higham for comments on an earlier draft of the paper. We also extend our thanks to the peer reviewers for their helpful comments and suggestions.


