


I. INTRODUCTION
Cuprate perovskite compounds with the general formula RBa2Cu3O7−δ (R123) (R = rare-earth elements and Y) have a layered structure, which consists of alternating blocks with perovskite and rock-salt arrangements. These compounds are superconductors (notable exceptions are Ce, Pr, and Tb). The critical temperature T c increases monotonically with increasing ionic radius from 88 to 94 K (Lin et al., Reference Lin, Huang, Xue, Chu, Cao and Ho1995; Williams and Tallon, Reference Williams and Tallon1996; Chen et al., Reference Chen, Zhang, Su, Xue and Cao2006). The Cu2O layers responsible for superconductivity are located in the perovskite block. The rock-salt blocks provide the stability of the structure and play the role of charge reservoir, as they create the necessary hole concentration in the conducting band for the appearance of superconductivity. These compounds attracted a great deal of interest. A lot of efforts have been devoted to the study of how different types of substitutions would influence their structural and superconductive properties.
The substitution of Zn atoms at Cu sites in R123 requires more attention. It mainly substitutes the plane Cu2 sites and causes keen depression of superconductivity, even though it is a non-magnetic ion (Xu et al., Reference Xu, Ata-Allah, Berger and Glück1996).
The reduction of T c for RBa2Cu3−xZnxO7−δ is found to depend strongly on the ionic radius of the rare-earth element R. A strong suppression in T c at the rate of 28 K/at.% in the system NdBa2(Cu1−yZny)3O7−δ is reported (Marv et al., Reference Marv, Kumar and Varadaraju1993; Jamadar et al., Reference Jamadar, Roy and Gosh2013). This effect resembles the ion size effect on T c in R 1−xPrxBa2Cu3O7−δ, where Pr substitutes on the R site, in RBa2Cu3−xGaxO7−δ, where Ga substitutes on the Cu1 sites in Cu1O chains, and in RBaSrCu3Oy (Awana et al., Reference Awana, Malik, Cardoso, De Lima, Cupta, Sedky, Yelon, Prasad and Narlikar2000a).
It is noticeable that a few detailed works about the structural properties of the compounds RBa2Cu2.9Zn0.1O7−δ are reported within our knowledge: Zn-Y123 (Kajitani et al., Reference Kajitani, Kusaba, Kikuchi, Syono and Hirabayashi1988; Xiao et al., Reference Xiao, Cieplak, Musser, Gavrin, Streitz, Chien, Rhyne and Gotaas1988; Maeda et al., Reference Maeda, Koizumi, Bamba, Takayama-Muromachi, Izumi, Asano, Shimizu, Moriwaki, Kuroda and Yamazaki1989; Mazumder et al., Reference Mazumder, Rajagopal, Sequeira, Singh, Rajarajan, Gupta and Vijayaraghavan1989; Balagurov et al., Reference Balagurov, Sikolenko, Simkin, Parfionov and Shilshtein1996) and Zn-Er123 (Podlesnyak et al., Reference Podlesnyak, Kozhevnikov, Mirmelstein, Allenspach, Mesot, Staub, Furrer, Osborn, Bennington and Taylor1991). Our research paper will shed light on the subtle structural changes of the RBa2Cu2.9Zn0.1Oy system (ZnR123) (R = Nd, Gd, Y, Er, and Tm). The central aim of the present work is to investigate the effect of the R ions size on the structure of the system RBa2Cu2.9Zn0.1Oy toward a better understanding of the relationship between the structure and the superconductivity in these materials. Rietveld refinements of X-ray powder diffraction (XRD) data for ZnR123 samples are used to determine our structural parameters. These parameters will be used for the bond-valence sum (BVS) calculations.
II. EXPERIMENTAL
A. Synthesis of powders
Polycrystalline samples of RBa2Cu2.9Zn0.1Oy (R = Nd, Gd, Y, Er, Tm) were prepared via a solid-state reaction technique. The raw materials of R 2O3, BaCO3, CuO, and ZnO were thoroughly mixed in the proper ratio and calcined at 900 °C for 48 h in an air atmosphere and then quenched them to room temperature. Calcination was repeated with intermediate grinding until X-ray-diffraction (XRD) analysis confirmed the formation of a single-phase compounds. All samples were prepared under identical conditions.
B. Characterization
The XRD measurements have been done by Bruker D5000 powder diffractometer provided with a graphite monochromator and using CuKα radiation. The radiation was detected by a scintillation counter. The other measured parameters were a tube voltage of 40 kV and a tube current of 30 mA, goniometer radius of 125 mm, slit sizes: aperture 1 mm, scattered radiation 2 mm, and detector 0.6 mm. Patterns were measured at room temperature from 20° to 120° 2θ in 0.02° step width, counting for 10 s step.
Structure refinements were performed with the Rietveld method (Rietveld, Reference Rietveld1969) using the FULLPROF software (Rodríguez-Carvajal, Reference Rodríguez-carvajal1990) and the orthorhombic space group Pmmm. The wavelengths of CuKα 1, CuKα 2, and the intensity ratio were 1.540560 Å, 1.544330 Å, and 0.514, respectively. For structure refinement, most atomic positions were considered to be fully occupied, with the exception of the chain oxygen O4, and the O5 position along the a-axis direction, in order to register any oxygen disorder. The isotropic thermal displacements (Biso) of the oxygen atoms were fixed to 0.4 Å2. Cava et al. (Reference Cava, Hewat, Hewat, Batlogg, Marezio, Pabe, Drajewski, Peck and Rapp1990) reported that the Biso of oxygen atoms in the orthorhombic Y123 compound changes between 0.15 and 0.71 Å2. So, we choose the mean value of this range.
The scanning electron microscopy (SEM) measurements have been done to determine the grain size and homogeneity of the samples by the JEOL JSM-5900 instrument. No impurities were observed.
C. BVS calculations
Analysis of BVS has emerged as a simple but powerful tool to investigate the structures and superconducting properties of cuprates (Cava et al., Reference Cava, Hewat, Hewat, Batlogg, Marezio, Pabe, Drajewski, Peck and Rapp1990; Brown, Reference Brown1991; Tallon, Reference Tallon1991; Williams and Tallon, Reference Williams and Tallon1996). BVS calculation were performed using a method similar to that described in detail previously (Lundqvist et al., Reference Lundqvist, Tengroth, Rapp, Tellgren and Hegedüs1996). Therefore, only a few details are mentioned below. The atomic valence of an atom is assumed to be distributed between the bonds that it forms. BVS of atom i, denoted V i, is then  $V_i = \sum\nolimits_j {S_j} = \sum\limits_j {\exp [(R_0 - R_{ij})/0.37]} $, where S j is the valence of one bond, and the sum is over all neighbors j (Brown and Shannon, Reference Brown and Shannon1973). The constant 0.37 was empirically determined (Brown and Altermatt, Reference Brown and Altermatt1985). R 0 represents the length of a bond of a unit valence (Brown and Altermatt, Reference Brown and Altermatt1985), and R ij is the experimentally determined distance between atoms i and j. The BVS were calculated using the formulas suggested by Brown and Altermatt (Brown and Altermatt, Reference Brown and Altermatt1985) and implemented in FULLPROF.
BVS for oxygen was obtained by taking into account the valence of Cu (Lundqvist et al., Reference Lundqvist, Tengroth, Rapp, Tellgren and Hegedüs1996). The BVS of the plane copper is S(Cu2) = S(Cu2)n Cu2 + S(Zn)n Zn, where n Cu2 and n Zn are the occupancies of Cu and Zn at the copper site Cu2, respectively.
The distribution of charge in Cu2O planes can be characterized by the advanced BVS model of Tallon (Reference Tallon1991; Williams and Tallon, Reference Williams and Tallon1996). In this model, the hole concentration on the Cu2O planes is described by the parameter V − = 2+V Cu2–V O2–V O3 where V Cu2, V O2 and V O3 are the values of BVSs about the planer Cu2, O2 and O3 atoms, respectively. Another parameter, namely, V + = 6–V Cu2–V O2–V O3, is a measure of both lattice stress and charge distribution between Cu and O atoms.
III. RESULTS AND DISCUSSION
A. SEM results
The SEM topographs of the samples show a homogeneous stone-like grains with a typical size of several microns (Figure 1). This picture depicts that the average grain size decreases with the decrease of the ionic radius.
Figure 1. SEM micrographs of our samples (a) ZnNd123, (b) ZnGd123, (c)ZnY123, (d) ZnEr123, and (e) ZnTm123.
B. Rietveld refinement
Figure 2 displays the XRD profiles of ZnR123 at room temperature. These patterns indicate that the compounds of nominal composition with R = Nd, Gd, Y, Er, and Tm have a single-phase orthorhombic perovskite-like YBa2Cu3O7−δ structure. For samples ZnNd123 and ZnTm123, there are secondary phases belonging to BaCuO2 (noted as 011) phase. The reflections of this phase were excluded from the refinements.
Figure 2. X-ray powder diffraction patterns for samples.
A typical Rietveld refinement profile is presented in Figure 3; the results show that the structure remains orthorhombic with the space group Pmmm. We do not discuss here the oxygen occupancy because of the weak X-ray scattering power of the oxygen atoms. But, according to the study of Liyanawaduge et al. (Reference Liyanawaduge, Singh, Kumar, Awana and Kishan2010), we can say that our samples annealed in air are oxygen-deficient. Furthermore, the oxygen content is constant for the current series because of their synthesis under the same conditions. According to the refined R-factors and the difference curves (the experimental curve minus the fitted one), we believe that these refinements are good.
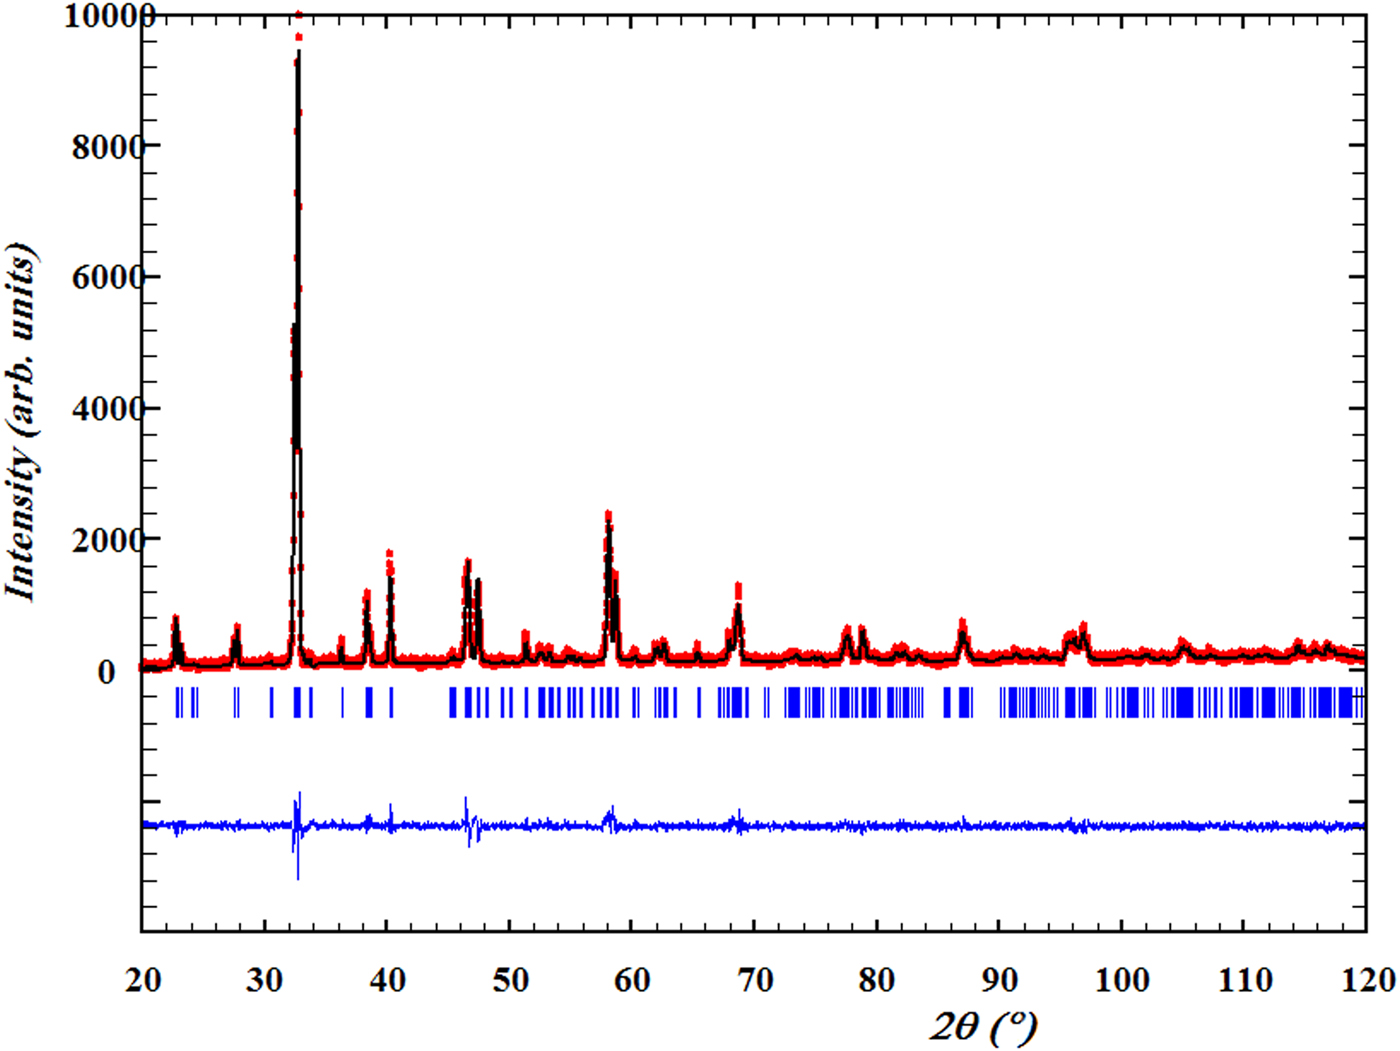
Figure 3. (Color online) Rietveld refinement profiles of YBa2Cu2.9Zn0.1Oy. The black line is the measurement results and the red line is the calculated profile. The vertical short line represents the position of the Bragg reflections. The difference curves were plotted at the bottom.
The lattice parameters for the RBa2Cu2.9Zn0.1Oy series of samples, where R = Y, Nd, Gd, Er, and Tm, were determined by Rietveld refinements. The lattice constants and unit-cell volumes vs. ionic radius are depicted in Figure 4(a). The lattice constants of the compounds ZY123 and ZEr123 are comparable with the lattice constants of other ZY123 and ZEr123 compounds (PDF 01-080-0855, Mazumder et al., Reference Mazumder, Rajagopal, Sequeira, Singh, Rajarajan, Gupta and Vijayaraghavan1989, PDF 01-086-0023, Podlesnyak et al., Reference Podlesnyak, Kozhevnikov, Mirmelstein, Allenspach, Mesot, Staub, Furrer, Osborn, Bennington and Taylor1991). It may be noticed that the lattice parameters, as well as the volume of the unit cell, increase as the ionic radius increases. This increase can be related to the size effect because of the variation in atomic volume, which results from R replacing for Y.
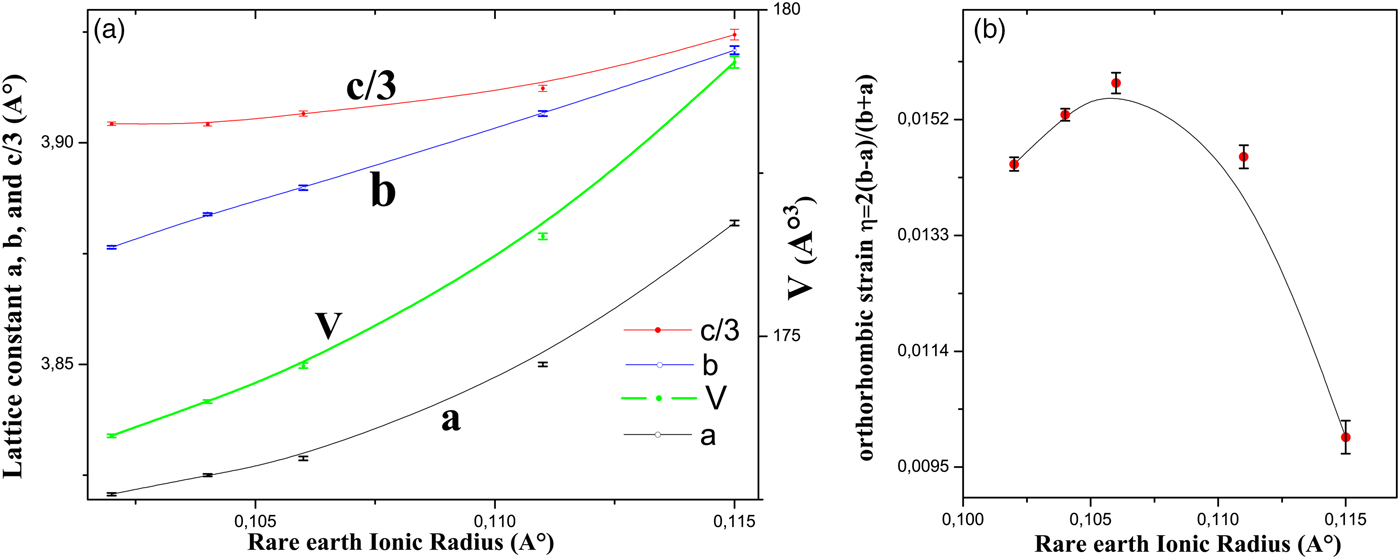
Figure 4. (Color online) (a) Lattice constants and the unit-cell volume. (b) Orthorhombic strain. Error bars are equal to three estimated standard deviation (ESD) obtained from the Rietveld refinement.
The relative changes of the lattice constants of a and b can be recognized from the normalized orthorhombic strain, which was calculated from the formula η = 2(b − a)/(b + a).
The orthorhombic strain is plotted in Figure 4(b). We can see that it increases and then decreases as the ionic radius increases. This is in contrast to the observation in fully oxygenated R123 (Guillaume et al., Reference Guillaume, Allenspach, Henggeler, Mesot, Roessli, Staub, Fischer, Furrer and Trounov1994) where it decreases as the ionic radius increases.
C. Bond lengths and angles
The bond lengths and angles are derived from the refined results. For a convenient discussion, the crystalline structure is illustrated in Figure 5, the positions of atoms and some chemical bonds are indicated.
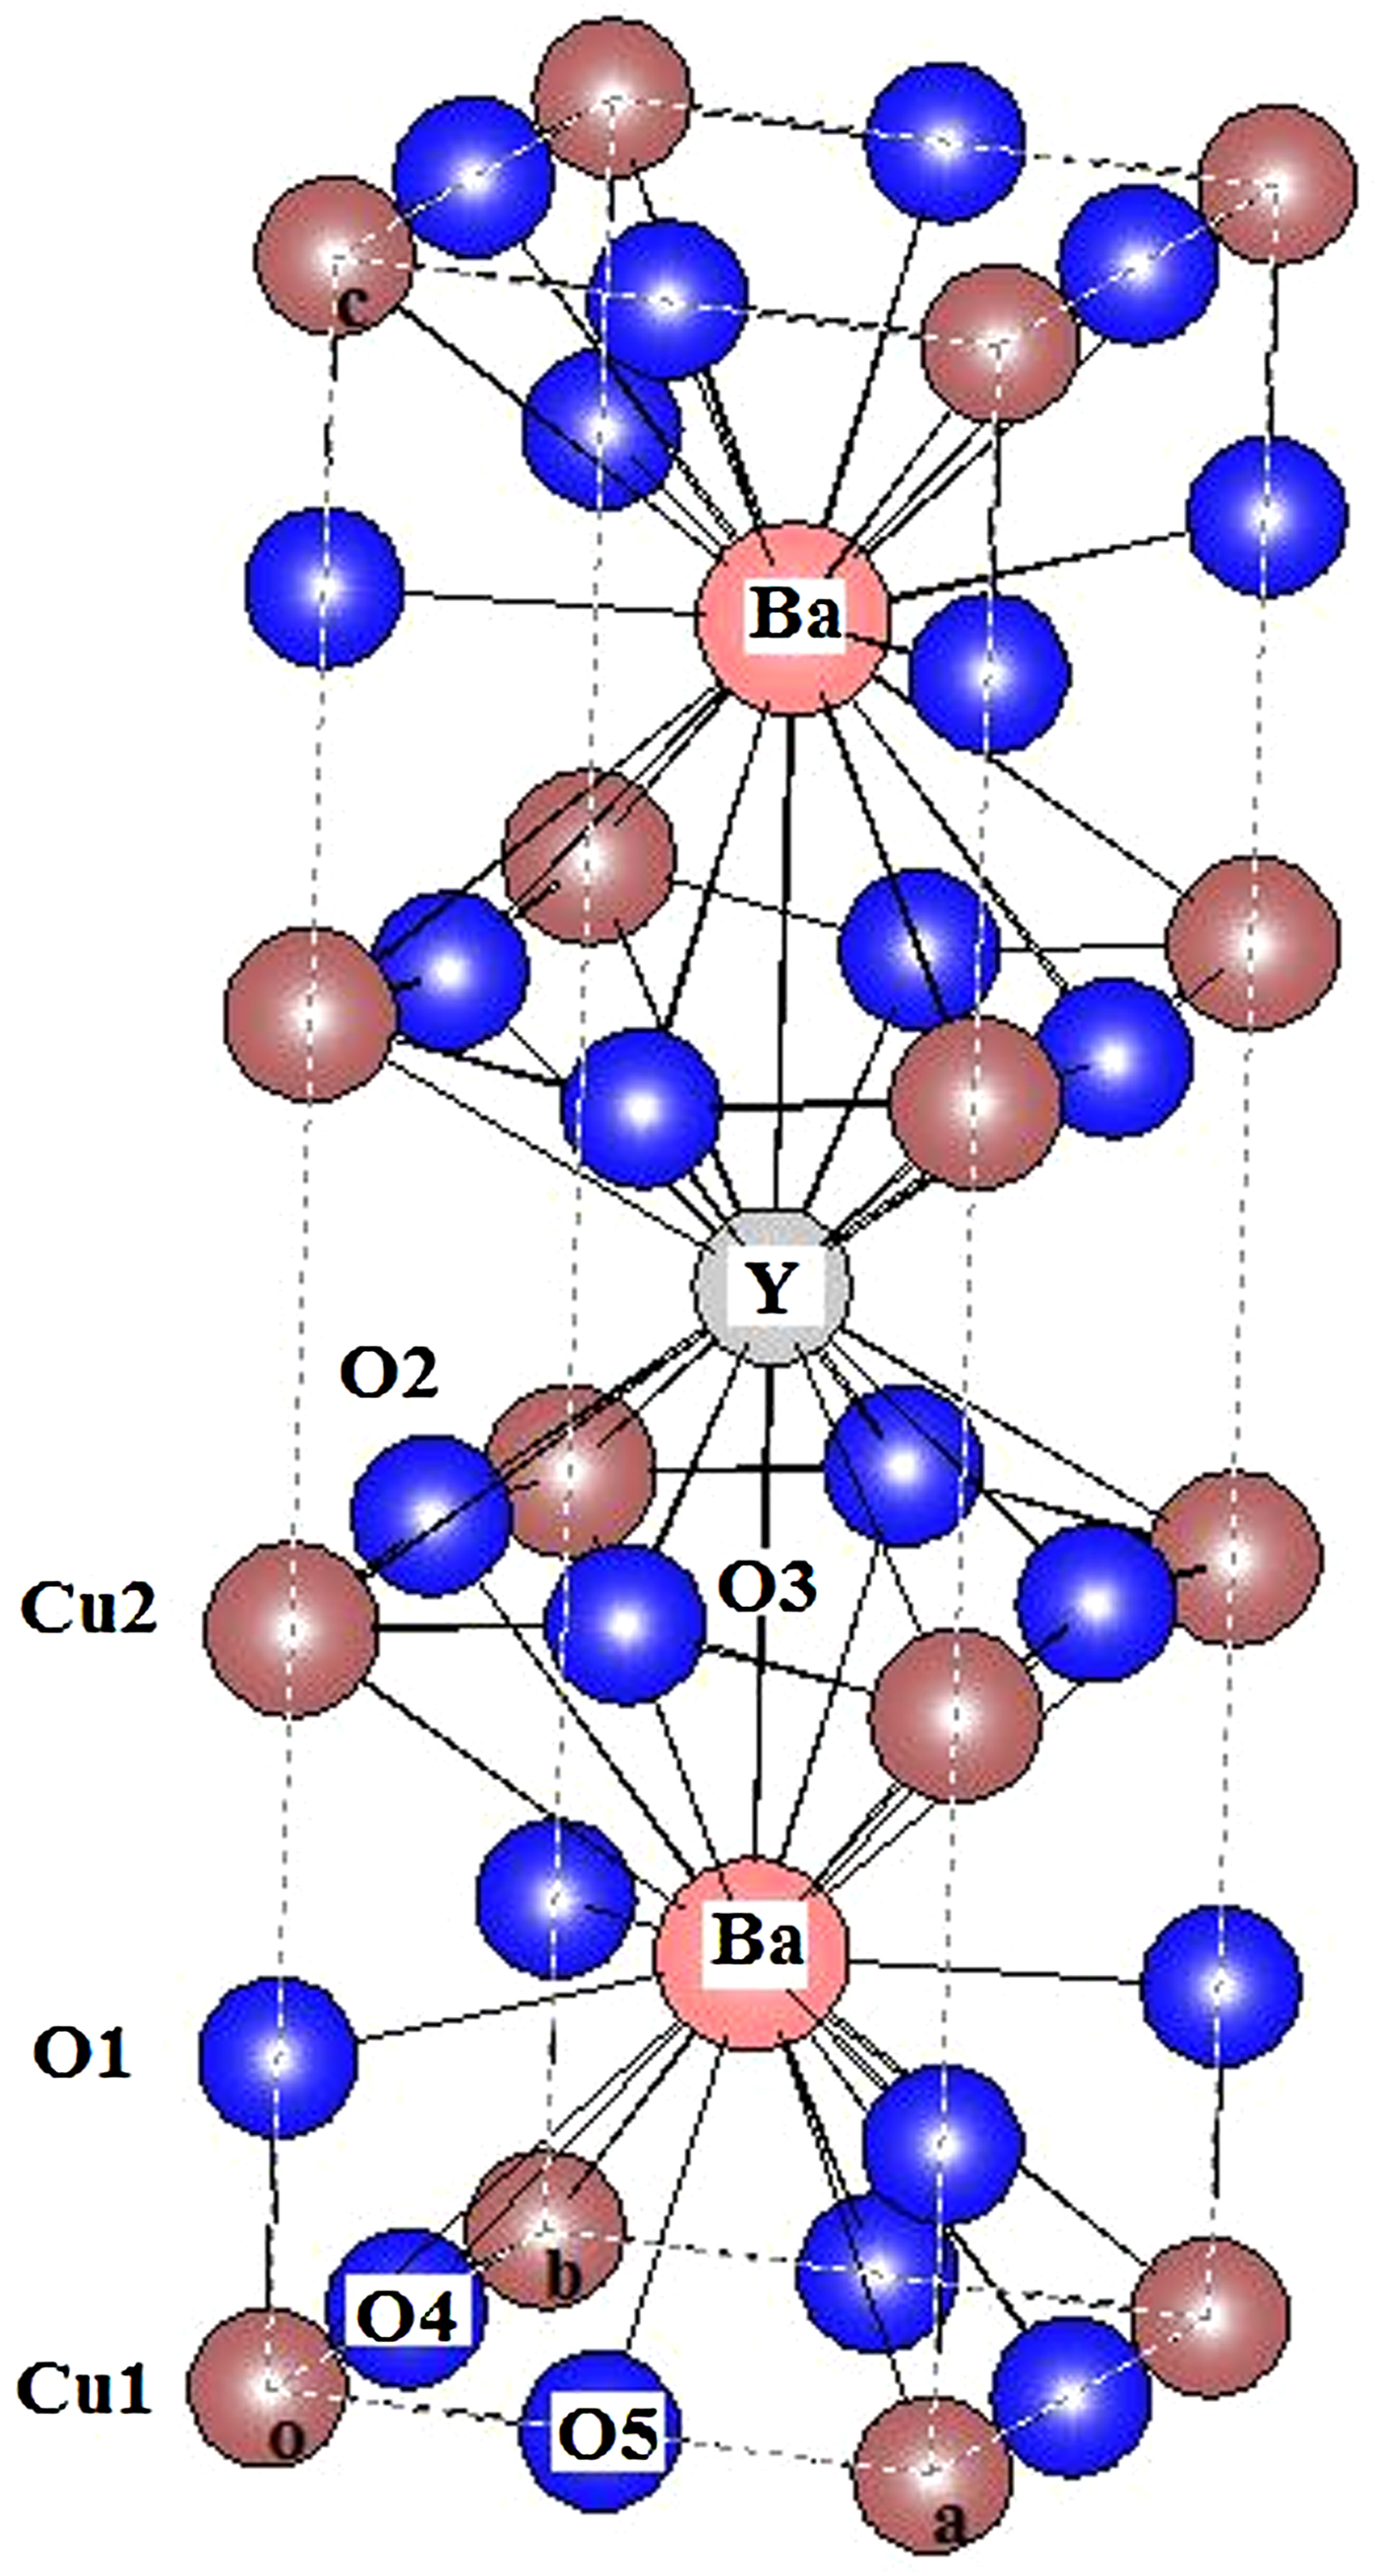
Figure 5. (Color online) Crystalline structure of ZnRCu1212, in which the bonds are indicated.
The bond angles Cu2–O2–Cu2, Cu2–O3–Cu2, Cu2–Cu2–O2, and Cu2–Cu2–O3 are called buckling angles. These bond angles affect directly the curvature of the Cu2O plane.
The bond angles Cu2–Cu2–O2 and Cu2–O3–Cu2 increase at the same time that Cu2–Cu2–O3 and Cu2–O2–Cu2 decrease, with increasing ionic radius and lowering T c [Figures 6(a) and 6(b)]. It is worth mentioning that these variations bring about a strong curvature of the Cu2O plane.
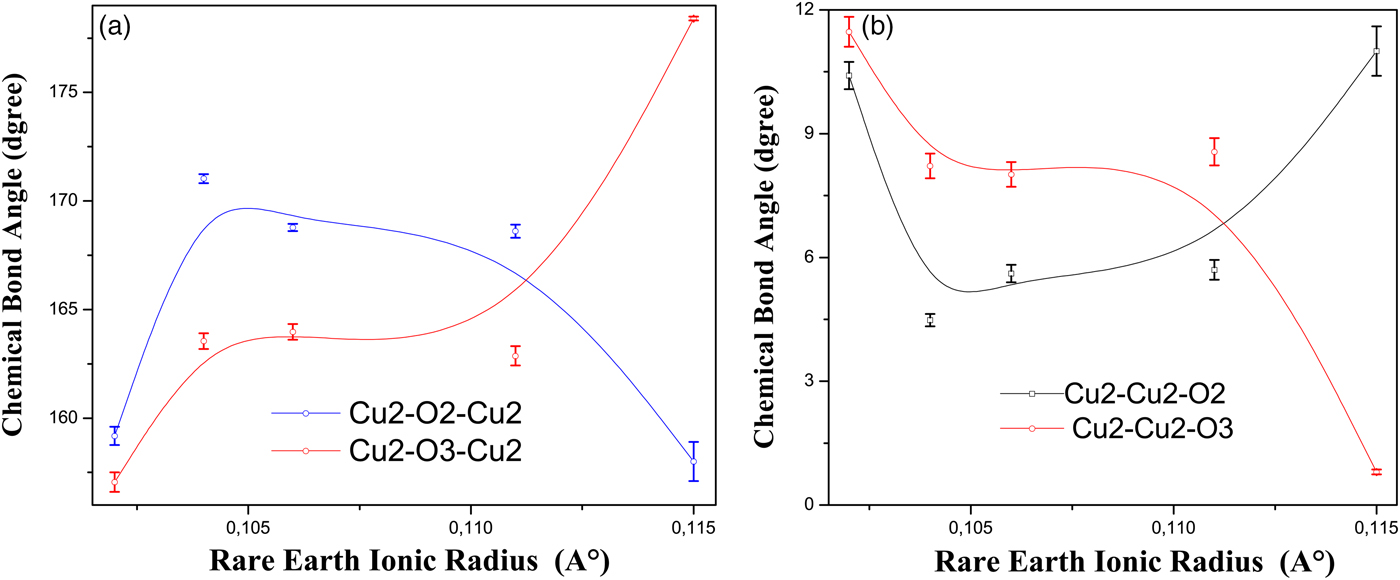
Figure 6. (Color online) The variation of the buckling angles with the ionic radius of Y and rare-earth elements. Error bars are equal to three estimated standard deviation (ESD) obtained from the bond angles calculations.
The bond angle Cu2–O2–Cu2 increases with lowering T c in the compounds NdBa2−xNdxCu3Oy and NdBa2−xPrxCu3Oy (Kramer et al., Reference Kramer, Dennis, Falzgraf and McCallum1997), and in the compound Er1−xCaxBa2Cu3Oy (Awana et al., Reference Awana, Malik, Yelon, Cardoso, de Lima, Anurag, Sedky and Narlikar2000b). This bond angle also increases with lowering T c in the self-compensating Y(Ca)Ba(La)123 system accompanied with the decrease of the bond angle Cu2–O3–Cu2 (Jin et al., Reference Jin, Hao, Zhang, Zhao and Zhang2010).
In the system Nd1−xPrxBa2Cu3Oy, the bond angles Cu2–Cu2–O(2,3) increase simultaneously with the decrease of T c (Ghorbani et al., Reference Ghorbani, Andersson and Rapp2004).
This strong curvature of the Cu2O plane found in our compounds is also confirmed by the decrease of the bond angle O3–R–O3 and the increase of the bond angle O3–Ba–O3 with the augment of ionic radius and the descent of T c (Figure 7).
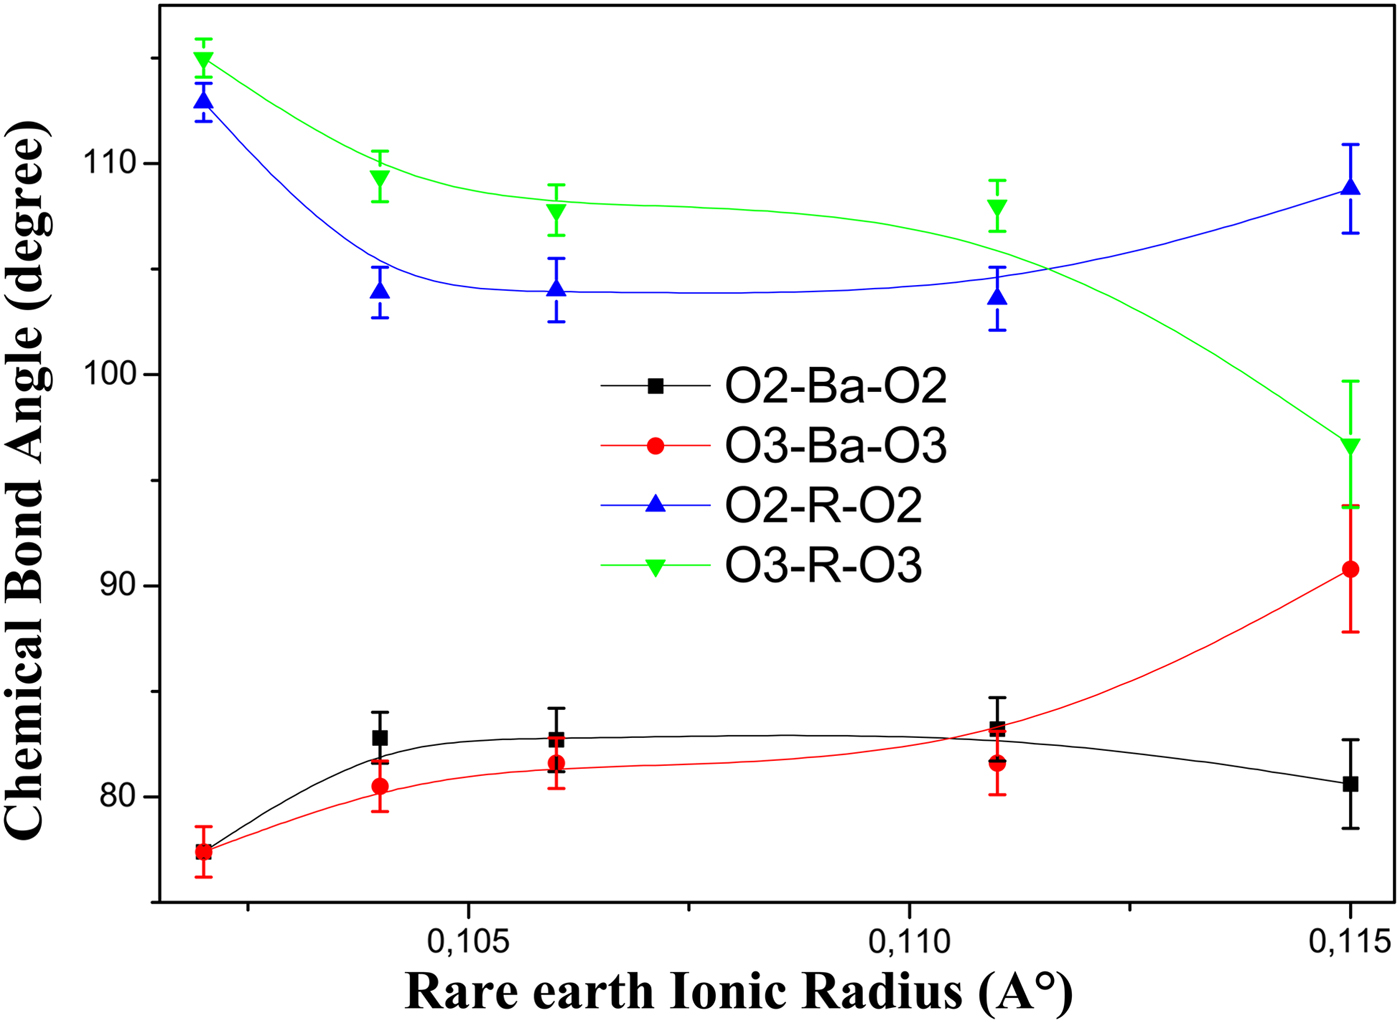
Figure 7. (Color online) The variation of bond angles between central atoms R and Ba and the Cu2O plane. Error bars are equal to three estimated standard deviation (ESD) obtained from the bond angles calculations.
These results indicate that the O3 atom has some displacement along the c-axis; approaching the BaO layer and away from the R atom layer. This displacement of the O3 atom is in contradiction to its displacement in the self-compensating Y(Ca)Ba(La)123 system with lowering T c (Jin et al., Reference Jin, Hao, Zhang, Zhao and Zhang2010).
We find that the angles O2–Cu2–O2, O3–Cu2–O3, and O2–Cu2–O3 are very stable (changing range from 62.72 to 63.66° for the two first ones and 87.94– 89.8° for the last one). Yu et al. also found a stable angle O2–Cu2–O3 changes between 88.7 and 89.5° in the Y(Pr)123 system and they called it “fixed triangle”, which is independent of the doping level in their system (Yu et al., Reference Yu, Jin, Zhao and Zhang2009). They concluded that their fixed triangle is located in between the perovskite block and the rock-salt block (Jin et al., Reference Jin, Hao and Zhang2009). In the Y(Pr)123 system, the distances Cu2–O2 and Cu2–O3 are also fixed (Yu et al., Reference Yu, Jin, Zhao and Zhang2009).
According to Figure 8, the bond angle O1–Ba–O1 that is situated in the BaO layer form a stable triangle. This bond angle is also situated between the perovskite block and the rock-salt block. Within our knowledge, this result has never been cited.
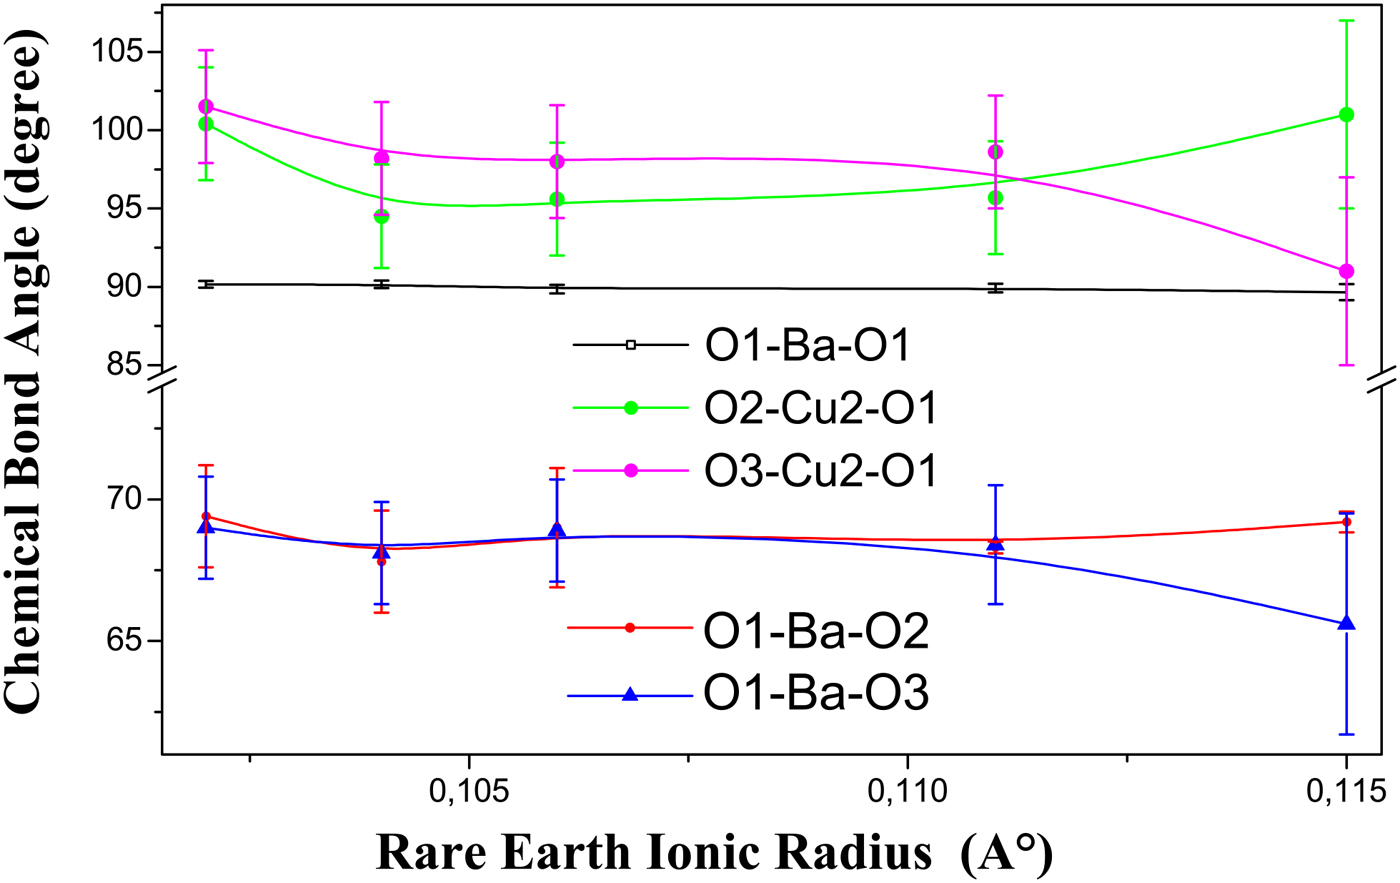
Figure 8. (Color online) The variation of some bond angles located in the BaO and between it and the Cu2O plane with the ionic radius of Y and rare-earth elements content. Error bars are equal to three estimated standard deviation (ESD) obtained from the bond angles calculations.
We can also notice the decrease of the bond angle O3–Cu2–O1 (Figure 8) which is in contradiction with its increase in the self-compensating Y(Ca)Ba(La)123 system, with the descent of T c, which contributes to the curvature of the Cu2O plane (Jin et al., Reference Jin, Hao, Zhang, Zhao and Zhang2010). So, the decrease of the bond angle O3–Cu2–O1 in our compounds confirm our preceding results about the displacement of the O3 atom toward the BaO layer.
Figure 9 shows bond lengths formed by the Cu2, Cu1, and Ba atoms. The distance Cu1–O1 decreases then increases slightly by about 0.04A°. This distance varies in the same way as the orthorhombic strain but in the opposite direction. On the other hand, the bond length Cu2–O1 decreases markedly with increasing ionic radius and lowering T c. The decrease of this latter is also reported in the system Y(Pr)123 with lowering T c (Yu et al., Reference Yu, Jin, Zhao and Zhang2009). In the pure Y123 and Er123 compounds, the distance Cu2–O1 increases markedly at the same time that the distance Cu1–O1 decreases slightly, with oxygen removal and the lowering of T c (Rupp et al., Reference Rupp, Pörschke, Meuffels, Fischer and Allenspach1989; Cava et al., Reference Cava, Hewat, Hewat, Batlogg, Marezio, Pabe, Drajewski, Peck and Rapp1990). In the system Nd1−xPrxBa2Cu3Oy with x < 0.2, the distance Cu1–O1 is constant but the distance Cu2–O1 shows a slight decrease (Ghorbani et al., Reference Ghorbani, Andersson and Rapp2004).
So, we can conclude that there is a positive correlation between T c and the Cu2–O1 bond length. The Cu2–O1 bond is just located between the perovskite block and the rock-salt block and connects them (Zhang et al., Reference Zhang, Cheng, Qin and Zhao2000). Jin et al. said that the weakening of the interaction between the two structural blocks corresponds to the lengthening of this chemical bond and then the increase of T c in the self-compensating Y(Ca)Ba(La)123 system from the underdoped region to the overdoped region (Jin et al., Reference Jin, Hao and Zhang2009). This is exactly the situation in our compounds.
The Ba site is located between the Cu2O superconducting plane and the Cu1O charge reservoir chains (Jorgensen et al., Reference Jorgensen, Veal, Paulikis, Nowicki, Grabtree and Kwok1990), which both have proved to be essential for superconductivity of 123 systems. We remark that the Ba atoms become closer to the plane Cu2O and farther from the Cu1O chain by the slight decrease of the distance Ba–Cu2 and the slight increase of the distance Ba–Cu1 (Figure 9). The Ba displacement toward the Cu2O plane is very clear for R = Nd. In addition to that, the distance Ba–O1 increases slightly with increasing ionic radius and lowering T c (Figure 9). This slight increase is also found in the pure Y123 compound with oxygen removal (Cava et al., Reference Cava, Hewat, Hewat, Batlogg, Marezio, Pabe, Drajewski, Peck and Rapp1990) and in the Y(Pr)123 system with increasing Pr content (Kinoshita et al., Reference Kinoshita, Matsuda, Shibata, Ishii, Watanabe and Yamada1988). We can directly relate this increase to the increase of the c-lattice parameter, but it is important in preventing the charge transfer from Cu1O chains to Cu2O planes, which takes place through the O(1) atom. We can also notice the stability of Ba–O4 distance and its noticeable increase for R = Nd (Figure 9). Cava et al. (Reference Cava, Hewat, Hewat, Batlogg, Marezio, Pabe, Drajewski, Peck and Rapp1990) reported the slight increase of this distance in the pure Y123 compound with oxygen removal and lowering T c.
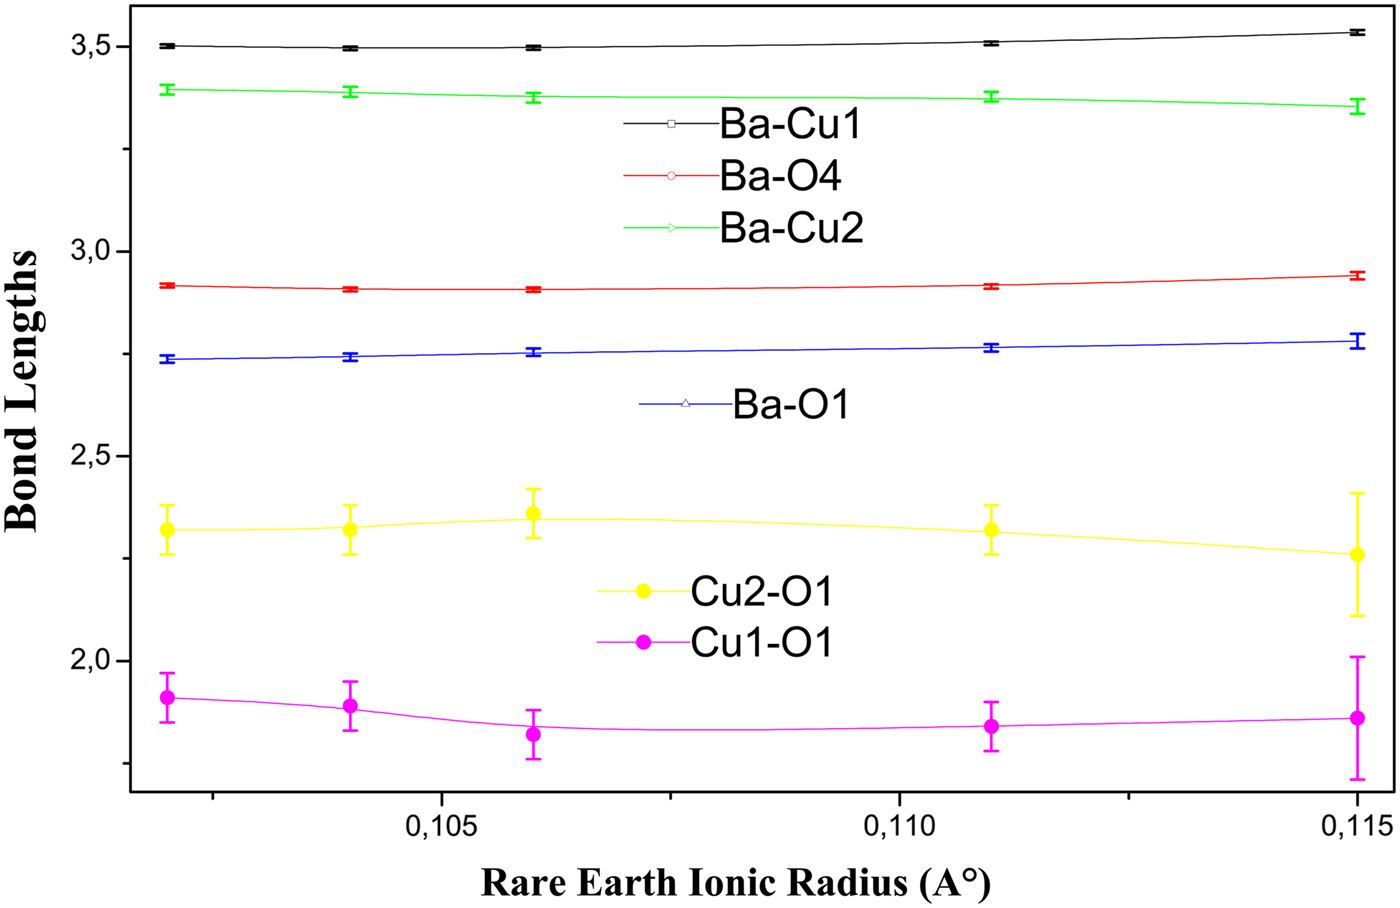
Figure 9. Bond lengths of Cu2, Cu1, Ba, and O1 atoms. Error bars are equal to three estimated standard deviation (ESD) obtained from the bond lengths calculations.
D. Bond-valence sum
In order to estimate the effect of varying bond distances on the valences of different atoms, it is useful to calculate BVS. Although, this method is empirical, it can nevertheless help to identify important trends when a series of related and similarly prepared samples are compared. Our results for the BVS are shown in Figure 10 for the present RBa2Cu2.9Zn0.1Oy samples.
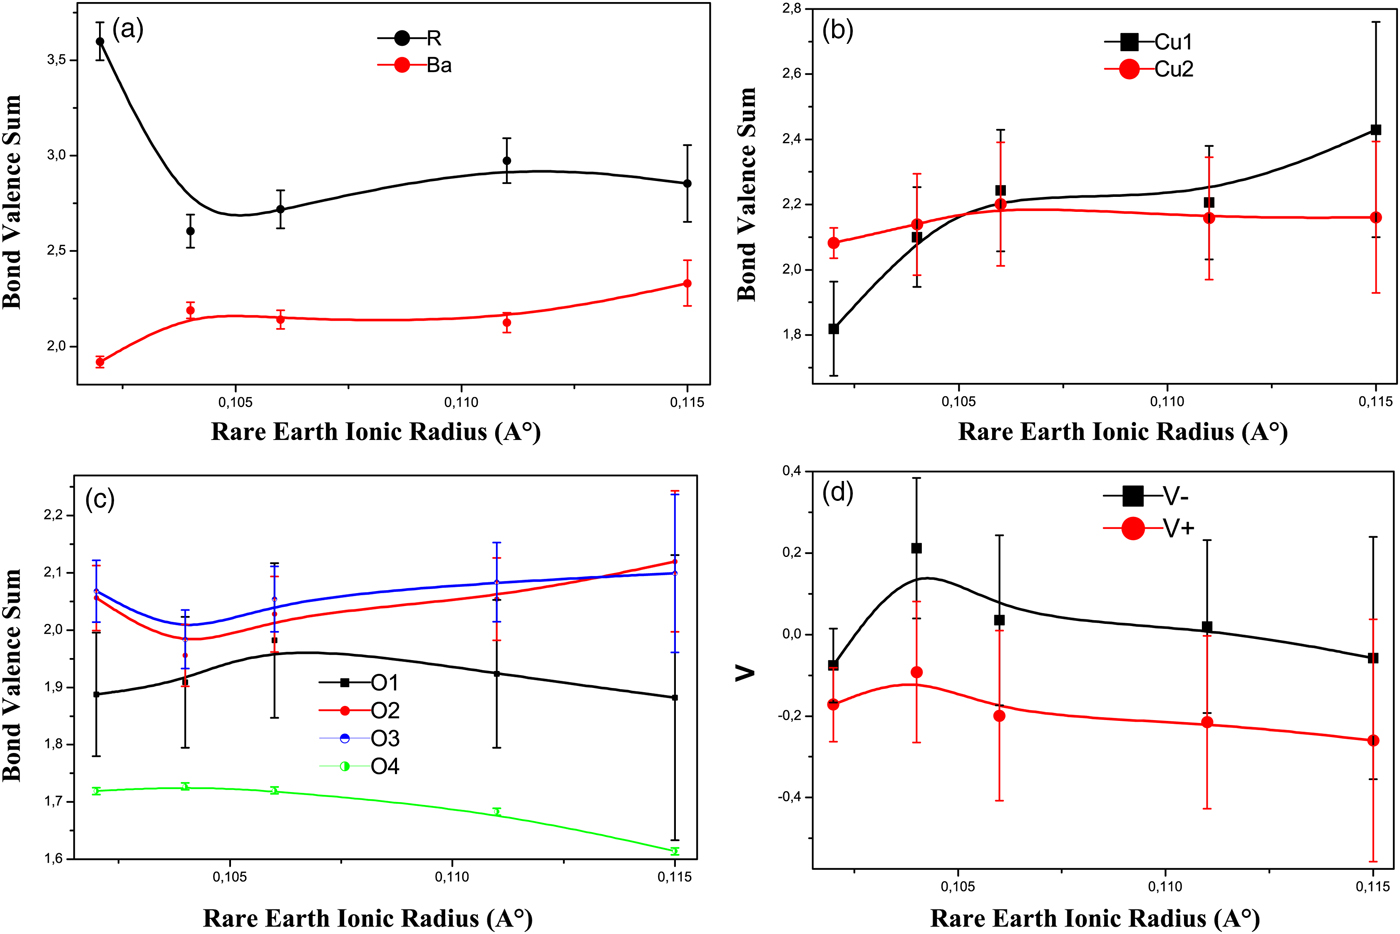
Figure 10. (Color online) The BVS of atoms in the RBa2Cu2.9Zn0.1Oy system vs. rare earths ionic radius. (a) For Ba and R. (b) For Cu1 and Cu2. (c) For O1, O2, O3, and O4. (c) V − and V +. Error bars are equal to three estimated standard deviation (ESD) obtained from the BVS calculations.
The various strains encountered in the R123 system can be better understood in terms of the bond valences at the rare-earth and barium ions. The valence sums calculated around R and Ba atoms are shown in Figure 10(a). Except for Tm, the bond valences on the rare earths show a smooth increase with increasing ionic radius like the pure compound (Ramesh and Hegde, Reference Ramesh and Hegde1994). We can observe that the R BVS is between 2.604 and 2.973, which represents a reasonable agreement with +3. The BVS value calculated for Tm is 3.599, and there is a considerable deviation from the expected value of the corresponding ion. This indicates that the Tm sublattice is highly strained and it needs a correction through a specific method mentioned in Pinto's article (Pinto et al., Reference Pinto, Gupta, Sharma, Sequiera and Gnanasekar1997).
The BVS of the Ba atom increases with increasing ionic radius and varies between 1.919 and 2.332 [Figure 10(a)]. Therefore, there is a change in geometric stress (the coordination polyhedron is too small for Ba with the large ion Nd and with the small ion Tm).
The BVS of the Cu1 atom increases with lowering T c, which is in good agreement with the pure R123 compounds (Samoylenkov et al., Reference Samoylenkov, Gorbenko and Kaul1997). On the other hand, the Cu2 atom BVS increases then decreases. In the pure R123, the bond valences at the Cu2 site increase with decreasing rare-earth radius and lowering T c (Ramesh and Hegde, Reference Ramesh and Hegde1994; Samoylenkov et al., Reference Samoylenkov, Gorbenko and Kaul1997).
Figure 10(c) shows the variation of BVS of oxygen atoms. The bond valences on the oxygen atoms O(2), O(3) in addition to the apical oxygen O(1) did not show a marked deviation from the ideal valency. However, the oxygen ions at O(4) site show a significant lower value of bond valence from the nominal value, suggesting that this oxygen site is more likely to share the holes on copper to a certain extent.
The decrease of Cu2 BVS signifies the decrease of the hole concentration on Cu2O planes. We can confirm this result by the calculation of the V − parameter. The total hole doping in the plane V − decreases with increasing ionic radius and lowering T c [Figure 10(d)]. This decrease of the V − parameter with lowering T c is also shown in the system Nd1−xPrxBa2Cu3O7−δ (Ghorbani et al., Reference Ghorbani, Andersson and Rapp2004). The total hole density in the planes was suggested by Tallon (Tallon, Reference Tallon1990) to correlate with the variation of T c between alloys with varying charge. The preference for holes to go to the oxygen atoms in the Cu2O plane, V +, was linearly correlated by Tallon to the maximum attainable T c in a particular alloy system. In our case, V+ decreases with increasing ionic radius and lowering T c [Figure 10(d)], which is in good agreement with the Nd1−xPrxBa2Cu3O7−δ system (Ghorbani et al., Reference Ghorbani, Andersson and Rapp2004).
IV. CONCLUSION
The results of the microstructural study of RBa2Cu2.9Zn0.1 system with R = Y, Nd, Gd, Er, and Tm shows that the average grain size is found to decrease with decreasing the ionic radius.
Through a detailed structural of the above mentioned compounds, we have found that the buckling angles Cu2–Cu2–O2 and Cu2–O3–Cu2 increase at the same time when Cu2–Cu2–O3 and Cu2–O2–Cu2 decrease. In addition to that, the bond angles O3–R–O3 and O3–Cu2–O1 decrease simultaneously as O3–Ba–O3 increases.
The variation of these bond angles brings about a strong curvature of the Cu2O plane. The nature of this curvature is noticeably different from the ones found in any other compound. As a matter of fact, it is widely recognized that there is a good correlation between the curvature of the Cu2O plane and the apparition of superconductivity.
We have also noticed the existence of three fixed triangles formed by the Cu2, O2, O3 atoms in addition to another fixed triangle O1–Ba–O1 observed for the first time. We can notice here that these fixed triangles are situated in the boundary of the perovskite block and the rock-salt block. We have also found a decrease in the apical distance Cu2–O1 with increasing ionic radius and lowering T c. In addition to that, BVS of Cu2 increases then decreases. Its variation is unique compared with its variation in other compounds cited in previous research papers.
SUPPLEMENTARY MATERIAL
The supplementary material for this article can be found at https://doi.org/10.1017/S0885715618000520.
ACKNOWLEDGEMENT
The authors are grateful to Professor M. Gonon, Unité de Recherche sur les Céramiques et les Vitrocéramiques, Faculté Polytechnique de Mons, Belgium, for help in sample preparation, X-ray analysis, and MEB-EDS measurements.


