Introduction
African yam bean (AYB; Sphenostylis stenocarpa Hochst ex A. Rich. Harms), is an annual climber in the family Fabaceae usually cultivated as an annual crop for its seeds and small edible tubers. The crop is adapted to a wide range of geographical, climatic and edaphic zones (Potter, Reference Potter1992). Although there are cultivated varieties, notwithstanding, the crop remains underutilized and a lesser-known legume (Saka et al., Reference Saka, Ajibade, Adeniyan, Oluwoyo and Ogunbodede2004). AYB has the potential of broadening the human food base for the African ever-growing population (Potter, Reference Potter1992; Ibirinde et al., Reference Ibirinde, Aremu, Balogun and Oladokun2019). It is an important source of plant protein, mineral elements and fibre (Uguru and Madukaife, Reference Uguru and Madukaife2001; Ekpo, Reference Ekpo2006), especially for the rural dwellers (Padulosi et al., Reference Padulosi, Thompson and Rudebjer2013). Besides, there are pieces of evidence of medicinal use of the leaves and seeds for treating ailments (Asuzu, Reference Asuzu1986).
Due to neglect and underutilization of AYB despite its potentials, the diversity spectrum may gradually reduce by genetic erosion if no intervention is given. To prevent this, accurate evaluation of the existing germplasm for genetic diversity is imperative. AYB accessions have been characterized by morphological and nutritional descriptors (Ajibade et al., Reference Ajibade, Balogun, Afolabi, Ajomale and Fasoyiro2005; Fasoyiro et al., Reference Fasoyiro, Ajibade, Omole, Adeniyan and Farinde2006; Popoola et al., Reference Popoola, Adegbite, Obembe, Adewale and Odu2011a; Adewale et al., Reference Adewale, Dumet, Vroh-Bi, Kehinde, Ojo, Adegbite and Franco2012; Ibirinde et al., Reference Ibirinde, Aremu, Balogun and Oladokun2019), isozyme (Potter and Doyle, Reference Potter and Doyle1992) and chromosome studies (Adesoye and Nnadi, Reference Adesoye and Nnadi2011; Popoola et al., Reference Popoola, Adegbite and Obembe2011b). However, morphological data alone are inadequate for genetic diversity study due to possible influence by the environment. Although cytogenetic information may reveal genetic peculiarity within the germplasm and less subjective, the entire process may be laborious. Hence, there is a need for a more precise and reliable method of genetic diversity analysis.
Molecular markers which circumvent the limitations of conventional characterization and diversity studies are a powerful and reliable tool to resolve taxonomic identity, estimate genetic diversity, assess kinship relationships and determine the evolutionary sequence of an organism. Moyib et al. (Reference Moyib, Gbadegesin, Aina and Odunola2008) used RAPD for the diversity study of some AYB accessions. But sometimes, the RAPD alleles may not detect the dominant traits of interest (Collard et al., Reference Collard, Jahufer, Brouwer and Pang2005). Ojuederie et al. (Reference Ojuederie, Morufat, Iyiola, David and Mercy2014) and Adewale et al. (Reference Adewale, Vroh-Bi, Dumet, Nnadi, Kehinde, Ojo, Adegbite and Franco2015) both reported diversity of the AYB based on AFLP and recently, Shitta et al. (Reference Shitta, Abberton, Adesoye, Adewale and Oyatomi2016) demonstrated the use of SSR markers from cowpea to assess the genetic diversity of AYB. But no information is available on the combined use of morpho-agronomic traits and inter simple sequence repeat (ISSR) markers in the study of genetic diversity of AYB accessions. The use of ISSR marker could provide useful information on the microsatellite region divergence and reveal the intra-genomic relationship among the accessions. To this end, the present study sought to assess the genetic diversity and allelic polymorphism among some accessions of AYB using both morpho-agronomic traits and ISSR markers. The findings from this study will further enrich available genetic diversity information of the AYB germplasm and also help to identify elite accessions for selection, conservation and improvement.
Materials and methods
Accession collection
A total of 16 AYB accessions (TSs-115, TSs-77, TSs-86, TSs-1, TSs-96, TSs-87, TSs-2, TSs-111, TSs-88, TSs-91, TSs-81, TSs-84, TSs-79, TSs-90, TSs-95 and TSs-82) were used for the study. The accessions are part of the AYB germplasm maintained by the Genetic Resource Center, International Institute of Tropical Agriculture (IITA), Ibadan, Nigeria.
Morpho-agronomic evaluation of the accessions
The morpho-agronomic evaluation of the AYB accessions was carried out at the Botanical Garden, the University of Ilorin, Ilorin Nigeria, located on latitude 8°24′N–8°36ʹN and longitude 4°10ʹE–4°36ʹE. Ilorin is characterized by both rain and dry seasons, but the rainfall pattern exhibits variability both temporarily and spatially. The total annual rainfall in the area is about 1200 mm (Ajadi et al., Reference Ajadi, Adedapo and Tunde2011; NIMET, 2016). During the rainy season, the relative humidity is between 75 and 80% and about 65% during the dry season. The temperature ranges from 30 to 34°C from May to January and fluctuates between 34 and 43°C from February to April (Ilorin Atlas, 1982). The mean monthly temperatures vary from 25 to 28.9°C. Day time is usually sunny for about 6.5–7.7 h daily from November to May (Olaniran, Reference Olaniran1982, Reference Olaniran1988; Ajadi et al., Reference Ajadi, Adedapo and Tunde2011).
The pot experiment was carried out in the screen house at the botanical garden. Seeds of each accession were sown into a planting pot (30 × 25 cm) filled with loose garden soil in late March. The experiment was set out in complete randomized design in five replicates with 0.75 m in-between the row and pot to pot. The percentage germination of the accessions was determined by finding the fraction of the germinated seeds to the number of planted seeds in percentage. Watering was carried out every other day; weeding, staking and cultural practices were performed as at when due. Quantitative morpho-agronomic traits such as shoot length, number of leaves, leaf length and breadth, number of primary branches and stem girth were evaluated every 2 weeks from the day of sowing until 12 weeks after sowing (WAS). At maturity, data were collected in five replicates on number of days to flowering, number of flower clusters per plant, number of flowers per cluster, number of flowers per plant, number of days to pod formation, and number of filled pods per plant. Other traits studied include pod length, pod width, number of seeds per pod, seed dimensions and 100-seed weight. Parameters such as stem length, leaf length, leaf breadth, and pod length and width were measured using tape rule while stem girth and seed dimension were determined with the aid of digital Vernier calliper (ATD-8656). The number of leaves per plant, days to flowering, flower per cluster and filled pod per plant were counted, and the 100-seed weight was determined by direct weighing using a sensitive balance (Metler balance, PL 300).
The collected data were subjected to analysis of variance using SPSS Statistical software for Windows (version 20). Means that were significantly different at P < 0.05 were separated with New Duncan multiple range tests (N-DMRT). Traits correlation matrix at P < 0.05 and 0.01 were generated using GenStat 19th Edition (VSNI, UK); multivariate analysis was conducted and the hierarchical cluster was constructed based on the UPGMA method (Sokal and Michener, Reference Sokal and Michener1958).
Molecular characterization of the accessions
Genomic DNA (gDNA) was extracted from the young tender leaf of each AYB accession with the aid of Quick-DNA plant extraction mini kit (Zymo Research Corp., USA) following the manufacturer's instructions. The extracted gDNA quality was checked on 0.8% agarose gel as described by Animasaun et al. (Reference Animasaun, Morakinyo, Mustapha and Krishnamurthy2015). The concentration was determined by Nanodrop 800 spectrophotometer (Thermo Scientific, Waltham, Massachusetts, USA). Amplification by polymerase chain reaction (PCR) was performed with 12 already optimized ISSR markers, synthesized on request (Eurofins, Germany). The PCR was performed on a 96-well thermocycler (Applied Biosystems, San Francisco, California, USA). The reaction mixture contained 1 μl of 80 ng gDNA, 1 μl of primer, 12.5 μl of 2× master mix (New England Biolabs, UK) and the final reaction volume made up with nuclease-free water (Ambion) to 25 μl in a thin wall 200 μl PCR tube (Axygen). The PCR protocol was run as described by Animasaun et al. (Reference Animasaun, Morakinyo, Mustapha and Krishnamurthy2015).
The amplified products were checked and separated on 1.5% agarose gel, stained with EtBr dye in 1× TEA buffer and electrophoresed for 45 min at a constant voltage of 100 V in a gel tank assembly (Biorad, USA). The amplicon size obtained from the markers was determined from the gel by comparison with the standard molecular 1 Kb Plus (3000-100 bp) DNA ladder (Thermofisher, USA). The gel was visualized under a UV-transilluminator to check the amplified fragment and then photographed in a Gel documentation system (Ingenius-3, Syngene, USA).
From the electrophoregram, the PCR fragments were scored for absence (0) or presence (1) of equal-sized bands anticipated from the DNA ruler. Two matrices of the different ISSR phenotypes were assembled, entered into a binary matrix and used for the statistical analysis. Only fragments that are distinct and clear with amplified polymorphic loci across the accessions were considered. The frequencies of loci and alleles amplification were determined and the combined effect of the markers anticipated. The percentage polymorphism for the primers across all the detected loci of each accession was calculated as described by Martos et al. (Reference Martos, Royo, Rharrabti, GarciaKul, Amoatey, Bansa and Kumaga2001). Principal coordinate (PCo) analysis and diversity indices were conducted and cluster analysis was performed by an agglomerative technique using the Un-weighted Pair Group Method with Arithmetic mean (UPGMA) algorithm in the MEGA4.0 software. Genetic diversity and the anticipated relationships between the accessions were graphically presented as dendrogram and phylogram.
Results
Morphological variation and diversity
The evaluation of the AYB accessions revealed significant variation in their agro-morphological traits and genetic relationship, which can be exploited for selection, improvement and germplasm conservation. Germination commenced on the sixth day after sowing (DAS) with noticeable emergence of the shoot in accessions TSs-79 and TSs-111. Germination occurred in all other accessions between 8 and 10 DAS. Nine (TSs-1, TSs-115, TSs-91, TSs-79, TSs-81, TSs-84, TSs-82, TSs-90 and TSs-95) out of the 16 accessions had percentage germination above 80% while the remaining seven recorded percentage germination >50 but <80, the least (52%) occurred in TSs-2.
The results of the vegetative growth parameters evaluated from 2 to 10 WAS is presented in online Supplementary Fig. S1. The stem length of the accessions varied significantly (P < 0.05) at 2 and 4 WAS (online Supplementary Fig. S1a). The longest shoot (92.37 cm) was recorded in TSs-82 and the least (53.80 cm) occurred in TSs-80 at 4 WAS. At 6 and 8 WAS, shoot length were similar for all the accessions. However, at 10 WAS, accessions TSs-115 and TSs-96 had the longest vine of 280.00 and 285.01 cm, respectively, against the lowest value (118.47 cm) recorded in TSs-90. The terminal leaf breadth of the accessions ranged from 2.07 to 3.17 cm at 2 WAS, with the highest in TSs-111 (online Supplementary Fig. S1b). Generally, broader leaves were observed at 2 WAS, the terminal leaf breadth of all the accessions was not significantly different at 4–10 WAS. This trend was similar for the terminal leaf length, for which TSs-88 recorded the least values throughout evaluation (online Supplementary Fig. S1c). In term of leaf formation, there was no significant difference in the number of leaves per plant at 2–4 WAS. At 2 WAS, all the accessions had two leaves per plant which increased to 5.2–6.9 at 4 WAS (online Supplementary Fig. S1d). From 6 to 10 WAS, TSs-96, TSs-115 and TSs-97 significantly maintained the highest average number (28.2, 29.7 and 31.6) of leaves per plant. The number of primary branches per plant was generally poor among the accessions (online Supplementary Fig. S1e). Only six accessions had an average of one branch per plant at 4 WAS, and at 8 WAS, no branch was found in TSs-91 and TSs-95 while TSs-77 recorded an average of three branches per plant. Whereas branch formation remained low at 10 WAS, where TSs-115 had the highest number (6.0) of primary branches. Other accessions had at least two main branches with exception of the poorly branched TSs-82 and TSs-88 which had a mean of 1.33 primary branches per plant. Across the weeks of evaluation, the accessions’ stem diameters were similar and exhibited no significant variability (online Supplementary Fig. S1f).
Analysis of the growth parameter of the accessions at 12 WAS showed significant variations at P < 0.05 (Table 1). Accessions TSs-96 and TSs-115 had the longest shoot length of 321.63 and 304.92 cm, respectively, while mean shoot length among other accessions was above 200 cm, and accessions TSs-77, TSs-79 and TSs 90 had less (Table 1). The number of leaves per plant ranged from 28.80 to 46.47. Accession TSs-87 had the highest number of leaves (46.47), followed by TSs-115 (41.73), all other accessions had less than 40 leaves per plant, out of which seven accessions recorded leaf number between 28.0 and 30.0. The terminal leaf length varied from 5.45 to 7.90 cm, whereas all the accessions had leaf length above 6.0 cm, and two (TSs-88 and TSs-95) had less. In contrast to leaf length, leaf breadth was similar for all the accessions except for TSs-95 which had the narrowest leaves. TSs-115 was the most branched accession with an average of 6.0 primary branches per plant, followed by three other accessions (TSs-77, TSs-86 and TSs-111) which had 4.33. The duo of TSs-88 and TSs-95 had the least branch (1.33 branches per plant). Meanwhile, the primary stem girth of the accessions taken at 10 cm above the ground was not statistically different.
Table 1. Growth parameters of African yam bean accessions evaluated for variability and genetic diversity at 12 weeks after sowing

SL, stem length; NL, number of leaves per plant; TLL, terminal leaf length (for the middle leaflet); TLB, terminal leaf breadth (for the middle leaflet); NPB, number of primary branches; SG, stem girth at 10 cm above the soil surface.
The values are mean of five replicates, mean in the same column having the same superscript are not significantly different at P ≤ 0.05.
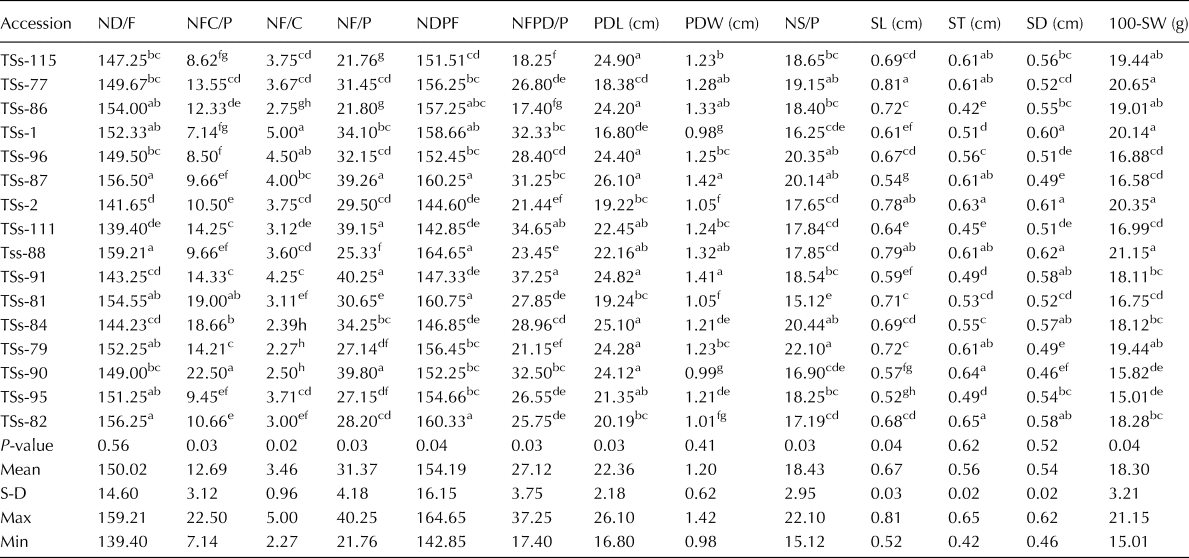
At maturity, flower and seed-related traits of the accessions varied significantly (P < 0.05) as shown in Table 2. Flowering was noted in TSs-88 at 53 DAS (online Supplementary Plate S1a), but the flower degenerated and aborted without pod formation after 4 d. Proper flowering commenced with TSs-111 (139.40 DAS), the average days to flowering of the accessions was 150.2 d. Eight accessions that had less than mean flowering days are early flowering accessions. Also, the number of flower cluster per plant varied significantly among the accessions. TSS-90, TSs-81 and TSs-84 produced the highest number of flower cluster per plant (22.0, 19.0 and 18.66, respectively), while accession TSs-1 had the least (7.14). TSs-91, TSs-87, TSs-111 and TSs-90 had a higher number of flowers with an average of 40.25, 39.26, 39.15 and 39.80 flowers per plant, respectively. Seven accessions had less than the mean number of flowers per plant.
Table 2. Flower and seed-related characters of African yam bean accessions assessed for variability and genetic diversity

ND/F, number of days to flowering; NFC/P, number of flower cluster per plant; NF/C, number of flower per cluster; NF/P, number of flower per plant; NDPF, number of days to pod formation; NFPD/P, number of filled pod per plant; PDL, pod length; PDW, pod width; NS/P, number of seed per pod; SL, seed length; ST, seed thickness; SD, seed diameter; 100-SW, 100 seed weight; S-D, standard deviation; Max, maximum value; Min, minimum value.
The values are mean of five replicates, mean in the same column having the same superscript are not significantly different from each other at P ≤ 0.05.
The number of days to pod formation followed the same trend with the number of days to flowering with an average of 154.19 d (Table 2). The mean number of filled pods per plant was the highest (37.25) for TSs-91. The overall mean for the accessions was 27.12, while six accessions had a lesser number of filled pods per plant. TSs-86 which had 21.80 flowers per plant only produced 17.40 filled pods per plant. Pod length and width (online Supplementary Plate S1b–d) of the accessions varied significantly at P < 0.05 (Table 2). The average pod length for the accessions was 22.36 cm with seven accessions producing pods that had length less than the average length. Meanwhile, TSs-87 produced pods with a mean length of 26.10 cm. This trend was also similar for pod width, but the least (0.99 cm) was recorded in TSs-1 and TSs-90. Like the pod length and width, the number of seeds per pod varied significantly across the accessions. Although the average seeds per pod for the accessions was 18.43, four accessions (TSs79, TSs-84, TSs-87 and TSs-96) had more than 20 seeds per pod, and only seven accessions had higher than the mean number of seeds per pod.
Seed dimension (seed length, thickness and breadth) varied for the accessions but notwithstanding, bigger seeds were obtained from TSs-77, TSs-2 and TSs-111 which had seed dimension higher than the mean for the accessions (Table 2). The average seed length for the accessions was 0.52–0.81 cm, seed thickness was 0.42–0.64 cm and the seed breadth ranged from 0.49 to 0.62 cm. The weight of 100 seeds per accession varied significantly (P < 0.05) as shown in Table 2 with four accessions producing the heaviest seeds in the order TSs-111 > TSs-77 > TSs-2 > TSs-1. The mean values for the accessions were 18.30 g. Only seven of the accessions recorded 100-seed weight greater than the mean value, while TSs-95 produced the lightest seeds (15.01 g). The seed coat colour of the accessions was diverse ranging from light brown to tan brown and dark brown (online Supplementary Plate S2).
The reproductive related traits of the AYB accessions (online Supplementary Fig. S2) showed the number of days to flowering did not deviate from the mean (150.02). This trend was similar for traits such as number of days to pod formation, number of filled pods per plant and pod length. In contrast for the accessions, the number of flower cluster per plant skewed towards the positive which showed that flower cluster per plant was higher than the mean value for most accessions. In term of the number of flowers per cluster, the number of seeds per pod and 100-seeds weight, the obtained data skewed positively which indicated that most accessions recorded values higher than the average. Meanwhile, for seed dimension (length, breadth and thickness) and pod width, only a few accessions had performance below the mean.
There were significant correlations between the evaluated parameters of the accessions (Fig. 1). At P < 0.01, leaf length and leaf breadth had a strong positive correlation (r = 0.853), also strong associations were found between the days to flowering and days to pod formation (r = 0.983). The number of flowers per plant and days to pod formation (r = 0.931), seed length and seed weight (r = 0.774) were also strongly correlated. Furthermore, the number of primary branches correlated with leaf breadth and length at P < 0.05. Also, correlations existed between the number of leaves, leaf length, leaf breadth and the number of primary branches. Other traits with positive correlations are stem girth and leaf length, breadth, and the number of primary branches; shoot length and number of primary branches, the number of flowers per plant and number of flowers per cluster; stem girth and the number of leaves. Besides pod width and pod length, pod length and the number of seed per pod, as well as the pod width, had positive associations (Fig. 1).

Fig 1. Correlation matrix of agronomic traits of African yam bean accessions evaluated for variability and genetic diversity showing two-tail correlations of traits. Deep blue signifies strong negative correlation, blue for negative correlation, cyan for no correlation, yellow for weak positive correlation, magenta for significant correlation at P < 0.05 (0.35–0.75 scale), and deep brown for characters that correlated at P < 0.01 (≥0.75 scale). 100-SW, 100-seed weight; LB, leaf breadth; LL, leaf length; NB, number of primary branches; NDF, number of days to flowering; NDPF, number of days to pod formation; NFC, number of flowers per cluster; NFCP, number of lower clusters per plant; NFP, number of flowers per plant; NFPDP, number of filled pods per plant; NL, number of leaves; NSP, number of seeds per pod; PDL, pod length; PDW, pod width; SD, seed diameter; SG, stem girth; SL, seed length; SL, vine length; ST, seed thickness.
Thirteen principal components contributed to the observed variation in the accessions (online Supplementary Table S1), but out of these, principal components (PCA) 1 and 2 accounted for 25.13 and 16.64%, respectively, making up 41.77% of the total observed variation (Fig. 2). The PCA 1 had positive loading for a mixture of vegetative and reproductive characters, which include the number of flowers per cluster, days to flowering, number of leaves per plant, leaf length, leaf breadth, stem girth and number of branches. The PCA 2 contribution to the variations among the AYB accession was based on flower and seed-related traits such as the seeds per pod, flower cluster per plant and number of filled pods per plant. Most of the evaluated parameters had negative loading on principal axis 3, while variations in the fourth components were ascribed to leaf breadth, stem length, the number of days to flowering and 100-seed weight.

Fig. 2. Principal component biplot analysis showing the contributions of the major components to agro morphological traits variation of African yam bean accessions. Numbers 1–16 are the accessions in the order: TSs-115, TSs-77, TSs-86, TSs-1, TSs-96, TSs-87, TSs-2, TSs-111, TSs-88, TSs-91, TSs-81, TSs-84, TSs-79, TSs-90, TSs-95 and TSs-82. SL, stem length; NL, number of leaves per plant; TLL, terminal leaf length (for the middle leaflet); TLB, terminal leaf breadth; NPB, number of primary branches; SG, stem girth at 10 cm above soil surface; ND/F, number of days to flowering; NFC/P, number of flower cluster per plant; NF/C, number of flower per cluster; NF/P, number of flower per plant; NDPF, number of days to pod formation; NFPD/P, number of filled pod per plant; PDL, pod length; PDW, pod width; NS/P, number of seed per pod; SL, seed length; ST, seed thickness; SD, seed diameter; 100-SW, 100 seed weight.
ISSR markers characterization and analysis
Molecular characterization and allelic polymorphism of the AYB accessions revealed existing microsatellite region variations. Analysis of the electrophoregram showed 95 loci comprising 1351 alleles were detected by 12 ISSR markers in the accessions. Out of the amplified loci, 62 (65.26%) were polymorphic (Table 3). The mean allelic amplification per marker was 112.58 with an average of 7.92 loci per marker. The allelic richness ranged from 9 to 15 alleles per locus with a mean of 12.28, which indicates the presence of allelic variation in a locus. The high polymorphism obtained in this study signifies the effectiveness of the markers in revealing the microsatellite region diversity in the accessions. The frequency and matrix of the loci amplification by individual and combined effects of the markers are shown in online Supplementary Fig. S3. The combined polymorphism information content (PIC) of the markers ranged from 0.667 to 0.852. Eleven markers, representing about 84.62% of the tested ISSR markers produced polymorphism above 60% (62.50–100%), while ISSR-1 and ISSR-11 had low polymorphism percentages of 40 and 25%, respectively. Despite the low polymorphism obtained with ISSR-1, it amplified a high number of loci (10). Other markers with a high frequency of loci amplification were; ISSR-7 (10), ISSR-8 (9), ISSR-10 (11) and ISSR-12 (9), the remaining seven markers detected a smaller number of loci per accession.
Table 3. Fragment amplification and percentage polymorphism information generated by inter simple sequence repeats (ISSR) markers used for the assessment of genetic diversity in African yam bean accessions

TNA, total number of allele; TNL, total number of amplified loci per marker; NML, number of monomorphic loci amplified; NPL, number of polymorphic loci amplified; %P, percentage polymorphism of the amplified loci.
The four markers with high allelic frequency were in the order ISSR-7 > ISSR-9 > ISSR-2 > ISSR8, each of the markers had an allelic frequency above 120 (Table 3). ISSR-11 which had the least loci amplification and allele frequency also had the lowest polymorphism. Generally, the null and minor allele frequency (MAF) exhibited by the ISSR markers was low (online Supplementary Fig. S3), which further show the effectiveness of the marker in the characterization and detection of genetic variations in the AYB accessions. However, the result revealed clear-cut differences between polymorphism and loci amplifications. For instance, ISSR-5 with low allelic frequency (80) showed 80% polymorphism while ISSR-1 marked by 103 alleles distributed across 10 loci recorded only 40% polymorphism.
The principal coordinate analysis (PCo1 versus PCo2) placed the accessions in four quadrants based on similarity in allelic amplification (online Supplementary Fig. S4). The result showed that four axes were important to the coordinate partitioning of the accessions. Meanwhile, axis 1 and 2 contributed most to the observed variation with a cumulative effect of 43.77%. At 95% reliability level, accessions with similar allelic amplification pattern were pooled together on a plane. The first quadrant had four accessions (TSs-111, TSs-90, TSs-84, TSs-1), of which TSs-90 and TSs-1 overlapped. Only two accessions (TSs-91 and TSs-96) were located in quadrant 2, four accessions were dispersedly located in quadrant 3, while six that were closely knitted were placed in quadrant 4. The placement of the accessions based on inter-simple sequence repeat gene reveals that accessions on the same quadrant are closely similar. The closer the accessions, the higher the similarity in their genetic composition.
Genetic diversity analysis
The dendrogram using the Ward linkage method as defined by morpho-agronomic traits revealed two main groups (A and B) at a genetic distance of 25 (Fig. 3(a)). At about 96 similarity index, group A split into two clusters (A1 and A2). Group A1 consists of four accessions while two accessions formed the A2 cluster. Similarly, group B further divided into two main clusters (B1 and B2) at a genetic distance of 5 (i.e. 95% similarity). Whereas B1 had just two members, eight accessions congregated in cluster B2 (online Supplementary Table S2). The partitioning and distribution of the accessions into groups/clusters based on morpho-agronomic characters was not as accurate as the dendrogram generated from microsatellite marker information, because the former could be influenced by the environments.

Fig. 3. The dendrogram using the UPGMA algorithm (Sokal and Michener, Reference Sokal and Michener1958) based (a) on morpho-agronomic traits, (b) microsatellite allelic polymorphism, and (c) phylogram of the combined morpho-agronomic traits and microsatellite region information of the African yam bean accessions.
The bootstrapped dendrogram constructed based on ISSR marker region amplifications grouped the accessions into two broad classes (Fig. 3(b)). Group 1 had two main divisions; 1A and 1B. The 1A consists of two closely related accessions (TSs-86 and TSs-82) while the 1B was further divided into two clusters (1Bi and 1Bii). Cluster 1Bi had only TSs-2, while 1Bii split into two sub-clusters at a genetic distance scale of 15. Accessions TSs-81 and TSs-1 were distant relatives while TSs-77 and TSs-95 were closely related. Group 2, on the other hand, separated into two sub-groups (2A and 2B) at a genetic distance above 60. The 2A sub-group had four accessions in the main cluster, two of the accessions (TSs-91 and TSs-90) had a higher genetic distance, but the other two (TSs-77 and TSs-95) are close relatives. The members of the 2B sub-group segregated into two clusters, a cluster consisting of TSs-115 and TSs-88, and the other one with a distant member (TSs-79) and two less diverse accessions (TSs-96 and TSs-87). Accessions with smaller genetic distance are closely related. Thus, TSs-77 and TSs-95 are close relatives in group 1. Likewise, TSs-111 and TSs-84, as well as TSs-96 and TSs-87, are the most related members in group 2.
The phylogram showed the total genetic length of the accessions was 454 (Fig. 3(c)) with the total genetic index of 0.865. Three basic groups were identified, a group of five accessions with TSs-115 and TSs-79 as the boundary members. The second group comprised of four members having TSs-84 as the root member and TSs-90 as the most evolving. Seven other accessions constituted the third group of which TSs-82 and TSs-86 with a genetic length of 24 occupy the peak of the phylogram. The highest genetic distance (28) occurred between the second and the third group. Meanwhile, the two accessions which are located at the peak of the phylogram also had the highest genetic length (24) among the accessions. Thus, based on the microsatellite region information, group 3 which occupied the top of the phylogram were the most recent in the evolution of the AYB accessions.
Discussion
The present study demonstrated there is genetic diversity in the AYB accessions from the IITA germplasm based on a combination of morphological and molecular markers. This is important for the improvement of the species as variability is the raw material on which selection acts upon. Although morphological parameters may to an extent be used to delimit and classify accessions (Adewale et al., Reference Adewale, Dumet, Vroh-Bi, Kehinde, Ojo, Adegbite and Franco2012; Ibirinde et al., Reference Ibirinde, Aremu, Balogun and Oladokun2019), they have limitations of subjections to environmental influence (Chen et al., Reference Chen, Pang, Song, Shi, Yao, Han and Leon2014). Nevertheless, it could provide basic information for preliminary screening of the accessions for improvement and enhanced utilization. Significant morphological dissimilarities in growth parameters, as well as the variation in flower and seed-related characters, are a preliminary indication of genetic diversity among the accessions. Reports abound (Upadhyay et al., Reference Upadhyay, Singh and Neeraja2011; Animasaun et al., Reference Animasaun, Morakinyo, Krishnamurthy and Mustapha2017; Azeez et al., Reference Azeez, Olowookere, Animasaun and Bello2017) on the use of morphological markers to assess genetic divergence in plant population and genotypes and the current results concurred with the earlier studies.
Based on the result of the analysis of the morphology characters, some accessions can be further screened for improved tolerance to harsh environmental conditions. Variations in vegetative growth parameters may be linked to light availability and could be functionally significant. For instance, TSs-86 and TSs-115 which had the thickest stems could be capable of storing more water for metabolic use when there is a water deficit. The higher number of leaves could enhance photosynthetic capacity and therefore increased both biological and agronomic yield. It is possible to improve the yield by selecting better growth performance which could translate to the production of a higher number of pods. Also, plant height may influence the ability of the plant to intercept sunlight which in turn determines the rate of assimilate partitioning in the plant (Boadi et al., Reference Boadi, Baah-Acheamfour, Ulzen-Appiah and Jamro2014). On the basis of robust vegetative traits, TSs-115, TSs-86, TSs-77 and TSs-96 that exhibited desirable characteristics such as a higher number of leaves, higher number of branches, stem length, leaf length may be the accessions of interest to develop improved varieties of AYB. Potter stated that the leaf dimension is primarily controlled by genetic factor and not environmentally and therefore, could be utilized in a breeding programme. However, it was argued that both the genetic system and the environment in an interaction could produce significant effects on the agronomic traits of crop plants (Nwofia et al., Reference Nwofia, Awaraka and Mbah2014).
The variations observed in the flower and seed-related traits of the accessions suggest a remarkable level of diversity. Maturity time is an essential and desirable trait in crop improvement. In the current wave of climate change, there is a necessity for the development and use of early maturing varieties, and in this wise, accessions TSs-2, TSs-91 and TSs-111 could be promising. Accurate profiling and knowledge of existing genetic diversity in a crop plant are essential for the development of novel varieties for broadening input and ensuring resilience seed production to combat food deficit and climatic changes. Therefore, to increase the role of agriculture in ensuring food safety and improve the economy of the rural farmers, identification, maintenance and sustainable utilization of genetic resources must be taken into consideration (Upadhyay et al., Reference Upadhyay, Singh and Neeraja2011). The result of the boxplot analysis showed that most accessions flowered around the average number of days to flowering. This implies that most of the accessions are elite in term of maturity time. The maturity time of the studied accessions confirmed the range (100–150 d) documented by Kul et al. (Reference Kul, Amoatey, Bansa and Kumaga2001) and less than the range reported by Akinyosoye et al. (Reference Akinyosoye, Adetumbi, Amusa, Agbeleye, Anjorin, Olowolafe and Omodele2017).
In an obvious term, one of the cardinal objectives of crop improvement is yield, and in the case of AYB, seed and tuber yield are the focus. The high number of filled pods per plant and long pods found in TSs-9, and the high number of seed per pod in TSs-79 indicated that the two accessions are potential candidates to be considered for pod and seed yield. The pod and seed yield parameters of the accessions evaluated by Akinyosoye et al. (Reference Akinyosoye, Adetumbi, Amusa, Agbeleye, Anjorin, Olowolafe and Omodele2017) are similar to the current result. Yield components are controlled by both environmental and the genetic system of the plant but can be well improved through circles of a breeding programme. The fact that TSs-88, a late-maturing accession with a smaller number of seeds per pod, produced the heaviest seeds suggests a complex genetic control of seed-related characters in the crop. This was further evident in the various seed coat colours of the accessions, pointing to a strong genetic influence on the evaluated traits, rather than environmental influence. Adewale (Reference Adewale2011) had previously reported variability in seed coat colour among 80 accessions of AYB. The heterosis and varietal differences observed in the accessions could be harnessed as raw materials for the development of new varieties.
The strong correlation existing between some morphological traits at P < 0.05 and P < 0.01 showed they are likely linked and governed by a genetic system. This is essential in plant breeding because traits that had a strong positive association as obtained from the correlation matrix can be simultaneously improved. For instance, the result revealed that seed dimension and weight were positively connected, and they could be easily improved together in the segregating progenies (Bello and Olawuyi, Reference Bello and Olawuyi2015). The correlation pattern obtained in this study aligned with those reported for some accessions by Akinyosoye et al. (Reference Akinyosoye, Adetumbi, Amusa, Agbeleye, Anjorin, Olowolafe and Omodele2017). The significant but negative association between stem length, number of seeds per pod and pod dimension is of importance as it revealed that pod size is independent of the vine length. Similarly, days to flowering does not determine the number of flowers per plant and the number of days to pod formation. The non-linkage of these characters will allow their independent improvement. To this end, the application of molecular hybridization techniques may be applicable. Significant positive character linkage and correlations have been established in crop plants (Azeez et al., Reference Azeez, Olowookere, Animasaun and Bello2017; Olorunmaiye et al., Reference Olorunmaiye, Joseph, Animasaun and Oyedeji2019). Besides, a negative or poor association between phenotypical traits has been reported (Micco et al., Reference Micco, Arena, Pignalosa and Durante2011; Malek et al., Reference Malek, Rafii, Afroz, Sharmin, Nath and Mondal2014).
The principal component biplot analysis in corroboration of the linkage matrix revealed various factors contributed to the observed variation. Among the growth parameters, the number of leaves per plant, leaf length and breadth are the most important. Of course, this is evident in the role of the leaf in photosynthesis, the more the assimilative area, the higher the photosynthate and the better the growth. Furthermore, contributions of reproductive traits such as days to flowering, flower clusters per plant, filled pods per plant, number of seeds per pod and seed weight are also important. The differential interactions between these traits accounted for the existing variability of the accessions. In the opinion of Ikhajiagbe et al. (Reference Ikhajiagbe, Mgbeze, Folu and Dania2007), from such traits, selections could be made for improvement. The current findings are in tandem with Akinyosoye et al. (Reference Akinyosoye, Adetumbi, Amusa, Agbeleye, Anjorin, Olowolafe and Omodele2017), who alluded that flower and seed-related traits contributed most to the observed variations in AYB accessions.
The knowledge of existing genetic diversity is essential for the development of novel varieties to broaden the crop input source and ensure resilient seed production to combat food deficit and climate change. To achieve a rapid and accurate estimation of genetic diversity of AYB accessions, a DNA-base fingerprinting is required (Varshney et al., Reference Varshney, Chabane, Hendre, Aggarwal and Graner2007). The ability of the ISSR markers to amplify a high number of loci with negligible MAF with high percentage polymorphism shows the markers are effective. Besides, the combined PIC >0.6 attested to the utility and reliability of the ISSR markers. More so, the loci and allelic polymorphic indices clearly showed existing variation in the genetic composition of the AYB accessions. Thus, the molecular markers amplified in a more specific direction, reflecting the diversity of the accessions through heterologous amplification of the alleles within the microsatellite region of the DNA.
There are reports of genetic diversity assessment in crop plants using ISSR markers (Ajibade et al., Reference Ajibade, Weeden and Michite2000; Animasaun et al., Reference Animasaun, Morakinyo, Mustapha and Krishnamurthy2015; Olatunji and Afolayan, Reference Olatunji and Afolayan2019) which demonstrated the effectiveness of microsatellite markers in genotyping crop accessions. It is noteworthy to mention that, DNA-base markers used for genetic diversity analysis may differ in actions and capacity to reveal the genetic variation in a population (Tadesse, Reference Tadesse2017). For instance, Moyib et al. (Reference Moyib, Gbadegesin, Aina and Odunola2008) used the RAPD marker while Adewale et al. (Reference Adewale, Vroh-Bi, Dumet, Nnadi, Kehinde, Ojo, Adegbite and Franco2015) and Ojuederie et al. (Reference Ojuederie, Morufat, Iyiola, David and Mercy2014) both used AFLP markers to determine the genetic diversity of some AYB accessions, and they reported genetic diversity in the genotypes they studied. Meanwhile, Shitta et al. (Reference Shitta, Abberton, Adesoye, Adewale and Oyatomi2016) attempted cross-amplification of cowpea SSR markers on AYB genotypes and reported considerable diversity. The present work corroborated the earlier findings; however, the loci and allele frequency, and the percentage polymorphism (expected heterozygosity) obtained with ISSR markers in this study are higher than those reported for RAPD and AFLP markers.
Since markers profiles are often deduced from the allele phenotypes, a high allele polymorphism is essential for accurate estimation of genetic diversity (Pfeiffer et al., Reference Pfeiffer, Roschanski, Pannell Korbecka and Schnitter2011). The polymorphism percentage obtained from each ISSR and the overall percentage polymorphism above 60% confirmed the suitability and effectiveness of the markers in the diversity study of the AYB accessions. Furthermore, the PCoA based on the amplified microsatellite loci and alleles placed the accessions in spatial coordinates. The accessions on the same quadrant are relatives, but those that overlapped within a spatial quadrant are more similar and genetically related. The highest coordinate link between TSs-11 and TSs-82 implies they are the most distant accessions. Placing of heterogeneous accessions from different locations and origin on the same plane was documented by Tyagi et al. (Reference Tyagi, Sharma, Surya, Kerkhi and Chand2014), who also inferred that accessions or genotypes on the same plane are related regardless of their origin.
The dendrogram based on morphological data separated the accessions into two broad groups at 75% similarity with considerable diversity. The division of the groups into clusters at a genetic distance less than 10 indicated a closer relationship exists among members. The degree of the relationship depends on the genetic distance between the accessions. However, the dendrogram constructed from the molecular data revealed a better distribution of the accessions into genetic units. The small genetic distance between TSs-77 and TSs-95 showed they are the most related. Other accessions with high genetic affinities formed a sub-cluster for each of the four main clusters.
Clustering of closely related AYB accessions has been reported (Adewale et al., Reference Adewale, Vroh-Bi, Dumet, Nnadi, Kehinde, Ojo, Adegbite and Franco2015). Usually, accessions or genotypes that are genetically related will always cluster together irrespective of their origin and agro-ecological zones. This is of great significance in genetic resources management and crop improvement, as it provides basal information on similarity and diversity between and within germplasm (Animasaun et al., Reference Animasaun, Morakinyo, Mustapha and Krishnamurthy2015). Besides, the genetic diversity information is a prerequisite for the development of novel cultivar with new alleles mix through the selection of distinct accessions for hybridization (Upadhyay et al., Reference Upadhyay, Singh and Neeraja2011).
The phylogram total genetic index of 0.865 and tree length of 454 signified a remarkable evolutionary relationship among the AYB accessions. The occurrence of TSs-115 as the basal accession suggests it is a member of the ancestral variety with the most conserved microsatellite region, which could confer stability and adaptation. Although AYB remains largely un-improved, there is the possibility of recombinant genotypes. The cluster members; TSs-115, TSs-79, TSs-88, TSs-96 and TSs-87 are at the lowest level of evolution among the studied accessions. Accessions TSs-82 and TSs-86 with a tree length of 24, which occupy the peak of the phylogram, are likely the most recent.
Conclusion
With the growing global population and food insecurity, especially in the third world countries, it is imperative to improve and conserve indigenous underutilized crops with the potential of alleviating food shortage, nutrient deficit and poverty. To achieve this, information on genetic diversity of such crops is necessary. The current study demonstrated the existence of genetic diversity and relationship in AYB accessions, using a combination of phenotypic and molecular (ISSR) markers. The diversity reported in this study could be harnessed for the development of new varieties with desirable traits, and also to enhance the conservation and sustainable utilization of the crop.
Supplementary material
The supplementary material for this article can be found at https://doi.org/10.1017/S1479262121000253
Acknowledgements
The authors are thankful to the Genetic Resources Centre, International Institute of Tropical Agriculture (IITA), Ibadan, Nigeria for providing the African yam bean accessions.
Conflict of interest
None.
Financial support
None.