INTRODUCTION
Determining the nature and pace of changes in the environment of human populations in the late Pleistocene–Holocene may lead to greater understanding of the factors that influenced technological, behavioral, and cognitive innovation. Different modes of climate variability may have resulted in a variety of environmental stresses on early human populations (Hildebrand and Grillo, Reference Hildebrand and Grillo2012; Vogelsang and Keding, Reference Vogelsang and Keding2013; Foerster et al., Reference Foerster, Vogelsang, Junginger, Asrat, Lamb, Schaebitz and Trauth2015, Reference Foerster, Vogelsang, Junginger, Asrat, Lamb, Schaebitz and Trauth2016). The timing and synchronicity of the hydroclimatic oscillations that have significantly modulated the environment across eastern Africa possibly had important implications for human adaptation and survival (Ambrose et al., Reference Ambrose1998; Hildebrand et al., Reference Hildebrand, Brandt and Lesur-Gebremariam2010; Foerster et al., Reference Foerster, Vogelsang, Junginger, Asrat, Lamb, Schaebitz and Trauth2015) and for human dispersal, both within Africa and beyond (Carto et al., Reference Carto, Weaver, Hetherington, Lam and Wiebe2009; Castañeda et al., Reference Castañeda, Mulitza, Schefuß, Santos, Damste and Schouten2009; Chase et al., Reference Chase, Faith, Mackay, Chevalier, Carr, Boom, Lim and Reimer2018; Lamb et al., Reference Lamb, Bates, Bryant, Davies, Huws, Marshall and Roberts2018).
Testing hypotheses concerning the relationship between climate and human cultural change is complicated by the complex interplays between climate, environment, and human behavior, and relies largely on archaeological datasets and modelling. Reconstruction of past climate on which we have focused can be compromised by uncertainties in the interpretation of climate proxies, the dating of climate archives, and the validation of modelling results. For example, while consensus prevails on the causes and nature of the African Humid Period (AHP, ~14,800–5500 yr; deMenocal et al., Reference deMenocal, Ortiz, Guilderson, Adkins, Sarnthein, Baker and Yarusinsky2000), the precise timing of this interval and the relative abruptness of its onset and termination in different regions remain a matter of debate (e.g., Brovkin and Claussen, Reference Brovkin and Claussen2008; Kröpelin et al., Reference Kröpelin, Verschuren and Lézine2008a, Reference Kröpelin, Verschuren, Lézine, Eggermont, Cocquyt, Francus and Cazet2008b; Junginger and Trauth, Reference Junginger and Trauth2013; Tierney and deMenocal, Reference Tierney and deMenocal2013; Shanahan et al., Reference Shanahan, McKay, Hughen, Overpeck, Otto-Bliesner, Heil, King, Scholz and Peck2015; Tierney et al., 2017). Furthermore, evaluating the response of the tropical and subtropical African climate to North Atlantic cold events such as the Heinrich Events and the Younger Dryas (YD) stadial has proved controversial (e.g., Brown et al., Reference Brown, Johnson, Scholz, Cohen and King2007; Lamb et al., Reference Lamb, Bates, Coombes, Marshall, Umer, Davies and Dejen2007; Garcin, Reference Garcin2008; Tierney and deMenocal, Reference Tierney and deMenocal2013). It is generally accepted that the YD had a drying effect on the African climate but there are differing interpretations of its timing (Roberts et al., Reference Roberts, Taieb, Barker, Damnati, Icole and Williamson1993; Garcin et al., 2007; Tierney and deMenocal, Reference Tierney and deMenocal2013; Berke et al., 2014). The impacts of the Dansgaard-Oeschger (D-O) cycles and the Heinrich events of the northern hemisphere high latitudes on East African moisture availability are also subject to debate (e.g., Brown et al., Reference Brown, Johnson, Scholz, Cohen and King2007; Lamb et al., Reference Lamb, Bates, Coombes, Marshall, Umer, Davies and Dejen2007; Garcin, Reference Garcin2008; Tierney and deMenocal, Reference Tierney and deMenocal2013, Berke et al., 2014).
In this paper, we present the results of a change point analysis on high-resolution environmental records from Chew Bahir, southern Ethiopia, to determine the timing and rate of change of climatic transitions during the last ~45 ka. We then discuss the possible impact of such transitions on human cultural evolution. The Chew Bahir is a 30×70 km saline mudflat within a tectonically bounded basin, located in a transition zone between the Main Ethiopian Rift and the Omo-Turkana basin (Fig. 1). The southwestern Ethiopian Highlands, which are within the 32,400 km2 Chew Bahir catchment, may have been a refugium for groups of H. sapiens during times of climatic stress (Ambrose et al., Reference Ambrose1998; Brandt and Hildebrand, Reference Brandt and Hildebrand2005), as well as a possible hotspot of cultural innovation (Brandt et al., Reference Brandt, Fisher, Hildebrand, Vogelsang, Ambrose, Lesur and Wang2012). The several-km thick deposits of the Chew Bahir basin therefore present a promising archive of past environmental changes, containing clues to their possible influence on human population dynamics, distribution, and cultural innovation (Campisano et al., Reference Campisano, Cohen, Arrowsmith, Asrat, Behrensmeyer, Brown and Deino2017).
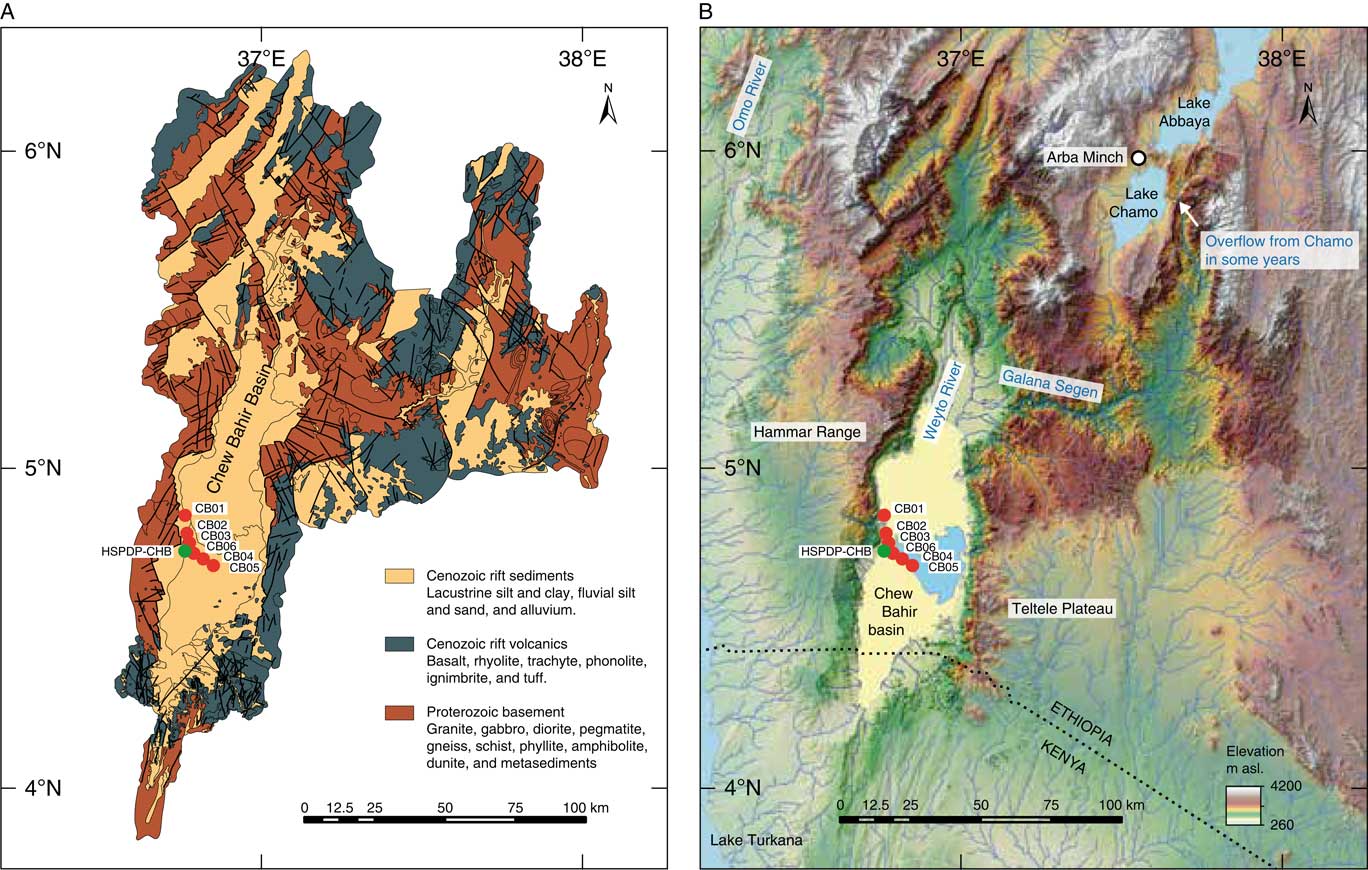
Figure 1 (color online) (A) Geologic map of the Chew Bahir basin, showing the three generalized rock types: Cenozoic rift sediments, Cenozoic rift volcanics, and Proterozoic basement. Compilation based on Omo River Project Map (Davidson, Reference Davidson1983), Geology of the Sabarei Area (Key, 1987), Geology of the Yabello Area (Hailemeskel and Fekadu, Reference Hailemeskel and Fekadu2004), and Geology of the Agere Maryam Area (Hassen et al., Reference Hassen, Yemane and Genzebu1997). (B) Topographic map of the Chew Bahir basin, showing the outline of the catchment, the drainage network, the location of the short cores in the 2009–10 pilot study and the 2014 HSPDP-CHB drill site.
Our environmental record is based on a comprehensive multi-proxy analysis of six sediment cores up to 18.8 m long, taken along an approximately 20-km-long northwest-southeast transect across the western half of the basin (Fig. 1). Three of these cores (CB01, CB03, and CB05), collected in a pilot study for the Hominin Sites and Paleolakes Drilling Project (HSPDP; HSPDP-CHB deep coring site in Fig.1; Cohen et al., Reference Cohen, Campisano, Arrowsmith, Asrat, Behrensmeyer, Deino and Feibel2016; Campisano et al., Reference Campisano, Cohen, Arrowsmith, Asrat, Behrensmeyer, Brown and Deino2017) and the Collaborative Research Center CRC-806 (http://www.sfb806.uni-koeln.de), have been described in previous publications (Foerster et al., Reference Foerster, Junginger, Langkamp, Gebru, Asrat, Umer and Lamb2012, Reference Foerster, Vogelsang, Junginger, Asrat, Lamb, Schaebitz and Trauth2015; Trauth et al., Reference Trauth, Bergner, Foerster, Junginger, Maslin and Schaebitz2015). By incorporating new data from cores CB02, CB04, and CB06, we can make a definitive contribution to discussion of the timing of the onset and termination of the AHP, the YD, and earlier dry-wet-dry cycles, as well as the rates of change involved. As in our previous publications, we use potassium (K) concentrations (normalized counts of x-ray fluorescence [XRF] scans) as a proxy for aridity in the Chew Bahir record (Foerster et al., Reference Foerster, Junginger, Langkamp, Gebru, Asrat, Umer and Lamb2012, Reference Foerster, Vogelsang, Junginger, Asrat, Lamb, Schaebitz and Trauth2015; Trauth et al., Reference Trauth, Bergner, Foerster, Junginger, Maslin and Schaebitz2015). The K record spans the last 45,280 yr, including the last two orbitally driven dry-wet-dry climate alternations in northeast Africa. We used a dynamic time warping algorithm to compare and correlate proxy time series from the six sediment cores, and a principal component analysis to separate regional from local influences in the records. Since this continuous high-resolution record from the 32,400 km2 large Chew Bahir catchment can be considered to be representative of the whole of the southern Ethiopian Plateau region, it is a promising dataset against which to test hypotheses concerning human responses to climatic changes in northeast Africa over the last ~45 ka.
REGIONAL SETTING
Chew Bahir (4.1–6.3°N, 36.5–38.1°E; WGS 84; Fig. 1) is a tectonic basin, separated from the Omo basin to the west by the Hammar Range. Being a closed basin, it forms a terminal sink for weathering products from its 32,400 km2 catchment. The perennial Weyto and Segen rivers drain from the north/northwest and northeast, respectively, to feed the playa lake. Large alluvial fans extend onto the Chew Bahir mudflats from the flanks of the basin and are activated during arid intervals, when the vegetation cover is sparse (Foerster et al., Reference Foerster, Junginger, Langkamp, Gebru, Asrat, Umer and Lamb2012). The Hammar Range to the west and the highlands to the north and northeast consist of Late Proterozoic granitic and mafic gneisses with minor occurrences of meta-sedimentary rocks, whereas the eastern part of the catchment is dominated by Miocene basaltic lava flows with subordinate rhyolite-trachyte and felsic tuff intercalations. Oligocene basalt flows with subordinate rhyolites, trachytes, tuffs, and ignimbrites cover the Precambrian basement units in the distal northeastern, northern, and northwestern parts of the catchment (Fig. 1; Moore and Davidson, Reference Moore and Davidson1978; Davidson, Reference Davidson1983).
The present-day climate in east and northeast Africa is influenced by a number of major air streams and convergence zones, with their effects superimposed on regional influences associated with topography, large lakes, and the oceans (Nicholson, Reference Nicholson2017). According to the classic explanation of the seasonal cycle, rainfall in the Chew Bahir catchment is associated with the passage of the ITCZ, resulting in a strongly bimodal annual cycle. The two resulting rainy seasons follow the latitudinal position of the overhead sun with a time lag of about 46 weeks; the “long rains” occur between March and May and the “short rains” between October and November. Short-term (annual to decadal) fluctuations in the intensity of precipitation relate to E-W adjustments in the zonal Walker circulation associated with the El Niño-Southern Oscillation (ENSO) and the Indian Ocean Dipole (IOD), possibly as a direct response to sea-surface temperature (SST) variations in the Indian and Atlantic Oceans, which are in turn affected by the ENSO and the IOD. Changes in the relative strength of these Pacific and Indian Ocean anomalies may also explain the continuous decline of the intensity of the long rains in recent decades (Nicholson, Reference Nicholson2017).
MATERIALS AND METHODS
The late Pleistocene–Holocene hydroclimatic oscillations in the Chew Bahir basin have been reconstructed from the six sediment cores (CB01–CB06) collected along a ~20-km-long northwest-southeast transect across part of the basin (Table 1, Fig. 1 and 2; Foerster et al., Reference Foerster, Junginger, Langkamp, Gebru, Asrat, Umer and Lamb2012, Reference Foerster, Vogelsang, Junginger, Asrat, Lamb, Schaebitz and Trauth2015). Cores CB01 and CB02 were retrieved from the distal margins of an alluvial fan on the western edge of the basin, an area that is predominantly influenced by the fans from the Hammar Range and the Weyto River, while cores CB04–CB06 were collected from towards the center of the basin, in an area predominantly controlled by fluviolacustrine processes and the Segen River. The sediments in the CB03 core, from an intermediate location along the transect, were of mixed alluvial, lacustrine, and fluvial origins with the latter relating to the Weyto and Segen rivers.

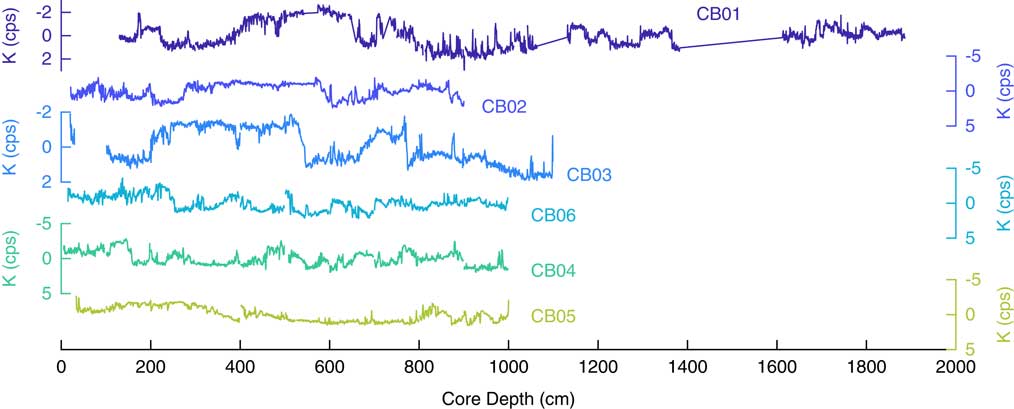
Figure 2 (color online) Variation in the potassium (K) concentration of the CB01–CB06 cores (in normalized counts per second, cps) plotted against the core depth (in cm). For comparison with CB01, which was measured using a molybdenum tube, all records were normalized (mean=0, standard deviation=1). Please note reverse scale of K axis.
Table 1 Cored locations within the Chew Bahir basin (longitudes and latitudes), core lengths, total depth of cored material below the lake floor, date of core collection, and core recovery.

The climate proxy record from the Chew Bahir basin discussed herein is based on the abundance of K in the sediment, as determined by micro X-ray fluorescence (μXRF) scanning; K has been shown to be a reliable proxy for aridity in the Chew Bahir cores (Foerster et al., Reference Foerster, Junginger, Langkamp, Gebru, Asrat, Umer and Lamb2012; Trauth et al., Reference Trauth, Bergner, Foerster, Junginger, Maslin and Schaebitz2015). We used dynamic time warping (DTW) to align the K records from cores CB02–CB06 with the K record from core CB01 (Fig. 2 and 3). Dynamic time warping, included in MATLAB as the dtw function (Mathworks, 2017a), stretches two time series onto a common set of points in time such that the sum of the Euclidean distances between corresponding points is as small as possible (Sakoe and Chiba, Reference Sakoe and Chiba1978; Paliwal et al., Reference Paliwal, Agarwal and Sinha1982). The core depths of the aligned cores CB01–CB06 were converted into ages using the age model of Trauth et al. (Reference Trauth, Bergner, Foerster, Junginger, Maslin and Schaebitz2015) which is based on 32 AMS 14C ages (Foerster et al., Reference Foerster, Junginger, Langkamp, Gebru, Asrat, Umer and Lamb2012, 2014). All radiocarbon ages were converted into calibrated ages with OxCAL using the IntCal13 calibration curves (Fig. 3; Bronk Ramsey, Reference Bronk Ramsey1995, Reference Bronk Ramsey2009a, Reference Bronk Ramsey2009b; Reimer et al., Reference Reimer, Bard, Bayliss, Beck, Blackwell, Bronk Ramsey and Buck2013).

Figure 3 (color online) Variation in the potassium (K) content (in normalized counts per second, cps) of the Chew Bahir plotted against age (in cal ka BP). We used dynamic time warping (DTW) to automatically align the K records from cores CB02–CB06 with that from core CB01. The core depths of the aligned cores were converted into ages using the age model of Trauth et al. (Reference Trauth, Bergner, Foerster, Junginger, Maslin and Schaebitz2015). Please note reverse scale of K axis. We have offset the individual time series by 2 normalized cps in each case to allow an overlap-free display of the K records.
We used a principal component analysis (PCA), included in the MATLAB function pca (Mathworks, 2017b), to separate the mixed regional and local environmental signals in cores CB01–CB06 (Fig. 4; Pearson, Reference Pearson1901; Hotelling, Reference Hotelling1931). More than 94% of the total variance of the data set is contained in the first principal component (PC1), which we interpret to represent the regional climate signal. Complete unmixing of the regional and site-specific signal components (including noise), however, was not possible since the K values from cores CB01–CB06 are not perfectly Gaussian distributed (Fig. 4). The climate proxy record in CB01 has a mean temporal resolution of approximately 16 yr, ranging from ~4 yr up to almost 2000 yr between about 41 and 42 ka. The K record after DTW alignment and PCA-based unmixing was interpolated to an evenly spaced time axis running from 0 to 45,350 cal yr BP at 15-year intervals, which is close to the mean interval in the original data (~16 yr).

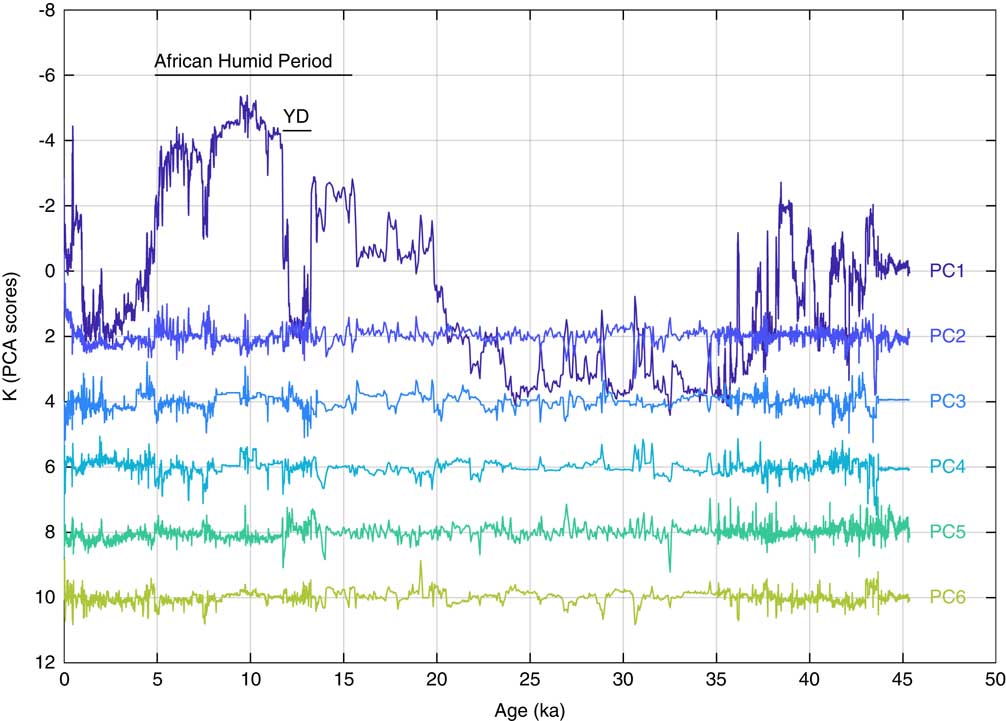
Figure 4 (color online) Results of a principal component analysis to unmix (or separate) the regional environmental signal from the local signal in cores CB01–CB06. More than 94% of the total variance of the data set is contained in the first principal component (PC1), which we interpret to represent the regional climate signal. We have offset the individual time series by 2 normalized cps in each case to allow an overlap-free display of the potassium (K) records.
In order to test the synchronicity of the AHP across tropical and subtropical Africa and the relative abruptness of its onset and termination, we applied a change point search algorithm from Killick et al. (Reference Killick, Fearnhead and Eckley2012) to the normalized K record, i.e., the mean K values were subtracted from the individual K values and then divided by the standard deviation. The algorithm, which has recently been included in MATLAB as the findchangepts function (MathWorks, 2017a), detects change points by minimizing a cost function over all possible numbers and locations of change points. The findchangepts function yields the number of significant changes in the mean, the standard deviation, and the trend of a time series (not exceeding a maximum number of permissible changes defined by the user) that minimize the sum of the residual error and an internal fixed penalty for each change.
In order to test the Chew Bahir record for any influence from the pre-AHP centennial to millennial climate oscillations of D-O cycles and Heinrich events, we calculated the correlation coefficient between the K record and the NorthGRIP (also known as NGRIP) δ18O ice core record (North Greenland Ice Core Project members, 2004). We then also calculated the correlation coefficient within a sliding window of a given length covering the two records. We used Pearson’s linear product-moment correlation coefficient and, since this coefficient is very sensitive to disturbances, we also used the Spearman and Kendall correlation coefficients, all implemented in the MATLAB function corr (MathWorks, 2017b).
RESULTS
The μXRF scans provided data on the elemental content of six cores CB01–CB06 for 26 to 47 elements, depending on the setting of the core scanner (Fig. 2–4). Of all the elements analyzed, we made statistical analyses of only the K records, as these have been shown to reflect past climate variability on millennial to centennial time scales (Fig. 2–4; Foerster et al., Reference Foerster, Junginger, Langkamp, Gebru, Asrat, Umer and Lamb2012, Reference Foerster, Vogelsang, Junginger, Asrat, Lamb, Schaebitz and Trauth2015; Trauth et al., Reference Trauth, Bergner, Foerster, Junginger, Maslin and Schaebitz2015). After DTW alignment and PCA-based unmixing, the application of the change point search algorithm to the data means yielded about 15 significant transitions during the last ~45 ka (Fig. 5a). Increasing the maximum number of changes permitted in findchangepts yielded additional transitions bounding narrow minima (i.e., short, wet episodes, based on interpretation of the K record) to the series of change points. Reducing the maximum number of changes to 10, however, resulted in the gradual increase in K concentrations at the end of the AHP being defined by just a single change point (at 4860 cal yr BP). Adjusting the maximum number of change points to an intermediate value placed the termination of the AHP between ~4875 to 3885 cal yr BP, as suggested by two significant change points, one at the beginning of this climate transition and one at the end. The transition from wet to dry at the end of the AHP therefore appears to have lasted ~990 yr in the Chew Bahir basin.

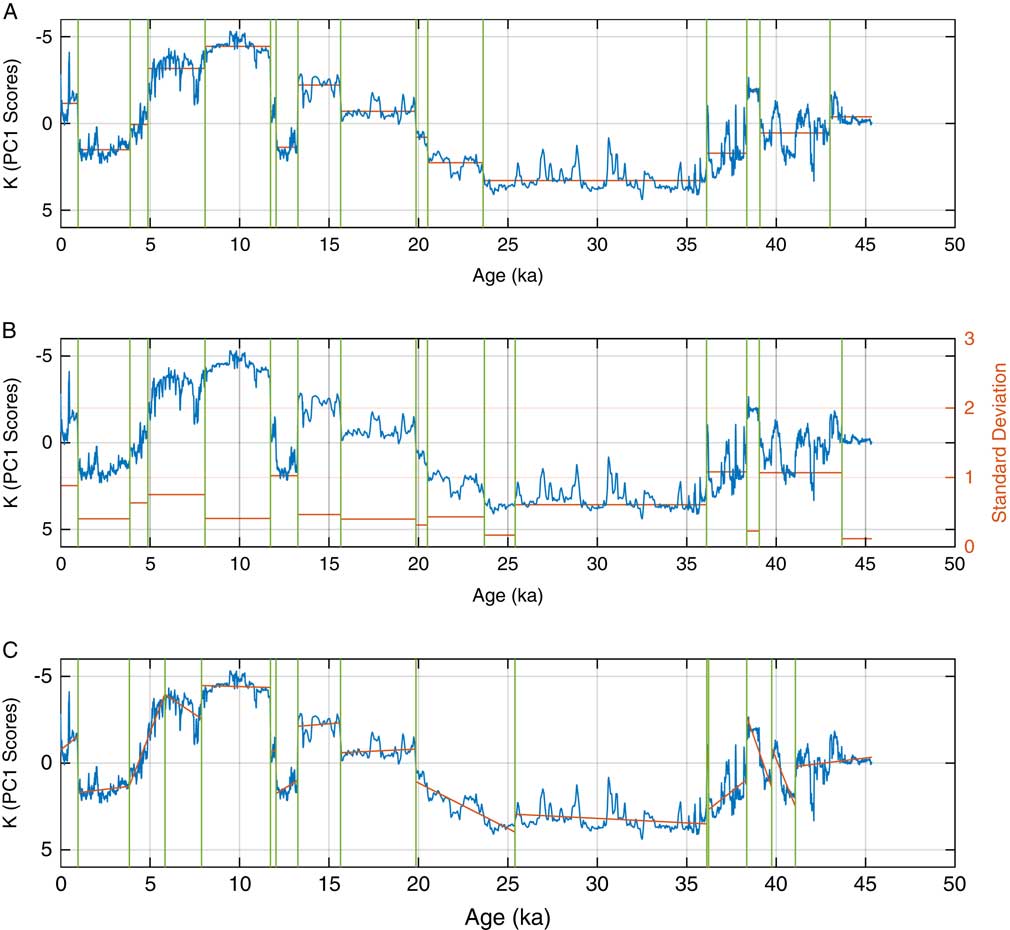
Figure 5 (color online) Results of change point analyses on the K record after DTW alignment and PCA-based unmixing: (A) change points in the mean; (B) change points in the standard deviation; (C) change points in the trend. The change point algorithm yields about 15 significant transitions in the mean, standard deviation and trend, the most marked of which occur at the onset of, and during, the termination of the African Humid Period (AHP), interrupted by the Younger Dryas (YD) dry episode. Note reversed scale of potassium (K) axis.
A second set of important transitions is the one defining the episode of higher K concentrations that coincides with the YD stade. According to our analysis, the onset of this ~1500-yr-long dry episode in the Chew Bahir basin was at 13,260 cal yr BP and it lasted until 11,730 cal yr BP. Prior to the YD there was a transition from dry to wet evident in the CB01–CB04 and CB06 cores, but not in the central core (CB05). This very abrupt transition is dated at 15,640 cal yr BP, most likely marking the onset of the AHP in the Chew Bahir basin. Earlier transitions from an even drier to a wetter climate (as indicated by changes from high to low K concentrations) occur at 19,860 and 20,520 cal yr BP. In the older parts (i.e., prior to ~20 ka) of the cores, there are numerous rapid shifts from dry (high K) to wet (low K) and back within less than 1000 yr; the pattern of these rapid transitions resembles the D-O cycles of high latitudes, as discussed below.
Many of these transitions in the mean K concentration are also associated with changes in the variability of K concentrations, as indicated by the change point search in the standard deviation (Fig. 5b). For instance, the change point algorithm finds a stepwise decrease in variability at 4875 cal yr BP, and again at 3870 cal yr BP, most likely caused by an episode of relative instability that is characterized by a relative wet climate between ~7150 and ~5000 cal yr BP interrupted by at least fourteen distinct dry events, each lasting between ~20 and 80 (Fig. 2–4); this episode is followed by a relatively dry and stable climate after ~5000 cal yr BP (fig. 3a in Trauth et al., Reference Trauth, Bergner, Foerster, Junginger, Maslin and Schaebitz2015). The YD dry period is also bounded by two transitions in the standard deviation (from wet to dry and then back again), at 13,260 and 11,730 cal yr BP, which are the same dates as the transitions in the mean. The onset of the AHP, as defined by a change in the mean K concentration at 15,640 cal yr BP, is also associated with a change point in the standard deviation at about the same date. Similarly, the older, stepwise, dry-wet transitions in the mean K concentration are associated with changes in the standard deviation at more or less the same times.
The change point search algorithm also allows us to analyze changes in the trend of the K concentration (Fig. 5c). It is interesting to note that the termination of the AHP took much longer if one considers the trend, extending from 5835 to 3840 yr and therefore including a longer period of the episode of instability detected from the mean K concentrations, which lasted from ~7.15 to 3.8 cal ka BP. The trend analysis suggests that the wet-dry-wet episode corresponding to the YD started at 13,260 cal yr BP and ended at 11,730 cal yr BP, which is very close to the dates obtained from analysis of the mean K concentrations. According to the change point in the trend, the onset of the AHP was at 15,640 cal yr BP, which is exactly the same as the date obtained from the mean and standard deviation analyses. The search for change points in the trend of the older part of the K record reveals numerous sawtooth-type intervals, terminated by significant change points, with the earlier ones defining short periods with lower K concentrations (i.e. wetter conditions).
Correlating the entire K record from CB01 with the δ18O record from the NorthGRIP ice core (North Greenland Ice Core Project members, 2004) yields a Pearson correlation coefficient of -0.61, which is similar to the Spearman correlation coefficient (-0.60) but differs from the Kendall correlation coefficient (-0.42), i.e., high negative δ18O values correlate with high positive K values (Fig. 6). These results suggest a weak but consistently negative correlation, i.e., cold climates in the high northern latitudes correlate with (but do not necessarily cause) dry climates in the Chew Bahir basin. Piecewise cross correlation using the Spearman coefficient with a window size of 100 data points (corresponding to 100×15 yr=1500 yr) reveals that this negative correlation is not stationary. In fact, periods of negative and positive correlation alternate with each other, interrupted at times by periods with no correlation. It is interesting to note that episodes with a correlation below -0.5 occur prior to ~25 ka, briefly at about 20 ka, and between 15 and 10 ka, i.e., at the same times as D-O cycles and the YD stadial in Greenland, whereas the correlation is mostly positive or absent (values of 0–0.5) during relatively wet climatic episodes. Qualitatively similar results were obtained from correlation analyses using Pearson’s and Kendall’s correlation coefficients instead of the Spearman’s coefficient.

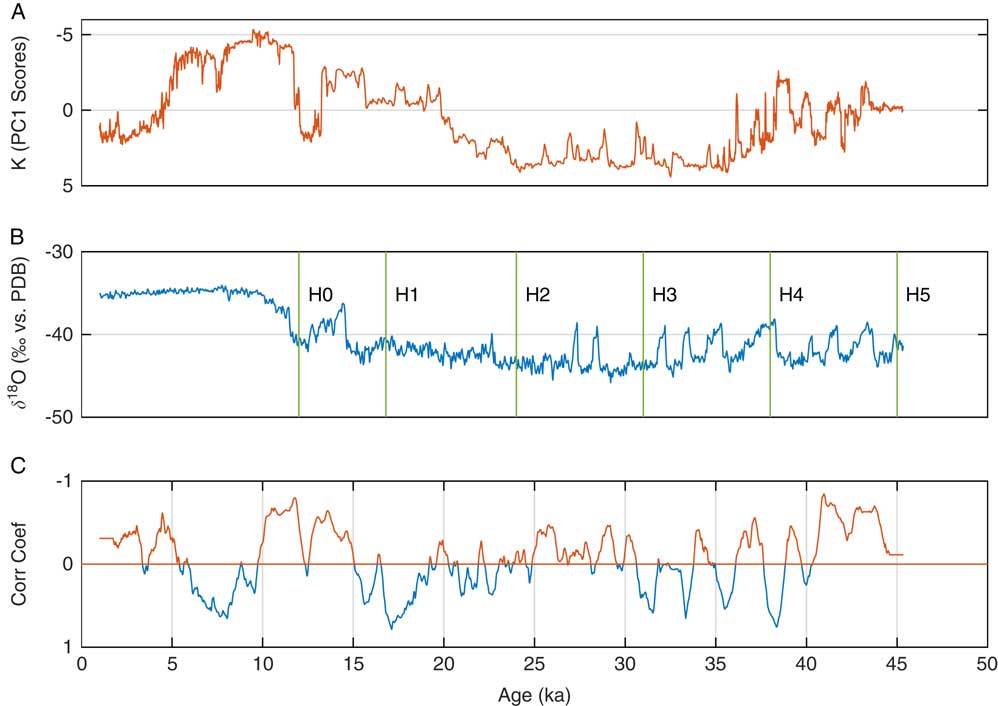
Figure 6 (color online) Comparing the Chew Bahir K record (A) after DTW alignment and PCA-based unmixing with (B) the δ18O data from the NorthGRIP ice core (North Greenland Ice Core Project members, 2004) suggests (C) a weak mostly negative correlation (Spearman coefficient less than -0.5) between environmental fluctuations in the Chew Bahir basin and high-latitude northern hemisphere millennial-scale climate fluctuations between 46 and 25 ka (during the Dansgaard-Oeschger cycles), and between 15 and 5 ka (including the Younger Dryas stade). Please note reverse scale of potassium (K) axis.
DISCUSSION AND CONCLUSIONS
The K record from the Chew Bahir basin provides one of the most complete and detailed records of eastern African climatic variations, covering two full precessional cycles (the last ~45 ka; Fig. 5 and 6). The six cores CB01–CB06 generally recorded the same climate signals but with different intensities (Fig. 2–4). Cores CB01–CB03 were collected at increasing distances from the Hammar Range, which is the main sediment source, while cores CB04–CB06 cores were collected towards the center of the basin. The center of the Chew Bahir basin is influenced to some extent by the Segen River, whereas the more western sites are increasingly influenced by runoff from the Hammar Range via the extensive alluvial fans, and episodically by the Weyto River. As a result, there are significant differences in the type of sediment, the rate of sedimentation and, most importantly, in the K concentrations in the sediments as well as the variability of these K concentrations. These differences can be used to separate influences that are specific to particular coring locations from regional influences with features that are clearly common to all areas. The AHP and the mostly dry period during the YD stadial can, for example, be identified in all of the investigated cores and the dry-wet-dry alternations during the D-O events in most of them, while some of the less distinct dry-wet transitions during glacial times can only be observed in cores CB01, CB04, and CB06, and, to a lesser extent, also in CB03.
The high-resolution K record from the Chew Bahir basin is a promising dataset for testing currently debated hypotheses on the causal mechanisms for the abruptness of the onset of the AHP and the gradual character of its termination (e.g., deMenocal et al., Reference deMenocal, Ortiz, Guilderson, Adkins, Sarnthein, Baker and Yarusinsky2000; Brovkin and Claussen, Reference Brovkin and Claussen2008; Kröpelin et al., Reference Kröpelin, Verschuren and Lézine2008a, Reference Kröpelin, Verschuren, Lézine, Eggermont, Cocquyt, Francus and Cazet2008b; Junginger and Trauth, Reference Junginger and Trauth2013; Tierney and deMenocal, Reference Tierney and deMenocal2013; Costa et al., Reference Costa, Russell, Konecky and Lamb2014; Shanahan et al., Reference Shanahan, McKay, Hughen, Overpeck, Otto-Bliesner, Heil, King, Scholz and Peck2015). The onset and termination of both the AHP and the YD are represented by dramatic changes in most environmental records from northern and equatorial Africa, including terrestrial dust records off the West African coast used as a proxy for aridity (deMenocal et al., Reference deMenocal, Ortiz, Guilderson, Adkins, Sarnthein, Baker and Yarusinsky2000), the δ15N data from the Gulf of Oman (18°N) used as a proxy for denitrification and productivity (Altabet et al., Reference Altabet, Higginson and Murray2002), and the δD leaf wax data from Lake Tanganyika used as a record of precipitation (Tierney et al., 2008). They are also represented by major changes in the K record from lake sediments in the Chew Bahir basin (Fig. 5 and 6).
There is a general consensus that the AHP was a result of increased insolation, higher sea-surface temperatures in the Indian Ocean, and increased atmospheric greenhouse gas concentrations (e.g., Kutzbach and Street-Perrott, Reference Kutzbach and Street-Perrott1985; Gasse, Reference Gasse2000; Otto-Bliesner et al., Reference Otto-Bliesner, Russell, Clark, Liu, Overpeck, Konecky, deMenocal, Nicholson, He and Lu2014). The results of our statistical analysis leave no doubt that the AHP, as recorded in the sediments of the Chew Bahir basin in southern Ethiopia, started abruptly at ~15,640 yr. Assuming that our age model is sufficiently accurate, this transition took less than 250 yr (Fig. 5 and 6). In contrast, the termination of the AHP was rather gradual, as recorded by a 990-yr transition in the mean K concentration (between 4875 to 3885 yr), or an even longer transition (~1995 yr) in the trend of the K concentration (between 5835 to 3840 yr). Despite its gradual nature, both estimates for the duration of the wet-dry transition at the end of the AHP suggest that the climate changed more rapidly than the orbitally induced reduction in insolation after its maximum at 11–10 ka, which in turn suggests a nonlinear response of the Chew Bahir climate to the resultant forcing (Fig. 5 and 6; Claussen et al., Reference Claussen, Kubatzki, Brovkin, Ganopolski, Hoelzmann and Pachur1999). The mid-point of the termination of the AHP at ~4860 yr, as determined by our change point analysis with a small number of possible transitions, is in agreement with the findings of Kuper and Kröpelin (Reference Kuper and Kröpelin2006) and Shanahan et al. (Reference Shanahan, McKay, Hughen, Overpeck, Otto-Bliesner, Heil, King, Scholz and Peck2015), suggesting a time-transgressive termination of the AHP during the course of the gradual southward migration of the tropical rain belt over approximately the last 7 ka. Holocene speleothem records from the southeastern Ethiopian highlands, with annual to decadal resolutions, also show a gradual decrease in rainfall between ~6.5 and 4.5 ka (Asrat et al., Reference Asrat, Baker, Umer, Moss., Leng, Van Calstren and Smith2007; Baker et al., Reference Baker, Asrat, Leng, Thomas, Fairchild, Widmann, Dong, Van Calsteren and Bryant2010).
One of the remarkable features of the K record from the Chew Bahir basin is the significant dry episode between 13,260 and 11,730 cal yr BP (Fig. 5 and 6; Foerster et al., Reference Foerster, Junginger, Langkamp, Gebru, Asrat, Umer and Lamb2012) in which the transition into and out of the dry episode is synchronous (within the errors of the age model) with the high northern latitude YD stade (12,900–11,700 cal yr BP; Alley, Reference Alley2000), suggesting a strong climate teleconnection between high and low latitudes over millennial time scales. This teleconnection is also expressed in the TEX86 temperature and dD leaf wax record from Lake Albert (Berke et al., 2014), which show marked variations in temperature and moisture during the YD chronozone. The transition from wet to dry at the onset of the dry episode in the Chew Bahir record occurred within ~45 yr (i.e., three data points of the K record), whereas the dry-to-wet transition lasted ~250 yr (i.e., 17 data points of the K record). The abruptness and magnitude of change from wet to dry and back again within decades or centuries shows the impact of this dramatic global (or hemispheric) climate change on the region.
The rapid fluctuations between ~46 and 20 ka are reminiscent of the high-latitude D-O cycles, whose expression in the tropics is also a matter of intense discussion (e.g., Brown et al., Reference Brown, Johnson, Scholz, Cohen and King2007; Brown et al., Reference Brown, Johnson, Scholz, Cohen and King2008; Garcin, Reference Garcin2008; Tierney and deMenocal, Reference Tierney and deMenocal2013). Our analysis clearly demonstrates that D-O type patterns are evident in the Chew Bahir record, as indicated by a negative correlation between the K concentrations and the δ18O record from the NorthGRIP ice core (North Greenland Ice Core Project members, 2004). It is interesting to note that a similar negative correlation also exists between ~15–10 ka, including the dry episode during the YD stadial, whereas there is either a positive correlation or no correlation (correlation coefficient values of 0–0.5) during those episodes with wetter climates.
Understanding how the east and northeast African climate switched from dry to wet and back to dry is essential for deciphering the effect that environmental instability may have had on humans. As an example, the K record in Chew Bahir lake sediments provides detailed information on how the environment responded to the gradual changes in insolation that occurred in a nonlinear, saddle-node bifurcation type of transition at the end of the AHP between 7.15 and 3.8 ka (Trauth et al., Reference Trauth, Bergner, Foerster, Junginger, Maslin and Schaebitz2015). Most of this transition is characterized by rather wet conditions but these are interrupted by at least 14 dry events that recurred every 160 ± 40 yr and lasted between 20 and 80 yr (Fig. 5 and 6; Trauth et al., Reference Trauth, Bergner, Foerster, Junginger, Maslin and Schaebitz2015). The final transition to predominantly dry conditions, however, occurred over a relatively extended time period of about 990 yr. In contrast, the transition from wet to dry within ~45 yr (at ~13,260 cal yr BP, within the errors of the age model) at the onset of the dry episode coinciding with the YD stadial possibly affected humans living in the area. High-resolution paleoclimate records such as that of Chew Bahir may allow more critical evaluation of established hypotheses, and to design alternatives, thus leading to a better understanding of human-environment interactions.
ACKNOWLEDGMENTS
This project was funded by German Research Foundation (DFG) grants to M.H.T. and F.S. through the Priority Program SPP 1006 ICDP and the CRC 806 Research Project at the University of Cologne. We thank C. Ohlendorf and S. Stahl from the Geomorphology and Polar Research Group at the University of Bremen and for the XRF scans. The previously published XRF scan results for cores CB01, CB03, and CB05 were supported by V. Wennrich at the University of Cologne. This research is part of a pilot study for the Hominin Sites and Paleolakes Drilling Project (HSPDP), within the framework of the International Continental Scientific Drilling Program (ICDP) and the DFG Priority Program SPP 1006 ICDP. This paper is publication number 12 of the Hominin Sites and Paleolakes Drilling Project (HSPDP).