


Introduction
The intensification of agriculture in the humid tropical region is mandatory to secure worldwide food supply. Soybean (Glycine max (L.) Merrill) is fundamental to the food production chain and stands out as the most exported grain in Brazil. Potassium (K) is the second most required and exported nutrient by soybean. So, K fertilisation should be carried out annually to reach or maintain high soybean yields in the highly weathered soils of the humid tropics (Boring et al., Reference Boring, Thelen, Board, De Bruin, Lee, Naeve, Ross, Kent and Ries2018; Vieira et al., Reference Vieira, Fontoura, Bayer, de Moraes, Carniel and Vieira2016).
The theoretical basis of the interactions between K and the other nutrients has been the subject of research for some decades (Addiscott, Reference Addiscott1974; Karley and White, Reference Karley and White2009; Nachtigall et al., Reference Nachtigall, Carraro and Alleoni2007). However, the subject is still relevant because new extractants have been proposed, and the nutrient requirements of modern soybean cultivars have been increasing. Cultivated soils in the humid tropics may spend years without receiving sources of magnesium (Mg) because of inadequate fertilisation management, especially without adding limestone to the system. This creates an unbalance in the relationships between calcium (Ca), Mg and K, and this unbalance is aggravated by the use of high K rates. Agbenin and Yakubu (Reference Agbenin and Yakubu2006) observed that might be a greater proportional reduction in Mg2+ content in relation to Ca2+ in highly weathered soils with annual K fertilisation.
The preferential series of retention of the exchangeable cations (Al3+, Ca2+, Mg2+ and K+) in the soils result from the amount of the cation, its valence and the radius of the hydrated ions (Bolt et al., Reference Bolt, Bruggenwert and Kamphorst1976). Soils dominated by kaolinite have low K+ selectivity as compared to soils dominated by 2:1 clay minerals with high K+ binding affinity (Feigenbaum et al., Reference Feigenbaum, Bartal, Portnoy and Sparks1991; Mengel and Kirby, Reference Mengel and Kirby1980). However, the preferential adsorption of K+ in relation to Ca2+, Mg2+ or Al3+ was reported by Pleysier et al. (Reference Pleysier, Juo and Herbillon1979), Udo (Reference Udo1978) and Agbenin and Yakubu (Reference Agbenin and Yakubu2006) in long-term experiments with K fertilisation in tropical soils.
The soil cationic unbalance may affect the nutrient contents of soybean index leaves. Therefore, the Diagnosis and Recommendation Integrated System (DRIS), proposed by Beaufils (Reference Beaufils1973), can be applied to diagnose the nutritional state of plants based on the nutrient contents in leaves. The DRIS has advantages over univariate methods (critical contents or sufficiency ranges) because it uses bivariate relationships between nutrients and the nutritional balance concept, and isolates environment effects by transforming contents into standardised indices, distributed in Gaussian form (Kurihara et al., Reference Kurihara, Alvarez Venegas, Neves and Novais2013; Walworth and Sumner, Reference Walworth and Sumner1987).
A series of experiments has been carried out with continuous K fertilisation over the years, to evaluate the effects of K inputs (Dobermann et al., Reference Dobermann, Cassman, Cruz, Adviento and Pampolino1996; Qiu et al., Reference Qiu, Xie, Zhao, Xu, Hou, Wang, Zhou, He, Johnston, Christie and Jin2014; Tiecher et al., Reference Tiecher, Calegari, Caner and Rheinheimer2017). However, studies with K deprivation on the relationships between K and other cations are scare. For example, Brunetto et al. (Reference Brunetto, Gatiboni, Santos, Saggin and Kaminski2005) established a more accurate K (Mehlich-1) critical content in a no-tilled Typic Hapludalf in the Brazilian southern region. Also, Zhou et al. (Reference Zhou, Yin and Verbree2014) investigated the residual effects of long-term K applications imposed to previous cotton during 14 years on soil K, plant K and corn yield (three subsequent years) in a no-tilled Oxyaquic Fragiudalf in Tennessee, USA. The absence of K fertilisation under cultivation promotes the reduction of exchangeable K contents in soil. Under these conditions, the damages caused by the use of high K rates could be reduced over time, mainly regarding the absorption of Ca and Mg. This is due to the continuous export of K and absence of nutrient inputs. Nevertheless, the effects of K deprivation on other nutrients in soil and plants, and the reapplication of the rates previously used after a long period, remain unclear.
The objectives of the authors in this study were to evaluate the effects of 8 years of K deprivation and reapplication on the Ca and Mg contents and cationic ratios of and Oxisol, and the concentration of Ca and Mg on soybean index leaves and grain. The relations between ion exchange resins and other extractants on the dynamics of Ca, Mg and K in the soil and soybean nutrition were also established.
Material and Methods
Study area
A long-term field experiment has been conducted on a Rhodic Hapludox (Soil Survey Staff, 2014) since 1983 in Londrina, Parana state, Brazil (23°11′ S lat; 51°10′ W long, 609 m asl). The region has a humid tropical climate (Cfa) according to the Köeppen system, with dry periods in winter and rainfall in all the seasons (1500–1800 mm annually). Five rates of K were applied (33, 66, 99, 132 and 165 kg ha−1) as K chloride (50% K) and a control treatment (without K fertilisation) in 40 m2 plots (8 m × 5 m) with four replications. The K fertilisation was carried out annually with a total of 33 kg ha−1 K being applied at sowing, and the remainder part of the rate as topdressing about 30 days after emergence to avoid saline stress. The experimental area has been managed under no-till since 1998.
The last liming was carried out in 2005 with the application of dolomitic lime (90% of effective CaCO3 equivalent; 35% CaO; 12% MgO) to elevate the base saturation to 70% (van Raij et al., Reference van Raij, Cantarella, Quaggio and Furlani1997). In October 2008, the K fertilisation (all rates) was interrupted. The experimental area was cultivated without K until October 2015, when the plots were subdivided. The initial experiment with a random block design (RB) then became an RB with split plots. The original plots were divided into two subplots of 4 m × 5 m, one without K fertilisation for the eighth year and the other received the previously mentioned K rates after seven crops under K deprivation.
The area was cultivated with soybean in the summer (summer crop: 1983–2015) and wheat (Triticum aestivum L.), corn (Zea mays L.), sunflower (Helianthus annuus L.) or black oats (Avena strigosa L.) in the fall or winter crop. The winter crops did not receive K fertilisation during the experiment. Management practices such as sowing, application of pesticides and harvesting were mechanised, and all the other nutrients were made available under the same conditions for all the treatments.
Sampling and analysis
On December 2015 (60 days after the reapplications of K to the subplots), soil samples from the 0.0 to 0.2 m layer (samples were made up of five subsamples collected randomly from each experimental unit) were collected using an auger. Soil samples were dried in an oven with forced air circulation (40 °C) and sieved (2 mm mesh) for the determination of the soil chemical attributes: pH in 0.01 mol L−1 CaCl2; organic carbon (°c) extracted with K dichromate (Walkley and Black, Reference Walkley and Black1934; Yeomans and Bremner, Reference Yeomans and Bremner1988); potential acidity (H+Al) – (buffer solution SMP) – (Shoemaker et al., Reference Shoemaker, McLean and Pratt1961); Ca2+, Mg2+, Al3+ (1 mol L−1 KCl), available K and P using Mehlich-1 solution (Mehlich, Reference Mehlich1953).
K, Ca and Mg were also extracted with ion exchange resin (van Raij et al., Reference van Raij, Quaggio and da Silva1986). Copper (Cu), iron (Fe), manganese (Mn) and zinc (Zn) were extracted from the soil according to Lindsay and Norvell (Reference Lindsay and Norvell1978) with DTPA-TEA (0.005 mol L−1 diethylenetriaminepentaacetic acid + 0.1 mol L−1 triethanolamine + 0.01 mol L−1 CaCl2), and boron (B) according to Berger and Truog (Reference Berger and Truog1944) with hot water. The Al3+ determination was carried out by titration with 50 mmol L−1 NaOH. Ca2+, Mg2+, K+, Cu2+, Fe2+, Mn2+ and Zn2+ were determined by Atomic Absorption Spectrophotometry (AAS) – (Perkin Elmer 1100B) and P by molecular absorption spectrophotometry UV–vis (MAS) – (UV-M51 with a photodiode detector, 0.002 A h−1 of stability working under 80 W).
The chemical attributes of the samples collected from the experimental area in December 2015 are in Table 1. Grains yield data from 2008 to 2015, as well as the exchangeable contents of K, Ca and Mg in the soybean plants in 2008 were taken from the Brazilian Agricultural Research Corporation database.
Table 1. Soil chemical attributes and granulometric distribution of an Oxisol on July 2015

OC = organic carbon (K2Cr2O7); Ca, Mg and Al (KCl 1 mol L−1); P and K1 (Mehlich-1); K2 (ion exchange resin); H+Al = (SMP – Schomaker–McLean–Pratt buffer solution); CEC = cation exchange capacity at pH 7.0. The means±(uncertainty) were calculated considering the results of 24 composite samples (5 subsamples), taken from the experimental units.
On December 2015 (60 days after the reapplications of K to the subplots), 25 trifoliate leaflets (index leaves) were collected randomly from each subplot (third from the apex of the plant, without petiole) during soybean full flowering (R2), stage in which the highest K absorption rates by the plant occur (Zobiole et al., Reference Zobiole, Oliveira Junior, Constantin, Oliveira Junior, Castro, Oliveira, Kremer, Moreira and Romagnoli2012). During maturation (R8), a mechanised harvest was carried out (6 m long from each of the three central lines of the subplot, a total of 9 m2). All plant material (leaves and grains) was dried at 45 °C until constant weight, ground and sieved using a 0.5 mm mesh. The plant tissue (0.25 g) was digested in 6 mL of 65% (v/v) HNO3 and 2 mL of 30% (v/v) H2O2 and the elements in the digests were determined by Inductively Coupled Plasma Atomic Emission Spectrometry (ICP-AES). The equipment (Thermo Scientific iCAP 6200) was set at 1150 W, with 0.5 and 0.7 L min−1 of auxiliary and nebulizer gas flows, respectively, with yttrium (Y) as an internal standard.
The digestion was carried out in a humid microwave oven under the following conditions: 10 min heating; maintained at 170 °C for 15 min under 2 MPa of pressure; cooling for 20 min, to reach room temperature (USPEA, 1996). The nutrients concentrations in index leaves were compared with well-known nutrient sufficiency levels for clayey soils of the northern Parana, Brazil (Harger, Reference Harger2008). Soybean grain yields (kg ha–1) were calculated based on the sample mass and the area harvested and adjusted to 130 g kg–1 water content.
Data analysis
Regression analyses were carried out for nutrients (N, P, K, Ca, Mg, S, B, Zn, Cu, Mn and Fe) in their available forms in the soil and in the plant tissues (index leaves and grains), as well as the yield of the subplots with reapplication of K fertiliser after 8 years of K deprivation (+K) and the subplots without application of the K fertiliser during eight consecutive years (−K). The independent variables were K rate and the contents of the exchangeable K extracted from the soil with Mehlich-1 or ion exchange resin. Only equations with significant parameters (p < 0.05) had their models plotted. No figures were made for results that showed no clear trend. Soybean yields over the years, from the 2008/2009 to the 2015/2016 crop, were compared by the Tukey Honesty Test of Difference (HSD). With the exception of soybean yield, the other models were plotted with the means and their respective standard errors. Principally, linear, quadratic and exponential models were considered to investigate the effect of the independent variables.
DRIS was used to interpret the nutritional status of the soybean plants by comparing the calculated indices based on the relationships between the quantities of the nutrients in the leaves. The DRIS standards used were established by the Brazilian Agricultural Research Corporation that possesses a vast database for the varieties of soybean cultivated in Paraná State, based on the calculation of intermediate functions proposed by Jones (Reference Jones1981).
Results
K, Ca and Mg in soil
The contents of exchangeable K extracted from the 0 to 0.2 m soil layers with Mehlich-1 and ion exchange resin increased linearly with the K rates (Figure 1). The ion exchange resin extracted larger quantities of K in relation to Mehlich-1, as can be seen from the linear coefficients of the models (Figure 1), ranging from 52.5% more in the control treatment to 12.9 or 14.6% more in the 165 kg ha−1 K treatment with or without K reapplication. In addition, an increase in the K contents extracted with the ion exchange resin in function of the reapplication rates was observed (Figure 1b). In the absence of K reapplication after the period of deprivation of this nutrient, the K contents extracted with Mehlich-1 presented lower increases than those with the rates of K from 0 to 66 kg ha−1 K in relation to the rates of 99–165 kg ha−1 K (Figure 1a).

Figure 1. Plant-available K in soil extracted by Mehlich-1 (a) and ion exchange resin (b) as function of K reapplication (+K) or maintenance of the nutrient deprivation (−K) after 8 years in the 0–0.2 m layer. The standard error bars (n = 4) compare the effect of the K reapplication on each rate.
There was a linear reduction in the contents of exchangeable Ca and Mg with an increase in K rates that had been applied until 2008 (Figure 2). The reapplication of K after the deprivation period did not modify (p > 0.05) the contents of exchangeable Ca and Mg in the soil, regardless of the extractant (1 M KCl or ion exchange resin). The contents of Ca and Mg extracted with ion exchange resin were on average 20 and 4% lower than those extracted with 1 M KCl (Figure 2). The correlations between the contents of Ca and Mg were 0.53 (p < 0.05) when extracted from the soil with 1 mol L−1 KCl and 0.13 when extracted with ion exchange resin.

Figure 2. Exchangeable Ca (a) and Mg (c) extracted with KCl 1 mol L−1 and exchangeable Ca (b) and Mg (d) extracted with ion exchange ion exchange resin in soil as function of K reapplication (+K) or maintenance of the nutrient deprivation period (−K). The standard error bars (n = 4) compare the effect of the K reapplication on each rate.
The ratio (Ca+Mg)/K reduced exponentially as a function of the increases in K rates, independent of the extractant used or the reapplication of K after the 8 years of K deprivation (Figure 3). The non-linear exponential decay equations of the (Ca+Mg)/K relations implied a strong relationship between the K rate applied to the soil and the contents of exchangeable Ca and Mg in the soil (Figure 3). When the ion exchange resin was used as the K extractant, the (Ca+Mg)/K ratios were lower, due to the higher quantities of K extracted (Figure 3b, Figure 3d). This indicates that the ion exchange resin could extract K forms that were inaccessible to the Mehlich-1.

Figure 3. (Ca+Mg)/K ratios in soil as function of K rates reapplication (+K) or the maintenance of K deprivation (−K). K extracted with Mehlich-1 (a and c) and extracted with ion exchange resin (b and d), Ca and Mg extracted with 1 mol L−1 KCl (a and b) and extracted with ion exchange resin (c and d).
K, Ca and Mg in plants
There was a non-linear increase in the contents of K in the index leaves with the increase in available K in the soil (Figure 4). The reapplication of K did not modify the tendencies of the models. In general, the contents of K in the index leaves stabilised from 100 mg kg−1 K in the soil when Mehlich-1 was the extractant and 140 mg kg−1 in the extraction with ion exchange resin (Figure 4). The contents in grain had a non-linear increase with the availability of K, stabilising at contents equal to or higher than 80 mg kg−1 of K in the soil (extracted by Mehlich-1) – (Figure 4a, Figure 4b) and 120 mg kg−1 of K extracted by ion exchange resin (Figure 4c, Figure 4d).

Figure 4. Potassium contents in leaves (R2 stage), and grains (R8 stage) as function of exchangeable K contents in soil extracted with Mehlich-1 (a and b) and ion exchange resin (c and d) contents with (+ K) and without (−K) K reapplication after 8 years of deprivation.
The contents of Ca in the index leaves reduced linearly with the increase in the contents of exchangeable K regardless of the extractant (Figure 5). The reapplication of K after 8 years did not alter the tendency of the contents of Ca in the index leaves to reduce linearly (Figure 5). The Mg contents in the index leaves reduced in a non-linear way with the increase in the exchangeable K contents (Figure 5). The contents of Ca and Mg in the grains did not vary with the increase in bioavailable contents of K in the soil by the applied rates, not even with the reapplication of K after 8 years. The average contents in the grains were 2.50 g kg−1 for Ca and 2.84 g kg−1 for Mg.

Figure 5. Ca and Mg contents in index leaves as function of exchangeable K contents in soil extracted with Mehlich-1 (a and c) and with ion exchange resin (b and d) after K rates reapplication after the deprivation period (c and d), or the K deprivation maintenance for the eighth year (a and b). (+K) with reapplication and (−K) without reapplication after the K deprivation period.
K influence in N, P and S contents
The contents of N in the grains diminished with the increase in the rates of K applied until 2008, whereas the contents of S increased linearly (Figure 6). However, the reapplication of K in 2015 did not alter the tendencies observed for the contents of N and S in the grains (Figure 6). The average content of P in the grain was 5.4 g kg−1 and was not affected by K rates or the reapplication of the nutrient after the period of deprivation. The contents of N, P and S in the index leaves were not altered, on average 55.5, 4.6 and 2.4 g kg−1, respectively.
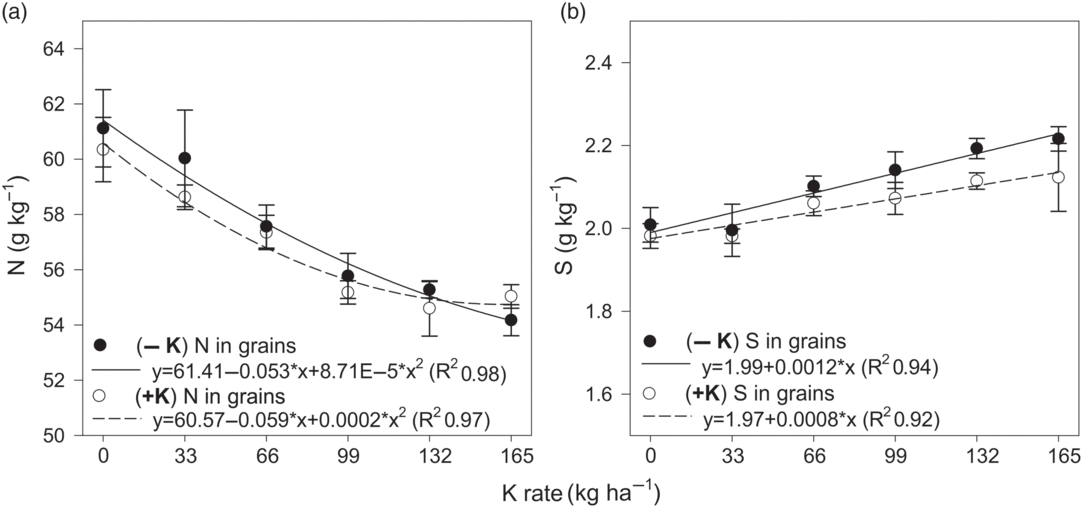
Figure 6. Nitrogen (a) and sulphur (b) contents in soybean index leaves as function of K rates deprivation for 8 years (−K) or their reapplication after this period (+K).
K influence on micronutrient’s contents
The contents of B, Zn, Mn, Fe and Cu in the soil did not vary with the rates of K, not even with the reapplication of K after the period of K deprivation, with average contents of 0.3, 1.8, 200, 14 and 9.8 mg kg−1, respectively. The same was observed for Zn, Mn, Fe and Cu in index leaves, with average values of 42, 109, 138 and 9.7 mg kg−1, respectively. Conversely, the contents of B in the index leaves diminished in a non-linear trend with the increase in the K rates applied until 2008. On the contrary, the reapplication of K rates after 8 years of nutrient deprivation did not alter the trend observed in B contents in the index leaves. A high negative correlation between the contents of B and K (r = −0.94) and a high positive correlation between the contents of B and Ca (r = 0.73) in the index leaves were observed. With respect to the contents of B, Zn, Mn, Fe and Cu in the grain, no trends were observed with the applied K rates or with K reapplication after 8 years, with average contents of 29, 40, 32, 66 and 11 mg kg−1.
K impact in grains yield and DRIS
Based on the yield of the crops from 2008 to 2015, it is clear that the rate of 66 kg ha−1 K was efficient in maintaining yields equal to or close to the highest yields observed during the experiment at the time of K deprivation (Table 2). From the third harvest under K deprivation (2010/2011), the yield of the control treatment under 33 kg ha−1 K was lower than the other treatments, and this tendency was accentuated in the following harvests (Table 2).
Table 2. Grain yields (summer + winter) in six crops after the beginning of the K deprivation period

Means followed by the same letter in the columns do not differ (Tukey test, at 5% probability).
* Crops sequence: 2008/2009 – soybean/oats; 2009/2010–2011/2012 – soybean/wheat; 2012/2013 and 2013/2014 – soybean/corn; 2014/15 – soybean/wheat.
† Soybean yield with K reapplication after the deprivation period.
‡ Soybean yield without the reapplication.
Soybean yield increased in a non-linear trend (Figure 7). The models had lower exponential base values (model curvature) when the extractant was Mehlich-1 (Figure 7a, Figure 7c) than the exponential base values when ion exchange resin was used (Figure 7b, Figure 7d). As a consequence, the soybean yield stabilised when the content extracted by Mehlich-1 was 1.5 mmolc dm−3. On the contrary, the stabilisation in soybean yield just occurred when K contents extracted by ion exchange resin were close to 3 mmolc dm−3 (Figure 7b, Figure 7d).

Figure 7. Soybean grains yield as function of Mehlich-1-extractable K (a and c) and ion exchange resin-extractable (b and d) K in soil. (+K) with reapplication and (−K) without reapplication after the K deprivation period.
The DRIS indices obtained corroborate the yield results (Table 2) and the contents of nutrients absorbed by the plants (Figures 4–6) once a greater nutritional imbalance was evident in the control treatment and under 33 kg ha−1 of K as compared to the other rates (Table 3). The closer to zero, the more adequate is the nutritional condition that the index represents for the concentration of a given nutrient in the index leaf (Beaufils, Reference Beaufils1973). Thus, the DRIS index for K reached satisfactory values with the reapplication of 99 kg ha−1 K (0.2) after 8 years without K fertilisation. In the subplots that did not receive K in 2015, a rate of 132 kg ha−1 of K that has been applied until 2008 was sufficient to maintain the DRIS index close to zero (0.3) (Table 3). Nutrients such as S, Fe and Cu exhibited negative DRIS indices in all the treatments (Table 3).
Table 3. DRIS indices for nutrients contents in soybean trifoliate leaflets (index leaves)

* Nutritional balance index.
† Control treatment.
Discussion
K in the soil–plant system
The increase in K availability in the soil with K rates (Figure 1) promoted an increase in the K contents in index leaves, from 9.1 g kg−1 (control) up to values of 25.6 g kg−1 with K fertilisation and 24.2 g kg−1 without K fertilisation (165 kg ha−1 of K) (Figure 4). This change represents a transition from low to very high contents, for the trifoliate leaflets collected without petiole (Harger, Reference Harger2008).
Contents between 19 and 22 g kg−1 of K in trifoliate leaflets (index leaves) are usually related to high yields of soybean grains (Stammer and Mallarino, Reference Stammer and Mallarino2018). These contents, however, vary with the cultivars (Clover and Mallarino, Reference Clover and Mallarino2013; Stammer and Mallarino, Reference Stammer and Mallarino2018). The upward trend in K contents in the soybean trifoliate leaflets did not vary with the reapplication of K after 8 years of deprivation, but varied depending on the extractant of exchangeable K contents. This is because Mehlich-1 extracted lower quantities of K from the soil in comparison to the ion exchange resin making the curvature of the models more accentuated (Figure 4a, Figure 4b). Bortolon et al. (Reference Bortolon, Gianello, Welter, Almeida and Giasson2011) observed the opposite, with the ion exchange resin extracting the lowest amounts of K. However, the results presented by Bortolon et al. (Reference Bortolon, Gianello, Welter, Almeida and Giasson2011) are averages of 130 soil samples of eight soil orders, with pH values varying from 4.1 to 7.1, SOM values from 5 to 181 mg dm−3 and clay contents from 60 to 790 mg dm−3. Nevertheless, Bortolon et al. (Reference Bortolon, Gianello, Welter, Almeida and Giasson2011) worked with 7.5 cm2 membrane strips while we worked with polymer spheres with microporosity. In addition, prior to extraction our samples were disrupted by shaking with glass marbles (1.8 cm diameter), as van Raij et al. (Reference van Raij, Quaggio and da Silva1986) suggest. Another important factor is that we kept the samples in contact with the resin for 16 h at 220 rpm, while Bortolon et al. (Reference Bortolon, Gianello, Welter, Almeida and Giasson2011) held for the same time at 27 rpm. This set of factors may have led to the extraction of larger quantities of K. Furthermore, Rahmatullah and Mengel (Reference Rahmatullah and Mengel2000) displayed that the K extraction nature of the ion exchange resin can promote the release of non-exchangeable K forms, by its action as an extractant to simulate the plant roots. The absence of drastic differences in soybean yields with K reapplication after the deprivation period is an indication that non-exchangeable forms replenished exchangeable K over time and corroborates the higher contents of K extracted by resin in relation to those extracted by Mehlich-1.
Grains are primary drains of K contained in the other plant tissues that are unnecessary for the specie propagation (White, Reference White and Marschner2012). Summing this to the elevated mobility of K+ in the phloem (Ahmad and Maathuis, Reference Ahmad and Maathuis2014; Karley and White, Reference Karley and White2009), the supply to the grains was guaranteed even under K deprivation (Figure 4). The K contents in grains remained close to 18.5 g kg−1 at the highest application rates (99, 132 and 165 kg ha−1 K). This indicates that the grains do not exhibit a variation in K concentration similar to that observed for leaves. Parvej et al. (Reference Parvej, Slaton, Purcell and Roberts2015) obtained similar results when studying the influence of the growth habit of soybean cultivars on sensitivity to K deficiency and verified an increase in K contents in grains up to 19.8 g kg−1, under high K availability. K grain contents stabilisation, even after high K fertiliser inputs, has important implications for K balance calculations in soybean areas. In addition, K recommendations based on K removals and yield potential can be improved by knowing the maximum K grain concentration reached by a specific cultivar. In a review that covered the years 1922–2015, Balboa et al. (Reference Balboa, Sadras and Ciampitti2018) concluded that K concentrations in soybeans decreased by 13%, for P a decrease was also observed (18%), while for N there was an increase. Balboa et al. (Reference Balboa, Sadras and Ciampitti2018) results may be related to genetic and physiological limitations regarding the accumulation of K in grains, which follows a stabilisation pattern contrary to that observed in other tissues of soybean plants. Despite the characteristic luxury K uptake that soybean presents (Ciampitti and Vyn, Reference Ciampitti and Vyn2012), even at high K concentrations in the soil K, our results suggest that K removals are more related to the grain mass produced than to the K concentration in grains.
K influence on Ca and Mg in the soil–plant system
High concentrations of K+ in the soil solution could competitively inhibit the absorption of Ca2+ and Mg2+ by plants (Mengel and Kirkby, Reference Mengel and Kirkby2001). A reduction in the Ca and Mg contents in index leaves with the increase in K availability (Figure 5) was probably the result of the competition between these cations and K+ for absorption. Beyond the increase in K concentration due to K fertilisation, the preferential absorption of K may have occurred because of its monovalent valence and its lower degree of hydration, resulting in a higher velocity of absorption.
Although there is an antagonistic relationship between Ca2+ and Mg2+, excess Mg2+ in the rhizosphere has little influence on the absorption of K+. This accentuates the importance of the specificity of the transporters for absorption of each cation. Besides the reduction in the absorption of Ca and Mg by competition with K (Figure 5), lower contents of these bivalent cations in plants well nourished with K could occur due to the dilution effect provoked by a higher rate of plant growth (Foloni and Rosolem, Reference Foloni and Rosolem2008). Under these circumstances, a reduction in the concentration of Ca and Mg in the plant tissues does not necessarily cause a loss in yield, except when K contents are excessively high.
Oliveira et al. (Reference Oliveira, Carmello and Mascarenhas2001) also observed that the increase in K availability in the soil intensified the competitive effect on the absorption of Ca and Mg by soybean, with a greater effect on Mg, as observed in the present study. In our study, the K increments in soil accentuated the reduction of Mg contents in the trifoliate leaflets to the point of making it non-linear, and this is because the greater competitiveness between K and Mg ions than between K and Ca ions (Figure 5). The higher sensitivity of Mg relative to Ca to the addition of K has also been noticed by Agbenin and Yakubu (Reference Agbenin and Yakubu2006) and Nachtigall et al. (Reference Nachtigall, Carraro and Alleoni2007).
The movement of Ca2+ to the grains is highly dependent on the transpiration intensity of the plant and movement through the xylem, due to its restricted mobility in the phloem (Karley and White, Reference Karley and White2009). Therefore, its concentration in grains is lower and less influenced by the K contents. Although there was a reduction in the Mg contents in the soil and in the index leaves due to the increase in K availability (Figure 2, Figure 5). Magnesium presents high mobility in the phloem (Mengel and Kirkby, Reference Mengel and Kirkby2001), and the phloem sap is generally rich in K+ and Mg2+. Thus, storage tissues that are mainly supplied by the phloem sap, such as grains, present high concentrations of these cations (Karley and White, Reference Karley and White2009).
It is likely that the reapplication promoted better plant development and nutrient absorption, including Mg2+, such that the index leaves contents were diluted by the higher plant growth under these conditions. However, this did not affect the supply to the grains in relation to the other plants that remained under K deprivation. This effect was highlighted by the Mg DRIS indices that decreased with the K rates increase (Table 3).
Exchangeable K, Ca and Mg extractants
Mehlich-1 and ion exchange resin were sensitive to the increase in K plant availability with the rates applied until 2008, even after 8 years without addition of K fertiliser (Figure 1). This finding confirms the results of Yin and Vyn (Reference Yin and Vyn2004) and Rosolem et al. (Reference Rosolem, Vicentini and Steiner2012) about the durability of the effect of K fertilisation on highly weathered soils. However, the lower extracting potential of Mehlich-1 relative to the ion exchange resin was evident in the segmented linear fit adopted for the condition that was maintained under K deprivation (Figure 1a). In the model, the inflexion point is observed at 66 kg ha−1 K and represents a change in the quantities of K extracted by Mehlich-1 (Figure 1a). The difference between the angular coefficients of the models in Figure 1b occurred as a consequence of K reapplication, which increased the available K contents in the soil, as expected.
The contents of exchangeable Ca and Mg decreased linearly with the increase in K rates applied until 2008 (Figure 2). These decreases occurred regardless of the Ca2+ or Mg2+ extractant utilised (1 M KCl or ion exchange resin) – (Figure 2). The Ca2+ or Mg2+ displacement probably occurred by mass action with the increase in K concentrations by K rates applied until 2008. The hypothesis of a decrease in the adsorbed amounts of Ca2+ or Mg2+ because of the decreased selectivity was not considered. Ji and Li (Reference Ji, Li and Yu1997) found that increases in the relative K+ selectivity in relation to Ca2+ and Mg2+ would occur with a decrease in total ionic concentration and increase in pH (between 5.5 and 6.5). However, even after a long period without receiving K, the increase in exchangeable K contents with the reapplication did not promote effects on the exchangeable contents of Ca and Mg in soil. These results reinforce the observations of Agbenin and Yakubu (Reference Agbenin and Yakubu2006) about the reduction of Ca and Mg contents after continuous application of K fertiliser. After the reapplication of 165 kg ha−1 K, Ca and Mg contents were reduced 24 and 28%, respectively, in relation to the control treatment. However, they did not reach low or insufficient level, according to the criteria of Sfredo (Reference Sfredo2008) in soils with a cation exchange capacity (CEC) greater than 80 mmolc dm−3.
The 1 M KCl solution extracts Ca and Mg by solution saturation with K+ and ionic exchange. It is possible that the use of an extractant with K accentuated the ion exchange process in samples from plots that received the highest available K levels (higher K saturation). This did not happen in the resin because its mechanism of extraction occurs by an electrochemical gradient load. However, the explanation for the difference between Ca2+ and Mg2+ remains inexact and may be related to the amount of these nutrients in the exchange complex.
The (Ca+Mg)/K ratios varied with the nature of the extractant used for each cation and with the increase in K due to the rates applied until 2008 (Figure 3). The (Ca+Mg)/K ratios in the subplots that remained without K application in 2015 were higher than in the plots that received K in 2015, as expected, because of the increase in K from the fertilisation (Figure 3). The lower extraction potential of Mehlich-1 for K was confirmed by the elevated (Ca+Mg)/K ratios observed under the 33 kg ha−1 K rate and in the control treatment (Figure 3a, Figure 3c). When the ion exchange resin was used to extract K, Ca and Mg, the ratios varied only a little between the conditions with and without the application of K after 8 years of deprivation of this nutrient (Figure 3b, Figure 3d). This effect is probably related to the lower amplitude of K values extracted by ion exchange resin. Thereby, the ion exchange resin apparently is a more satisfactory cation extractant than Mehlich-1 to establish connections between the ratio (Ca+Mg)/K and variables such as yield (Figure 3).
The stabilisation of the (Ca+Mg)/K ratios occurred between 10 and 15, which corresponds to rates between 99 and 132 kg ha−1 of K. Under these conditions, the contents of exchangeable K were above 100 mg dm−3. Oliveira et al. (Reference Oliveira, Carmello and Mascarenhas2001) also observed a non-linear downward trend in the (Ca+Mg)/K ratios and a stabilisation of the ratios with rates above 124 kg ha−1 of K in samples from a Rhodic Hapludox. Oliveira et al. (Reference Oliveira, Carmello and Mascarenhas2001) observed higher soybean yield with (Ca+Mg)/K ratios between 20 and 30 using the ion exchange resin as the K extractant. In our study, the highest soybean yields were observed with (Ca+Mg)/K ratios between 10 and 20, which is probably related to the higher K demand of the soybean variety BRS1010. However, Oliveira et al. (Reference Oliveira, Carmello and Mascarenhas2001) concluded that nutritional imbalance was evident when the values of the (Ca+Mg)/K ratios in the soil were above 30. The reduction in the (Ca+Mg)/K ratios with the increase in K application did not influence yield, and the (Ca+Mg)/K ratios observed in our study were close to those considered adequate by Mascarenhas et al. (Reference Mascarenhas, Tanaka, Carmello, Gallo and Ambrosano2000) and Rosolem et al. (Reference Rosolem, Machado, Maia and Nakagawa1992), 23 and 31, respectively.
K interaction with N, P and S
K maintains functional relationships with N during the processes of photosynthesis and protein biosynthesis (Hawkesford et al., Reference Hawkesford, Horst, Kichey, Lambers, Schjoerring, Skrumsager, White and Marschner2012). The reduction in the N contents in grains with the increase in K rates probably occurred due to the higher yield of the plants with greater availability of K in the soil. The lower quantity of grain produced in the plots with low K availability made it possible for N to accumulate in higher quantities, due to its high mobility in the phloem (Figure 6a). In general, soybean is auto-sufficient in the absorption and use of N through biological fixation of this nutrient, with rare reports of responses to nitrogen fertilisation, which are often confused with responses to other management factors (Ciampitti and Salvagiotti, Reference Ciampitti and Salvagiotti2018; Salvagiotti et al., Reference Salvagiotti, Cassman, Specht, Walters, Weiss and Dobermann2008).
The absorption, assimilation and redistribution of S in soybean are quick processes (Garsed and Read, Reference Garsed and Read1977). Sulphur is fundamental for protein synthesis, which can be confirmed by the reduced accumulation of proteins in grains of plants with S deficiency (Hawkesford et al., Reference Hawkesford, Horst, Kichey, Lambers, Schjoerring, Skrumsager, White and Marschner2012). Besides being involved in the activation of many S containing enzymes, K is also involved in various stages of translation including the association of the tRNAs with the ribosome (Hell, Reference Hell1997). Thus, it is possible that synergism exists between K and S in storage organs, suggested by an average increase of 7.5% in the S contents in grains comparing to the control and the 165 kg ha−1 K rate (Figure 6b).
Phosphorus accumulated rapidly in soybean grains during the maturation phase, primarily in the form of phytic acid, in association with other nutrients such as K, Mg, Fe and Zn (Raboy, Reference Raboy2009). The absence of variation in P contents in the index leaves and grains was probably related to the homogeneity of the contents of available P (Mehlich-1) in the experimental area, as well as the minimal influence that K fertilisation has on the absorption and transport of P.
K interaction with micronutrients
The interaction between B and K in plants is usually synergistic because of the mutual participation of these nutrients in physiological processes (Ranade-Malvi, Reference Ranade-Malvi2011). Boron affects meristem growth, biosynthesis of hemicellulose and cell walls, plasma membrane functionality, carbohydrate metabolism and the mobilisation of auxins (Tariq and Mott, Reference Tariq and Mott2007). Some of these functions are carried out in association with Ca, which supports our findings of high positive correlations between Ca and B and high negative correlations between B and K in index leaves. The B contents reduction in the index leaves with the increase in K rates was probably associated with the low mobility of B in the phloem, and its physiological association with Ca that undergoes direct decrease in trifoliate leaflets due to the addition of K (Marschner, Reference Marschner2012). There is also the dilution effect related by Fageria (Reference Fageria2009) and Samarah et al.(Reference Samarah, Mullen and Cianzio2004), which is recognised as one of the main problems in the study of micronutrients in plant nutrition.
The contents of Fe and Cu in the index leaves were sufficient for good plant nutrition, based on the classification of Harger (Reference Harger2008). These micronutrients do not present restricted mobility in the phloem, which guarantees their redistribution to the grains (Marschner, Reference Marschner2012). The maximum concentrations of Fe and Cu in soybean grain normally occur at the end of the reproductive period (Slipcevic et al., Reference Slipcevic, Vedrina-Dragojevic and Balint1993). However, the DRIS indices in the index leaves for these nutrients were negative (Table 3), with values of below 10 that indicate a slight deficiency.
Soybean yield and nutritional status
Drastic differences in the yield of the control treatment in relation to the others are probably related to the water balance during the harvests, mainly in the 2012/2013 season, when the lowest accumulated rainfall was recorded. Soybean yield was affected by K availability in the soil, independent of the K extractant used (Mehlich-1 or ion exchange resin) (Figure 7). In the extraction with Mehlich-1, it was evident that over a range of 0.5–1.5 mmolc dm−3 of the nutrient there was greater yields, 1800–3800 kg ha−1 (Figure 7). When ion exchange resin was used as the extractant, the contents of available K for the same yield range occurred between 1.0 and 3.0 mmolc dm−3 (Figure 7). These results indicate that the use of ion exchange resin may be more interesting for the prediction of soybean yields in Oxisols with varied K availability. The ion exchange resin extracts probably contain more forms of K actually capable of being absorbed by plants. These forms may not be accessed by the Mehlich-1 extractant, which makes it less efficient at low K availability. However, at K contents above 2 mmolc dm−3, the Mehlich-1 extractant presented good stability, similar to that observed for the ion exchange resin at contents above 3 mmolc dm−3.
For southern Brazilian Hapludalfs, Brunetto et al. (Reference Brunetto, Gatiboni, Santos, Saggin and Kaminski2005) found critical levels of 1.1 mmolc dm−3 K (Mehlich-1), similar to the values reported by Borkert et al. (Reference Borkert, Sfredo and Silva1993) of 1.0 mmolc dm−3 in the same Oxisol investigated in the present study. Vieira et al. (Reference Vieira, Bayer, Fontura, Anghinoni, Ernani and Moraes2012) recommend the critical level of 3 mmolc dm−3 (Mehlich-1) in no-tilled Oxisols. Our results indicate critical contents around 1.2 mmolc dm−3 K by Mehlich-1 (with or without K reapplication after the deprivation period) (Figure 7), close to the results obtained by Kaminski et al. (Reference Kaminski, Moterle, Rheinheimer, Gatiboni and Brunetto2010) in an Hapludalf under long-term K fertilisation. According to NEPAR (2017), the critical K content extracted by Mehlich-1 in Paraná state soils is 2.1 mmolc dm−3, slightly higher than observed in the present study. For grain crops in soils with CEC between 7.6 and 15 cmolc dm−3, CQFSRS-SC (2016) classifies 2.3 mmolc dm−3 K as critical content extracted by Mehlich-1. The higher critical K contents reported by NEPAR (2017) and CQFSRS-SC (2016) were determined in studies with a variety of soils with more or less demanding K soybean cultivars. Therefore, variations from the results obtained in the present study were expected.
According to Schlindwein et al. (Reference Schlindwein, Bortolon and Gianello2011), the critical contents of K in southern Brazil were 2.3 mmolc kg−1 (Mehlich-1) and 2.0 mmolc kg−1 (ion exchange resin). In our study, for ion exchange resin, the critical soil K contents were 2.5 mmolc dm−3 without K reapplication and 2.7 mmolc dm−3 with K reapplication (Figure 7). The difference between the maximum yields obtained either with or without reapplication of K after the period of deprivation was 5%. Even under continuous K depletion, the soil still has mineral reserves of K. Recently, Moterle et al. (Reference Moterle, Kaminski, Rheinheimer, Caner and Bortoluzzi2016), Vieira et al. (Reference Vieira, Fontoura, Bayer, de Moraes, Carniel and Vieira2016) and Testoni et al. (Reference Testoni, Almeida, Silva and Andrade2017) have exposed the expressive importance of non-exchangeable K forms in highly weathered Oxisols from southern Brazil. The release of non-exchangeable K occurs when the K concentration is reduced close to the phyllosilicates. According to Rahmatullah and Mengel (Reference Rahmatullah and Mengel2000), the ion exchange resin can artificially perform this process by mirroring the plant roots. Therefore, the absence of drastic variation in yield due to K deprivation and the higher contents of K extracted by ion exchange resin, in comparison to Mehlich-1, reinforce the importance of non-exchangeable K forms in Oxisols.
Conclusions
It is important to take the K–Mg equilibrium into account in crops growing in highly weathered tropical soils, especially in agricultural areas that are not frequently fertilised with Mg or that receive high rates of K. The exchangeable contents of Ca and Mg in soil may be decreased after high K fertilisation rates. Even after 8 years under K deprivation, the contents of Ca and Mg in index leaves continue to vary depending on the K rates previously applied. These effects were not observed in grains, with Ca and Mg contents remaining the same in all K rates. The reapplication of K after the long-term deprivation did not affect Ca contents in soil, index leaves and grains. The reapplication of K changed the pattern of decrease in Mg contents in index leaves. It is critical to consider which extractant is used for K, Ca and Mg at the time of calculating the relationships between these nutrients because the ion exchange resin tends to extract more K than Mehlich-1 and less Ca than 1 M KCl. Therefore, the use of the ion exchange resin makes it necessary to re-establish optimal relations among K, Ca and Mg to soybean. The DRIS method has sufficient sensitivity to be used as an indicator of the nutritional status of soybean plants and interactions between K and Mg in soybean cultivated in humid tropical Oxisols. K application in Oxisols under K deprivation did not affect the absorption of micronutrients. The main effect of high K rates was the reduction of micronutrients contents in tissues, like B, due to increased soybean growth, but this effect does not seem to have any relation to yield changes. The critical soil K contents found for ion exchange resin were higher than those found for Mehlich-1 which are among the already established levels for soils in southern Brazil.
Acknowledgements
We thank the Brazilian Agricultural Research Corporation (Soybean National Center) by the concession of the experimental area, and the University of São Paulo (ESALQ-USP) for the assistance in this study.
Financial support
This study was funded by the São Paulo Research Foundation (grant #2015/18952-3). We also thank the Coordination for the Improvement of Higher Education Personnel (CAPES - Finance code 001).


