


INTRODUCTION
Atmospheric circulation has long been recognized as an important mechanism for modulating regional and global climate via moisture and energy exchanges (Hadley, Reference Hadley1735; Manabe, Reference Manabe1969). In recent decades, there has been a growing awareness of the major influence of various components of atmospheric circulation (e.g., monsoons, jet streams, and storm tracks) on Earth systems via the transport of mineral dust (Arimoto, Reference Arimoto2001; Ridgwell, Reference Ridgwell2002; Goudie and Middleton, Reference Goudie and Middleton2006; Bullard, Reference Bullard, Baddock, Bradwell, Crusius, Darlington, Gaiero and Gassó2016). Atmospheric dust particles are an important agent of climate change via a variety of physical and biogeochemical mechanisms, including direct effects on Earth's radiative balance (Kinne and Pueschel, Reference Kinne and Pueschel2001; Sokolik et al., Reference Sokolik, Winker, Bergametti, Gillette, Carmichael, Kaufman, Gomes, Schuetz and Penner2001), and iron fertilization effects that influence the oceanic carbon cycle and, in turn, atmospheric carbon dioxide concentration (Martin et al., Reference Martin, Coale, Johnson, Fitzwater, Gordon, Tanner and Hunter1994; Boyd et al., Reference Boyd, Watson, Law, Abraham, Trull, Murdoch and Bakker2000). The extensive dryland areas in central Asia, occupied by the Gobi and other deserts (Fig. 1a), are an extremely active dust source. Modern meteorological data and model simulations suggest that long-range atmospheric dust transport from the Asian interior has important effects on the regional climate and even global circulation (Zhang et al., Reference Zhang, Gong, Zhao, Arimoto, Wang and Zhou2003; Guo et al., Reference Guo, Lou, Miao, Wang, Zeng, Liu and He2017). Accordingly, improving our knowledge of variations in atmospheric circulation in the Asian interior during the geological past is important for understanding global climate changes.
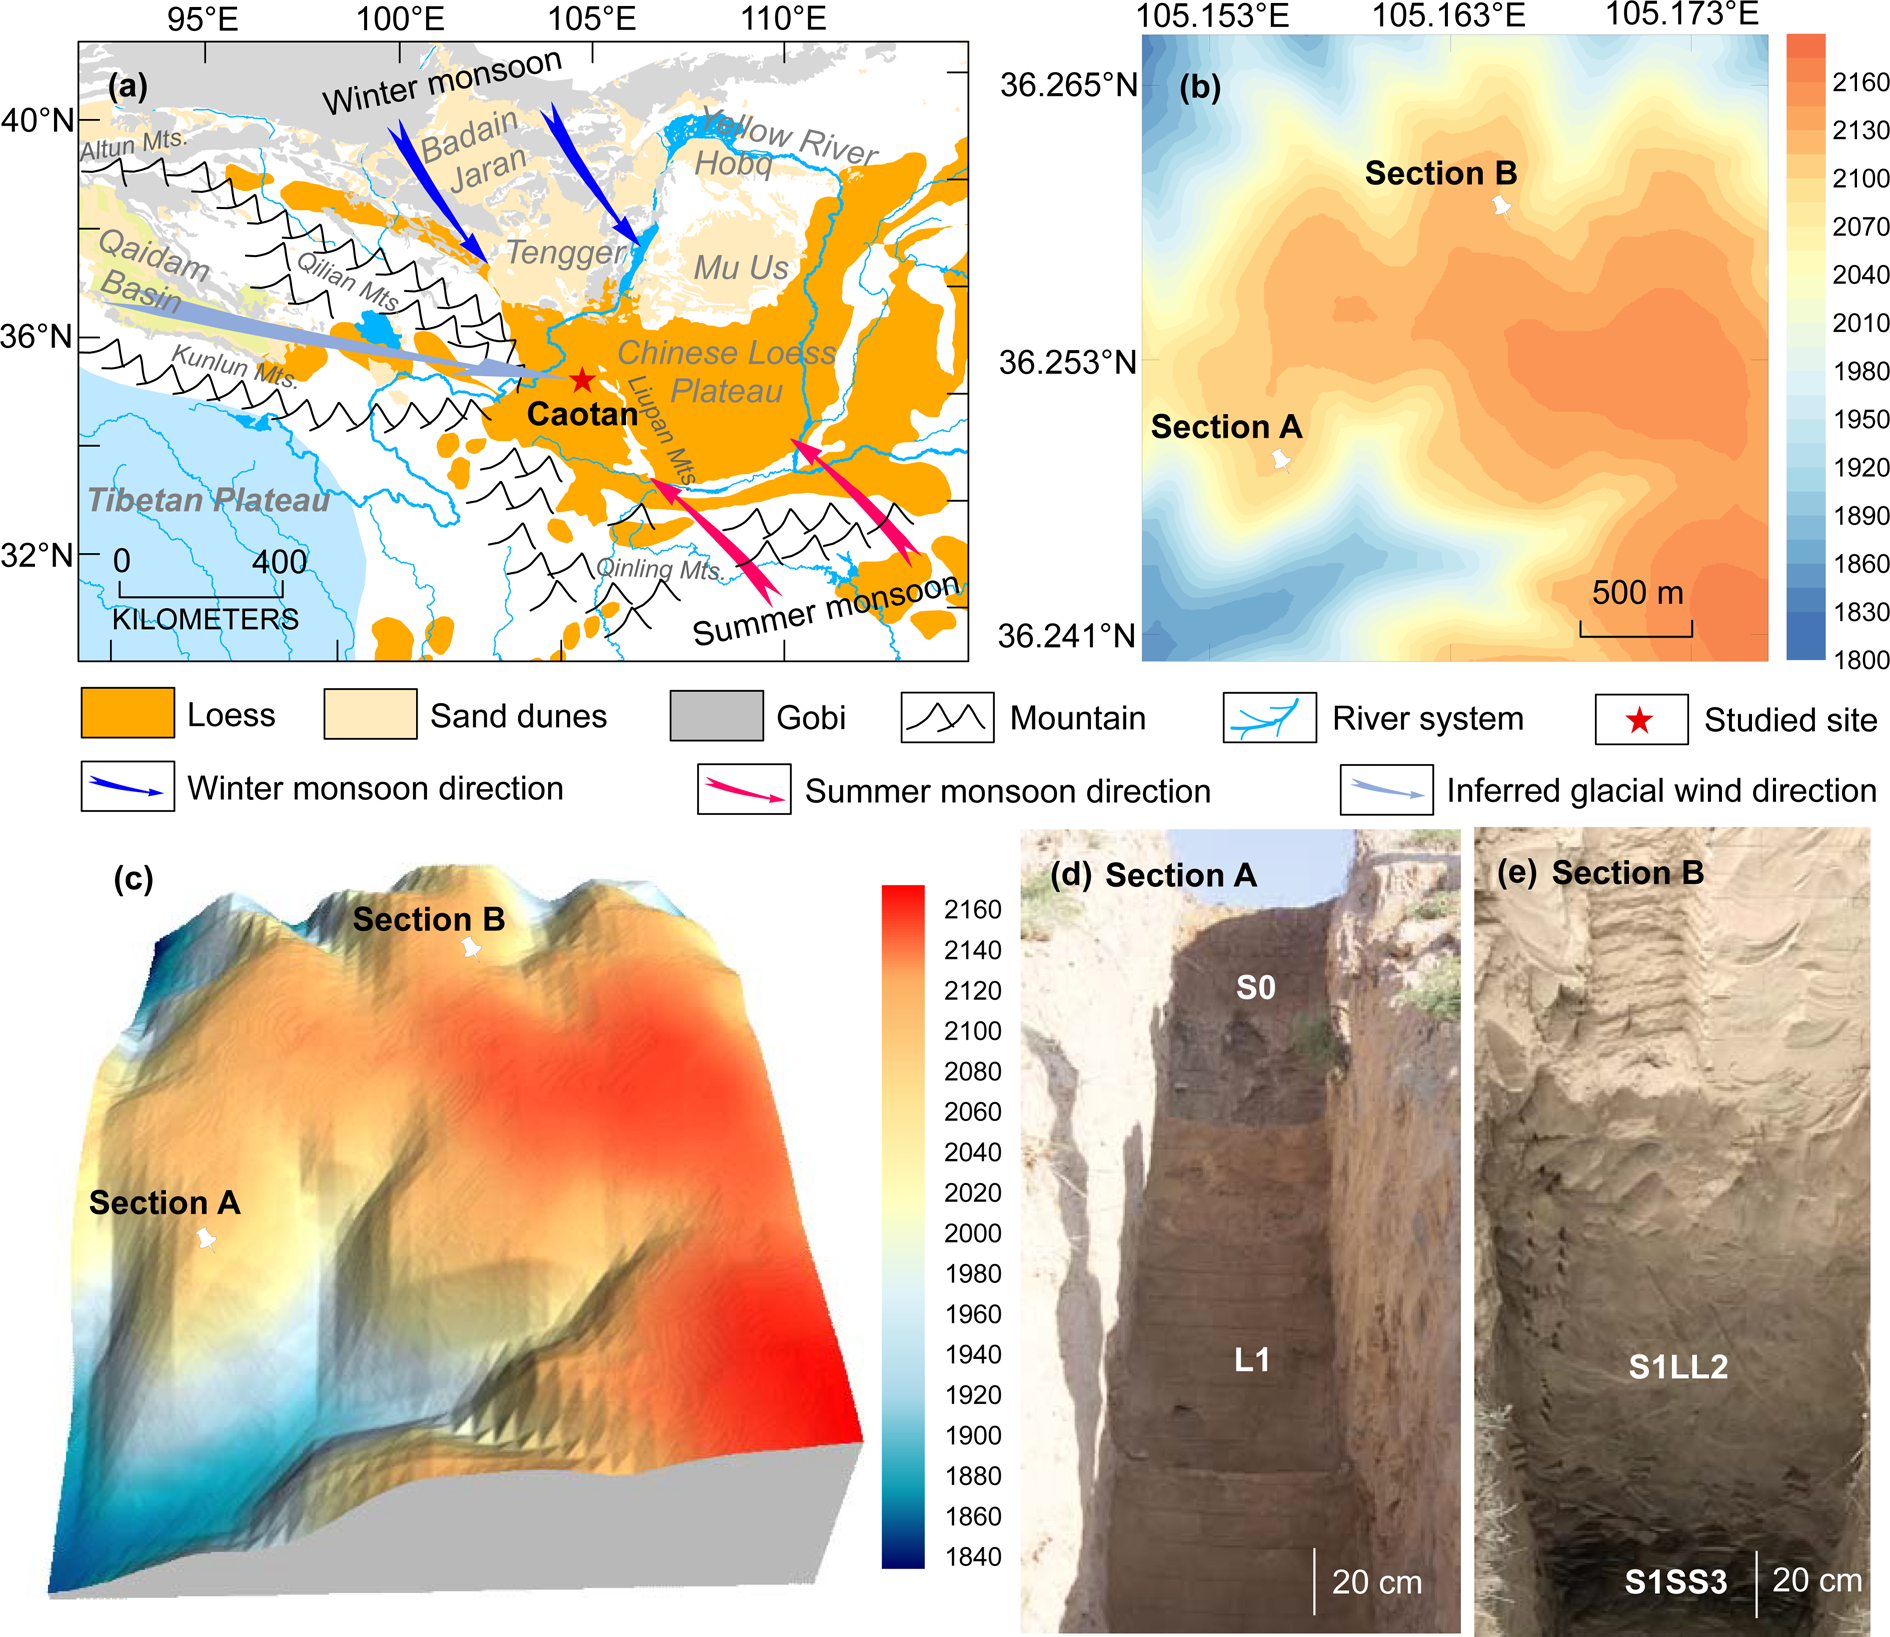
Figure 1. (color online) (a) Map showing study site in relation to the entire Chinese Loess Plateau, neighboring deserts, Gobi, basins, mountains, and river systems; arrows represent the approximate wind directions of the East Asian winter and summer monsoons and inferred glacial wind direction based on the provenance evidence of detrital zircon geochronology (Pullen et al., Reference Pullen, Kapp, McCallister, Chang, Gehrels, Garzione, Heermance and Ding2011). (b) Digital elevation model of Section A and Section B from the loess study site. Base map data downloaded at June 7, 2020 from https://maps.ngdc.noaa.gov/viewers/wcs-client. (c) Locations of loess sections A and B on a 3-D surface map with a same horizontal scale as (b). (d, e) Photographs of Section A and Section B. S0: the Holocene soil; L1: the last glacial loess; S1LL2: the second loess interlayer in the paleosol unit S1; S1SS3: the oldest soil interlayer in the paleosol unit S1.
The loess-paleosol sequences of the Loess Plateau of north-central China potentially provide an excellent geological record of atmospheric circulation of the Asian interior, which functions as a link within the source-to-sink system of Asian dust deposition (Liu, Reference Liu1985; Ding et al., Reference Ding, Derbyshire, Yang, Yu, Xiong and Liu2002; Guo et al., Reference Guo, Ruddiman, Hao, Wu, Qiao, Zhu, Peng, Wei, Yuan and Liu2002, Reference Guo, Sun, Zhang, Peng, Xiao, Ge and Hao2008; Lu et al., Reference Lu, Wang and Li2010; Sun et al., Reference Sun, Clemens, Morrill, Lin, Wang and An2012; Hao et al., Reference Hao, Wang, Oldfield, Peng, Qin, Song, Xu, Qiao, Bloemendal and Guo2012). Intensive geochronological studies of these sedimentary sequences, based mainly on magnetostratigraphy, have proposed an age of 22 Ma (Guo et al., Reference Guo, Ruddiman, Hao, Wu, Qiao, Zhu, Peng, Wei, Yuan and Liu2002, Reference Guo, Sun, Zhang, Peng, Xiao, Ge and Hao2008; Hao and Guo, Reference Hao and Guo2007) for the initiation of the inland desert in Asia and the formation of a modern-like atmospheric circulation system (Guo et al., Reference Guo, Ruddiman, Hao, Wu, Qiao, Zhu, Peng, Wei, Yuan and Liu2002, Reference Guo, Sun, Zhang, Peng, Xiao, Ge and Hao2008).
Sedimentary evidence from loess deposits in the central Loess Plateau east of the Liupan Mountains suggests that the prevailing winds responsible for the dust transport are the northwesterly winds of the East Asian winter monsoon. Based on detailed field surveys and laboratory measurements, Liu (Reference Liu1966) found a southeastward decrease in the grain size of loess deposits in the Eastern CLP, and accordingly, the thick loess deposits of the Loess Plateau were divided spatially from northwest to southeast into a sandy loess belt, a silty loess belt, and a clay loess belt. This pattern was verified by grain-size evidence from loess deposits spanning the past two glacial and interglacial cycles (Ding et al., Reference Ding, Sun, Rutter, Rokosh and Liu1999; Yang and Ding, Reference Yang and Ding2008). Similar patterns have also been observed in the spatial variations of the thickness of the Quaternary loess sequences of the Loess Plateau, which decrease gradually from ~450 m in the northwestern Loess Plateau to 100–180 m in the central area (Liu, Reference Liu1985; Lu and Sun, Reference Lu and Sun2000). The spatial variations of the grain size and thickness of the loess deposits depend mainly on the direction and intensity of the dust-transporting winds (Pye and Tsoar, Reference Pye and Tsoar1987). Therefore, the southeastward fining and thinning of the loess deposits suggests that the dust particles comprising the loess deposits in the main part of the CLP were transported by the northwesterly winter monsoon winds generated by the Siberian-Mongolian anticyclone (Wang, Reference Wang2006).
However, some recent provenance evidence, based mainly on the U-Pb geochronology of single zircon grains, was used to propose that the westerly winds, rather than East Asian winter monsoon winds, dominated the dust transport responsible for loess deposition during glacials (Pullen et al., Reference Pullen, Kapp, McCallister, Chang, Gehrels, Garzione, Heermance and Ding2011). Comparison of zircon U-Pb age spectra of loess samples from the CLP and of sand samples from various source regions revealed that the loess samples from the Loess Plateau and sand samples from the Qaidam Basin share similar age distribution patterns. Thus, Pullen et al. (Reference Pullen, Kapp, McCallister, Chang, Gehrels, Garzione, Heermance and Ding2011) proposed that the Qaidam Basin to the west of the CLP was the dominant source for dust contribution to the loess deposits, and that westerly winds have played a crucial role in transporting dust from western source areas towards the Loess Plateau during glacial and interstadial periods. In contrast, during interglacial periods, a different wind system, the northwest winds of the East Asia winter monsoon, were proposed as the dust-bearing winds (Pullen et al., Reference Pullen, Kapp, McCallister, Chang, Gehrels, Garzione, Heermance and Ding2011). Studies of wind erosion rates in the Qaidam Basin and the estimated volume of material removed by wind erosion also support the conclusion that the Qaidam Basin is a major source of dust to the CLP (Kapp et al., Reference Kapp, Pelletier, Rohrmann, Heermance, Russell and Ding2011; Rohrmann et al., Reference Rohrmann, Heermance, Kapp and Cai2013; Wu et al., Reference Wu, Prush, Lin, Xiao, Zhang, Chen, Yang and Chen2019). Although Licht et al. (Reference Licht, Pullen, Kapp, Abell and Giesler2016) ruled out the major dust contribution from the Qaidam Basin, they still stressed the influence of the westerly winds on dust transportation.
Using single geochemical tracers without considering related atmospheric circulation patterns may lead to misleading conclusions about dust provenance. The clastic materials of the Qaidam Basin originate mainly from the Kunlun and Qilian Mountains of the northeastern Tibetan Plateau (Wang et al., Reference Wang, Zheng, Zhang, Li, Kirby, Yuan and Zheng2017; Nie et al., Reference Nie, Ren, Saylor, Su, Horton, Bush, Chen and Pfaff2019; Fig. 1a). Recently, an increasing amount of geochemical evidence has shown that large-scale arid areas, which are major depositional areas of clastic materials of the northeastern Tibetan Plateau, have made a large contribution to the dust deposited in the CLP (Zhang et al., Reference Zhang, Lu, Xu, Liu, Yang, Stevens, Bird, Xu, Zhang, Lei and Feng2016; Li et al., Reference Li, Chen, Chen, Hedding, Li, Li and Liu2018; Bird et al., Reference Bird, Millar, Rodenburg, Stevens, Rittner, Vermeesch and Lu2020). Therefore, it is unsurprising that the zircon U-Pb age spectra of loess samples from the Loess Plateau and sand samples from the Qaidam Basin share some similar age peaks (Pullen et al., Reference Pullen, Kapp, McCallister, Chang, Gehrels, Garzione, Heermance and Ding2011); however, this does not mean that the Qaidam Basin was an important dust source for the CLP. Detailed reconstructions of paleowind directions can potentially resolve this issue. The western Loess Plateau (west of the Liupan Mountains) is closer to the Qaidam Basin than the rest of the plateau and is therefore well suited for evaluating the proposed role of westerly winds in transporting aeolian dust to the CLP. However, the limited area of loess distribution and complex topography of the western CLP hinder a systematic spatial analysis of sedimentary proxies such as grain size. As a result, there is a lack of paleowind evidence available from the western CLP.
The anisotropy of magnetic susceptibility (AMS), or magnetic fabric, is a useful approach for directly measuring paleowind directions from aeolian deposits. AMS is a physical property of sediments, reflecting differences in the magnetic susceptibility measured in different sample orientations, and it can be graphically expressed as a three-dimensional ellipsoid with maximum (κ max), intermediate (κ int), and minimum (κ min) axes of susceptibility (Ising, Reference Ising1943; Graham, Reference Graham1954). AMS is dominantly controlled by the preferred crystallographic and dimensional orientations of anisotropic magnetic minerals within a sample (Owens and Bamford, Reference Owens and Bamford1976; Hrouda, Reference Hrouda1982; Lowrie, Reference Lowrie and James1989; Rochette et al., Reference Rochette, Jackson and Aubourg1992). For windblown deposits such as loess, the preferred orientation of individual magnetic grains or grain clusters usually represents the prevailing direction of the dust-bearing winds. Therefore, the paleowind directions responsible for loess deposition can be determined directly by measuring the magnetic fabric. AMS measurements of loess samples from the CLP by Thistlewood and Sun (Reference Thistlewood and Sun1991) revealed that the magnetic fabric of loess and paleosol samples was characterized by a WNW–ESE orientation of the κ max axis, which suggested the East Asian winter monsoon winds were responsible for the dust transport. The relationship between the orientation of the κ max axis of the magnetic fabric of aeolian deposits and wind direction was further verified by laboratory wind-tunnel experiments (Wu et al., Reference Wu, Chen, Wang, Cao and Zhang1998). Extensive AMS studies have subsequently been conducted on the loess deposits of the CLP of northern China (Zhu et al., Reference Zhu, Liu and Jackson2004; Huang and Sun, Reference Huang and Sun2005; Wang et al., Reference Wang, Pan, Gao, Guan, Chen and Wang2007; Zhang et al., Reference Zhang, Kravchinsky, Zhu and Yue2010; Liu and Sun, Reference Liu and Sun2012; Ge et al., Reference Ge, Guo, Zhao, Zhang, Wang, Yi and Deng2014; Peng et al., Reference Peng, Ge, Li, Liu, Qi, Tan, Cheng, Deng and Qiao2015), Europe (Nawrocki et al., Reference Nawrocki, Polechońska, Boguckij and Łanczont2006, Reference Nawrocki, Gozhik, Łanczont, Pańczyk, Komar, Bogucki, Williams and Czupyt2018; Antoine et al., Reference Antoine, Goval, Jamet, Coutard, Moine, Hérisson and Auguste2014; Taylor and Lagroix, Reference Taylor and Lagroix2015; Zeeden et al., Reference Zeeden, Hambach and Händel2015; Bradák et al., Reference Bradák, Újvári, Seto, Hyodo and Végh2018), North America (Lagroix and Banerjee, Reference Lagroix and Banerjee2002, Reference Lagroix and Banerjee2004a, Reference Lagroix and Banerjeeb), and Siberia (Matasova et al., Reference Matasova, Petrovský, Jordanova, Zykina and Kapička2001).
In the present study, detailed AMS analyses were conducted on two thick loess profiles from Caotan town, Huining county, in Gansu Province (Fig. 1). Both profiles span marine isotope stages 1–5 (i.e., the past 130 ka) according to the Chinese loess Chiloparts time scale of Ding et al. (Reference Ding, Derbyshire, Yang, Yu, Xiong and Liu2002). Our specific aims were to reconstruct the paleowind direction responsible for the loess deposits of the western CLP, and to investigate temporal variations of paleowind direction on glacial–interglacial timescales.
SETTING AND SAMPLING
The two loess profiles investigated herein, Section A and Section B (Fig. 1b–e), are located in Caotan town, northern Huining County, at an elevation of ~2,100 m asl, ~150 km from the southernmost part of the Tengger Desert, in the western part of the CLP (Fig. 1a). Under the influence of the East Asian monsoon, the summer season in the study area is characterized by warm and moist conditions with a prevailing southeasterly wind (summer monsoon), while the winter season is characterized by cold and dry conditions with a prevailing northerly or northwesterly wind (winter monsoon). The mean annual precipitation and temperature at Huining are ~359 mm and ~7.7°C, respectively. The distance from Section A to Section B is ~1.5 km. Two parallel profiles were studied in order to ensure reliability of the results. Field observation revealed that both sections consist of an uppermost dark loamy soil (S0), a thick, yellow-orange loess layer (L1), and a pedocomplex (S1) (Fig. 1d); S1 can be subdivided into five layers: two less developed bright-brown soils in the upper part (S1SS1 and S1SS2), and one better developed dark-brown soil (S1SS3) in the lower part (Fig. 1e), interbedded with two orange loess beds (S1LL1 and S1LL2). The thicknesses of Section A and Section B are ~21.0 m and 24.3 m, respectively.
Block samples with dimensions 10 × 10 × 10 cm3 and oriented with a magnetic compass were collected from both sections. The sampling intervals for Section A were 5–10 cm for the upper 15 m (S0 and L1) and 2.5 cm for the lower 6 m (S1), and 415 oriented samples were collected. For Section B, 484 oriented samples were collected at a sampling interval of 5 cm. In the laboratory, cubic samples of 8 cm3 volume were cut from the block samples for AMS and magnetic susceptibility measurements.
METHODS
To identify the magnetic mineral assemblages of the studied loess deposits, temperature-dependent magnetic properties and hysteresis properties were measured on representative loess and paleosol samples collected from Section A and Section B. The high-temperature dependence of magnetic susceptibility was measured with an MFK1-FA multi-function Kappabridge with a CS4 high-temperature control unit. Approximately 0.3 g of powdered sample was heated from room temperature to 700°C, then cooled down to room temperature in an argon atmosphere. The magnetic susceptibility was measured in a field intensity of 200 Am−1 and a frequency of 976 Hz. Low-temperature thermal demagnetization of saturation isothermal remanent magnetization (LT-SIRM) measurements were conducted on a Quantum Designs Magnetic Properties Measurement System. After cooling to 15 K in zero field, SIRM was imparted in a field of 2.5 T. The sample was then warmed up to 300 K at a constant rate of 3 K/min, and the variation in remanence was measured repeatedly in a field-free space. First-Order Reversal Curve (FORC) measurements were performed on a MicroMag 3900 vibrating sample magnetometer (VSM 3900). 100 FORCs were measured with a maximum field of 1.0 T. The FORC data were processed using FORCinel software (Harrison and Feinberg, Reference Harrison and Feinberg2008).
The AMS of each oriented specimen was measured using an MFK1-FA multi-function Kappabridge instrument (Agico Ltd., Brno) with an automated sample handling system, at an operating frequency of 976 Hz and field intensity of 200 Am−1. Each sample was rotated through three orthogonal planes. The resulting AMS ellipsoid was calculated using the least-squares method, following Jelinek (Reference Jelinek1981). The anisotropy parameters used here are foliation (F), lineation (L), and the degree of anisotropy (P), and were calculated using Anisoft software based on the statistical methods of Jelinek (Reference Jelinek1981) and Constable and Tauxe (Reference Constable and Tauxe1990). The relevant calculations are: Foliation (F) = κ int/κ min; Lineation (L) = κ max/κ int; Degree of anisotropy (P) = κ max/κ min.
RESULTS
Magnetic susceptibility (κ)
Depth profiles of the volume magnetic susceptibility of Section A, Section B, and their correlations with the marine oxygen-isotope record (Lisiecki and Raymo, Reference Lisiecki and Raymo2005) are illustrated in Figure 2. Previous studies of the loess deposits in the western CLP have established a robust scheme of correlations between loess units and the sequence of marine isotope stages (MIS) (Ding et al., Reference Ding, Derbyshire, Yang, Yu, Xiong and Liu2002; Sun and Huang, Reference Sun and Huang2006). As expected, the soil layers are characterized by higher κ values and loess layers by lower values (Fig. 2a, c). The κ records for the two sections can be correlated peak by peak; four prominent peaks corresponding to S0, S1SS1, S1SS2, and S1SS3 can be readily correlated with warmer intervals MIS 1, MIS 5a, MIS 5c, and MIS 5e of the marine oxygen isotope record (Fig. 2). Both field observations and the κ records indicate that the strongly developed soil layer S1SS3 formed during MIS 5e.

Figure 2. Variation of the volume-specific magnetic susceptibility (κ) as a function of depth for loess sections A and B and its correlation with the LR04 benthic δ18O stack marine isotope stages (MIS) of Lisiecki and Raymo (2005). S0: the Holocene soil; L1: the last glacial loess; S1: the last interglacial soil; S1SS1, S1SS2, and S1SS3: the youngest, second, oldest subsoil interlayers in the paleosol unit S1, respectively; S1LL1, and S1LL2: the first, and second loess interlayer in the paleosol unit S1, respectively.
Magnetic mineralogy
The heating curves of the high-temperature dependence of magnetic susceptibility (χ) are shown in Figure 3. Overall, the loess and paleosol samples showed a similar pattern: below ~280°C there was a steady rise in the χ, which is likely due to the gradual unblocking of fine-grained single domain (SD) particles (Deng et al., Reference Deng, Zhu, Verosub, Singer and Yuan2000; Liu et al., Reference Liu, Deng, Yu, Torrent, Jackson, Banerjee and Zhu2005), and from ~280°C to ~440°C, the reduction in χ primarily originated from the conversion of metastable maghemite to hematite (Deng et al., Reference Deng, Zhu, Verosub, Singer and Yuan2000, Reference Deng, Vidic, Verosub, Singer, Liu, Shaw and Zhu2005; Zhao et al., Reference Zhao, Sun and Qiang2017; Gao et al., Reference Gao, Hao, Oldfield, Bloemendal, Deng, Wang and Song2019). The susceptibility loss is more prominent in the paleosol samples than in the loess samples, suggesting a higher content of fine-grained pedogenic maghemite particles in the former. Notably, the susceptibility hump at ~510°C is commonly attributed to the neoformation of magnetite from iron-bearing silicates during heating (Deng et al., Reference Deng, Zhu, Verosub, Singer and Yuan2000; Liu et al., Reference Liu, Deng, Yu, Torrent, Jackson, Banerjee and Zhu2005), which is confirmed by the significantly enhanced susceptibility after cooling to room temperature in the cooling curves (not shown). At ~585°C, the sharp decrease in χ corresponds to the Curie point of nearly stoichiometric magnetite.
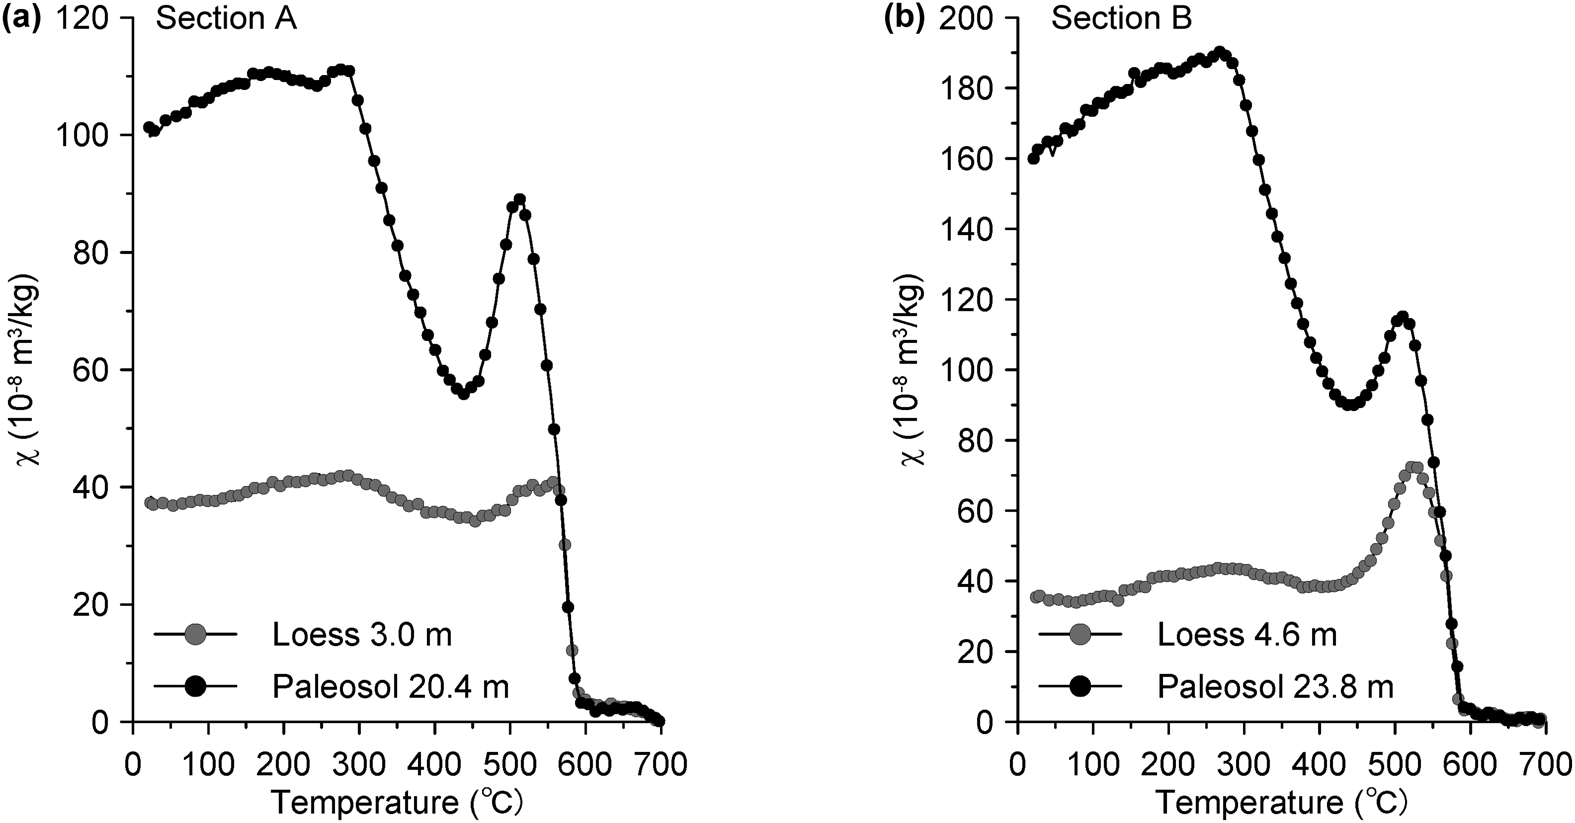
Figure 3. Heating curves of the temperature-dependence of magnetic susceptibility of representative loess and paleosol samples.
LT-SIRM warming curves for the selected loess and paleosol samples are shown in Figure 4. An abrupt drop in the intensity of remanence at ~120 K is evident in the loess samples (Fig. 4a, b), consistent with the normalized first-order derivative of LT-SIRM curves (Fig. 4c, d), which indicates the Verwey transition of the nearly stoichiometric magnetite (Rochette et al., Reference Rochette, Fillion, Mattéi and Dekkers1990; Özdemir et al., Reference Özdemir, Dunlop and Moskowitz1993). The paleosol samples show a much less marked Verwey transition at ~120 K, as in this case, the detrital coarse magnetic grains are usually masked by fine-grained pedogenic ferrimagnets and the low-temperature oxidation of coarse-grained magnetite (Banerjee et al., Reference Banerjee, Hunt and Liu1993).

Figure 4. Low-temperature thermal demagnetization of saturation isothermal remanent magnetization (LT-SIRM) acquired in 2.5 T at 15 K (a, b) and normalized first-order derivative of LT-SIRM curves (c, d) for representative loess and paleosol samples.
The FORC diagrams of the loess and paleosol samples are shown in Figure 5. The divergent outer contours for the loess samples indicate the presence of coarse-grained pseudo-single domain (PSD) or multidomain (MD) particles (Muxworthy and Dunlop, Reference Muxworthy and Dunlop2002; Smirnov, Reference Smirnov2006; Roberts et al., Reference Roberts, Heslop, Zhao and Pike2014), consistent with the low-temperature magnetic properties (Fig. 4). In contrast, the paleosol samples are characterized by tightly closed inner contours with negligible vertical spread, indicating the presence of magnetically non-interacting SD particles. Additionally, the observed secondary peaks at the origin of the FORC diagram indicate the presence of superparamagnetic (SP) particles (Pike et al., Reference Pike, Roberts, Dekkers and Verosub2001; Roberts et al., Reference Roberts, Pike and Verosub2000). Fine-grained SP and SD particles in paleosol layers have been demonstrated to originate mainly from neo-formed maghemite during pedogenesis (Zhou et al., Reference Zhou, Oldfield, Wintle, Robinson and Wang1990; Maher and Thompson, Reference Maher and Thompson1991; Verosub et al., Reference Verosub, Fine, Singer and TenPas1993), which is in accordance with our thermomagnetic results (Fig. 3). This suggests a higher maghemite content in the paleosol samples.

Figure 5. (color online) First-Order Reversal Curve (FORC) diagrams for representative loess and paleosol samples collected from Section A (a, b) and Section B (c, d). Loess samples show divergent outer contours, indicating coarse-grained pseudo-single domain (PSD) or multidomain (MD) particles (Muxworthy and Dunlop, Reference Muxworthy and Dunlop2002; Smirnov, Reference Smirnov2006; Roberts et al., Reference Roberts, Heslop, Zhao and Pike2014). Paleosol samples show tightly closed inner contours with negligible vertical spread, indicating the presence of magnetically non-interacting SD particles. Secondary peaks at the origin indicate presence of superparamagnetic (SP) particles (Pike et al., Reference Pike, Roberts, Dekkers and Verosub2001; Roberts et al., Reference Roberts, Pike and Verosub2000). SF: smoothing factor; higher SFs were used for the loess samples to enhance the signal to noise ratio.
In summary, our rock magnetic investigations revealed that magnetic assemblages of loess samples mainly consist of detrital coarse-grained PSD or MD magnetite. For paleosol samples, both the pedogenic fine-grained SP and SD maghemite and the detrital coarse-grained PSD or MD magnetite dominate the magnetic assemblages.
Anisotropy of magnetic susceptibility (AMS)
The anisotropy parameters ɛ12 and F12 have been widely used to evaluate the statistical significance of AMS data (Zhu et al., Reference Zhu, Liu and Jackson2004; Lagroix and Banerjee, Reference Lagroix and Banerjee2004b), where the notations 1 and 2 of these parameters are assigned to the maximum susceptibility axis (κ max) and the intermediate susceptibility axis (κ int), respectively. At the specimen level, ɛ12 is defined as the half-angular uncertainty of κ max within the magnetic foliation plane, and represents the 95% confidence uncertainty ellipse of κ max. The maximum allowable statistically significant ɛ12 is 22.5°, yielding a confidence ratio of 1.0 (Lagroix and Banerjee, Reference Lagroix and Banerjee2004b). In addition, anisotropy data with F12 > 4 are statistically significant (Zhu et al., Reference Zhu, Liu and Jackson2004). The AMS data (Fig. 6a, b) show that the results are statistically significant. Specimens with ɛ12 < 22.5° and F12 > 4 account for 80.2% and 50.6% of the total data in Section A and Section B, respectively.

Figure 6. Statistical significance, angular uncertainties, and relationships between the anisotropy of magnetic susceptibility (AMS) parameters of the loess profiles of Section A (top; a, c, e, g) and Section B (bottom; b, d, f, h). The AMS data in (a, b) show results are statistically significant. Gray shading indicates plots with ɛ12 > 22.5° and F12 < 4. Insets in (c, d) are frequency distributions of ɛ12 using a 1° bin size. Both sections show stronger positive correlations between the degree of anisotropy P and magnetic foliation F (e, f). Data for most samples are close to the foliation axes, indicating an oblate AMS ellipsoid (g, h). Magnetic lineation: L.
In general, Section A and Section B have comparable AMS characteristics. Inverse relationships between ɛ12 and the magnetic lineation (L) are evident (Fig. 6c, d), which can be attributed to the increase in random measurement errors for κ max in the lineation plane with weak lineation. Both sections show stronger positive correlations between the degree of anisotropy P and magnetic foliation F (Fig. 6e, f), which suggests that the anisotropy is mainly controlled by the magnetic foliation. Data for almost all of the specimens are close to the foliation axes, consistent with previous studies of the AMS of loess deposits, indicating an oblate AMS ellipsoid for the specimens (Fig. 6g, h).
Stereographic projections of all specimens from Section A and Section B are plotted in Figures 7 and 8, respectively. The orientation of κ max and κ min are described by the declination (Dec-κ max and Dec-κ min), and the inclination (Inc-κ max and Inc-κ min). For Section A and Section B, specimens with Inc-κ min > 70° account for 72.0% and 72.9% of the total number of specimens, respectively, indicating a primary aeolian magnetic fabric without significant post- depositional disturbance (Figs. 7, 8).

Figure 7. Lower hemisphere equal-area stereographic projections of AMS data from loess and paleosol units of Section A. (a) AMS results for all specimens. (b) AMS results with ɛ12 > 22.5° and Inc-κ min < 70° excluded. S0: the Holocene soil; L1: the last glacial loess; S1: the last interglacial soil. For each dataset, the stereonet on the left shows the AMS data for the principal susceptibility axes, κ max (blue squares), κ int (green triangles), and κ min (red dots). The stereonet on the right shows contours and rose diagrams for for the AMS data for the principal susceptibility axis, κ max. (For interpretation of the references to color in this figure legend, the reader is referred to the web version of this article.)

Figure 8. Lower hemisphere equal-area stereographic projections of AMS data from loess and paleosol units of Section B. (a) AMS results for all specimens. (b) AMS results with ɛ12 > 22.5° and Inc-κ min < 70° removed. S0: the Holocene soil; L1: the last glacial loess; S1: the last interglacial soil. For each dataset, the stereonet on the left shows the AMS data for the principal susceptibility axes, κ max (blue squares), κ int (green triangles), and κ min (red dots). The stereonet on the right shows contours and rose diagrams for the AMS data for the principal susceptibility axis, κ max. (For interpretation of the references to color in this figure legend, the reader is referred to the web version of this article.)
To better understand possible variations in paleowind variations between glacial and interglacial cycles, each section was divided into three units: Holocene soil (S0), last glacial loess (L1), and last interglacial soil (S1). To improve the statistical significance of the principal orientations, specimens with ɛ12 > 22.5° and Inc-κ min < 70° were removed, following Lagroix and Banerjee (Reference Lagroix and Banerjee2004b). Along with the stereographic projections, contour lines and rose diagrams are used to illustrate the distribution of κ max. For each unit, the changes in orientation distributions between the initial dataset (Figs. 7a, 8a) and the selected dataset with ɛ12 > 22.5° and Inc-κ min < 70° removed are shown (Figs. 7b, 8b).
For Section A, the stereographic projections for all specimens show that the κ max is distributed along the NW–SE direction, and that κ min forms a tight cluster around the vertical (Fig. 7a). The NW–SE directions of the κ max declinations are more evident in the contour and rose diagrams (Figs. 7a, b). The stereographic projections of the selected specimens with ɛ12 < 22.5° and Inc-κ min > 70° show similar characteristics (Fig. 7b). Unit S0 has a random distribution of κ max and κ min axes. For unit L1, the κ max declination is mainly distributed in the NW, NE, and SE regions, the majority of the κ max values are oriented along the NE–SW direction (Dec-κ max = 328.6°), and κ min values are clustered around the vertical (Fig. 7b; Table 1). The specimens from paleosol S1 also show a preferential alignment of κ max along NW–SE direction (Dec-κ max = 150.6°) (Fig. 7b; Table 1). The κ min inclinations are tightly vertical without significant deviation.
Table 1. Principal AMS orientation analysis. (a) Samples with ɛ12 > 22.5° and Inc-κ min < 70° included; (b) Samples with ɛ12> 22.5° and Inc-κ min< 70° removed. S0: the Holocene soil; L1: the last glacial loess; S1: the last interglacial soil. Abbreviations: n = sample number; Dec. = declination; Inc = inclination; Max. = maximum angles of the 95% confidence ellipse; Min = minimum angles of the 95% confidence ellipse.

For Section B, the stereographic projections for all specimens show that the majority of κ max directions are oriented along the NNW–SSE direction, and the κ min inclinations are scattered around the vertical axis (Fig. 8). The specimens from paleosol S0 have highly scattered κ max declinations and κ min inclinations, which are not suited for further analysis. For unit L1, the κ max directions are distributed along a girdle, oriented towards the NW–EW direction (Dec-κ max = 347.5°). The preferred orientations of κ max for the loess units from Section A and Section B are close to each other (Dec-κ max = 328.6° for Section A; Dec-κ max = 347.5° for Section B). The κ max directions of paleosol S1 are also biased towards NW–SE (Dec-κ max = 319.8°).
DISCUSSION
Evidence from theoretical calculations, laboratory wind-tunnel experiments, and the analysis of sedimentary deposits demonstrate that the primary aeolian fabric of loess deposits is an effective tool for determining the prevailing directions of the dust-bearing winds (Hrouda, Reference Hrouda1982; Rochette et al., Reference Rochette, Jackson and Aubourg1992; Wu et al., Reference Wu, Chen, Wang, Cao and Zhang1998; Lagroix and Banerjee, Reference Lagroix and Banerjee2002). Although extensive AMS studies have been carried out on the loess deposits of the CLP during the past two decades, no consensus exists regarding the wind system responsible for the formation of the magnetic fabric of the loess deposits.
Three wind systems have been proposed to be responsible for the formation of the magnetic fabric of the loess deposits of the CLP: the northwesterly winter monsoon, the southeasterly summer monsoon, and the near-surface winds of the East Asian winter monsoon. The AMS study of Thistlewood and Sun (Reference Thistlewood and Sun1991) revealed a NW–SE orientation of the κ max axes, which is roughly parallel to the direction of the East Asian winter monsoon. Accordingly, the northwesterly winter monsoon was suggested to be the prevailing wind responsible for the formation of the magnetic fabric of the loess deposits. Zhang et al. (Reference Zhang, Kravchinsky, Zhu and Yue2010) found that the Inc-κ min values of the AMS of three loess sections in the CLP (Baicaoyuan, Xifeng, and Yichuan) were all oriented towards the NW. They proposed that during rainy periods, the East Asian summer monsoon would result in the rearrangement and fixation of magnetic particles, and as a result, the summer monsoon was responsible for the formation of the magnetic fabric of the loess deposits. Zhu et al. (Reference Zhu, Liu and Jackson2004) observed that the dominant directions of Dec-κ max of the AMS of the Lingtai loess section were oriented towards the NE during glacial periods, and toward the NW during interglacial periods. Considering the geographical location of the Lingtai section, close to the Liupan Mountains, Zhu et al. (Reference Zhu, Liu and Jackson2004) speculated that the direction of the winter monsoon of the study area might be influenced by the surrounding mountains. Ge et al. (Reference Ge, Guo, Zhao, Zhang, Wang, Yi and Deng2014) conducted detailed AMS studies of 10 loess sections of the last glacial period in the CLP, and their results showed that directions of Dec-κ max were roughly consistent with the directions of the regional surface wind flow, including not only the northwesterly wind related to the large-scale east Asian winter monsoon but also with local winds, which are strongly influenced by regional topography, and concluded both winds are responsible for the formation of the magnetic fabric of the loess deposits.
With these previous studies in mind, it is reasonable to conclude that the magnetic fabric of the loess deposits used in our study, especially the loess units, is mainly generated by large-scale atmospheric circulation. The Caotan site is located in the northwestern CLP (Fig. 1a), near the modern northern limit of the East Asian summer monsoon, and loess deposits in this region have experienced a relatively low degree of pedogenesis compared with other regions of the CLP. Our field investigations showed that the loess layers in the area are characterized by a loose structure, light color, and coarse grain size, which indicates a low degree of pedogenic alteration. This conclusion was verified by our rock magnetic analyses, which revealed that the magnetic assemblage of the loess units mainly consists of coarse-grained PSD or MD particles (Figs. 4, 5). The weak pedogenic development of the loess layers indicates the limited influence of monsoon rainfall on the formation of the magnetic fabric. Our study area is also located in the northernmost part of the Liupan Mountains, and the limited elevation and size of the adjacent mountains do not significantly affect the direction of the large-scale atmospheric circulation. Finally, the loess landforms in Caotan town are mainly ‘Yuan-type,’ which are characterized by an extensive flat surface (Fig. 1). The loess deposits in Yuan-type landforms with horizontal bedding are usually conducive to settlement and preservation of dust particles, and, in turn, to the formation of a magnetic fabric without significant disturbance. Therefore, it is reasonable to conclude that the magnetic fabric of the loess deposits of the Caotan sections is mainly produced by large-scale atmospheric circulation, which is responsible for the dust transport.
Due to pedogenic processes, the environmental interpretation of the AMS for the paleosol layers alternating within the loess layers seems more complex. It has been suggested that enhanced weathering and maghemitization decreases the anisotropy degree, and also scatters anisotropy directions (Mathé et al., Reference Mathé, Rochette and Colin1997). In the studied area, our field observations found that the paleosol layers in sections A and B are mostly characterized by having a bright- to dark-brown color with granular structure, indicating relatively stronger pedogenesis during interglacials with enhanced monsoon rainfall and ambient temperature (Liu, Reference Liu1985). Our rock magnetic results also indicate an increased concentration of pedogenic fine-grained (SP+SD) maghemite in paleosol samples (Figs. 3, 5). There is also a relatively lower degree of anisotropy (P) in the paleosol layers (S0 and S1) as compared to that of the coupled loess layers (Fig. 9), possibly indicating disturbance from the pedogenic processes. These observations indicate that magnetic fabrics of paleosol layers were possibly influenced by the process of soil formation. However, no significant difference was observed in the mean orientations of AMS axes between the last glacial loess (L1) and the last interglacial soil (S1) in both sections (Figs. 7, 8), possibly suggesting inheritance of the primary depositional fabric of the paleosol layers. The noticeable Verwey transition of the paleosol samples (Fig. 4) also robustly demonstrates the presence of primary coarse-grained magnetite. Given these observations, paleosols of the study area likely have a composite fabric of depositional and pedogenic fabrics. The scattered anisotropy directions of the Holocene soil (S0) in both sections possibly resulted from a lower degree of consolidation and disturbance from ancient human activities. Other studies proposed that the primary aeolian magnetic fabric of loess deposits could also be influenced by post-depositional processes (Hrouda, Reference Hrouda1982; Ellwood, Reference Ellwood1984; Tarling and Hrouda, Reference Tarling and Hrouda1993; Hus, Reference Hus2003), such as compaction, freeze-thaw cycles, post-depositional deformation (Lagroix and Banerjee, Reference Lagroix and Banerjee2004a), and hydromorphic processes (Taylor and Lagroix, Reference Taylor and Lagroix2015). Therefore, great caution is needed when interpreting the magnetic fabrics of paleosol units in paleowind investigations.

Figure 9. (color online) Plot of magnetic susceptibility (κ) versus degree of anisotropy (P) for loess deposits in (a) Section A and (b) Section B. A lower degree of anisotropy in paleosol layers S0-the Holocene soil and S1-the last interglacial soil than that in the coupled loess layers (L1-the last glacial loess) may indicate a disturbance from the pedogenic processes, and that magnetic fabrics of paleosol layers may have been influenced by the process of soil formation.
In terms of paleowind directions of loess layers, our AMS results for two parallel loess profiles show that in both sections, Dec-κ max of the magnetic fabrics is preferentially distributed along the NW–SE direction (Figs. 7, 8). A previous AMS study of the loess deposits of the nearby BCY section (Huang and Sun, Reference Huang and Sun2005; Fig. 10) also revealed a significant NW–SE orientation of Dec-κ max, and similar AMS results were reported for the last glacial loess units of the XN section, which is located in the westernmost Loess Plateau (Ge et al., Reference Ge, Guo, Zhao, Zhang, Wang, Yi and Deng2014; Fig. 10). The NW–SE orientation of Dec-κ max of the magnetic fabric of the loess deposits is nearly parallel to the modern prevailing winter and summer monsoon wind directions (Fig. 1a). Modern meteorological observations show that the southeasterly East Asian summer monsoon is mainly responsible for the moisture and heat delivery during summer, and the northwesterly East Asian winter monsoon is mainly responsible for the generation of modern dust storms and dust transportation during winter (Wang, Reference Wang2006). Therefore, the present AMS results indicate that the dominant wind system responsible for the dust supplied to and deposited within the western Loess Plateau is the East Asian winter monsoon, with a prevailing NW direction.

Figure 10. Paleowind directions derived from magnetic fabrics of loess sections from the Chinese Loess Plateau. Blue (AMS-derived mean paleowinds for L1-the last glacial loess) and red (AMS-derived mean paleowinds for S1-the last interglacial soil) arrows denote the mean direction of Dec-κ max in the foliation plane and shaded areas denote the confidence angle. AMS results for various sections are: LJP (Liujiapo) section (Thistlewood and Sun, Reference Thistlewood and Sun1991); YL (Yulin) section (Sun et al., Reference Sun, Ding and Liu1995); LT (Lingtai) section (Zhu et al., Reference Zhu, Liu and Jackson2004); BCY (Baicaoyuan) section (Huang and Sun, Reference Huang and Sun2005); XF (Xifeng) and YC (Yichuan) sections (Zhang et al., Reference Zhang, Kravchinsky, Zhu and Yue2010); XN (Xining) section (Ge et al., Reference Ge, Guo, Zhao, Zhang, Wang, Yi and Deng2014); CT (Caotan) section (this study). (For interpretation of the references to color in this figure legend, the reader is referred to the web version of this article.)
The paleowind direction inferred from AMS studies in the western CLP is in striking contrast with the conclusions based on the U-Pb geochronology of single zircon grains from the Qaidam Basin (Pullen et al., Reference Pullen, Kapp, McCallister, Chang, Gehrels, Garzione, Heermance and Ding2011). Pullen et al. (Reference Pullen, Kapp, McCallister, Chang, Gehrels, Garzione, Heermance and Ding2011) suggested that westerly winds dominated dust transport in the CLP during glacial periods, and that the loess deposits of the CLP were largely derived from the Qaidam Basin to the west. However, an increasing amount of geochemical evidence has led to the questioning of the role of the Qaidam Basin as a main source of dust supply to the CLP, and placed more emphasis on the contribution of aeolian dust from the northeastern Tibetan Plateau (TP), which is commonly defined as the region bounded by the Kunlun Mountains to the south and the Altun and the Qilian Mountains to the north (Fig. 1). Although the Qaidam Basin contains clastic materials from the southern Qilian and Kunlun Mountains (Wang et al., Reference Wang, Zheng, Zhang, Li, Kirby, Yuan and Zheng2017; Nie et al., Reference Nie, Ren, Saylor, Su, Horton, Bush, Chen and Pfaff2019), which are portions of the northeastern TP, it was not an actual dust source for the loess deposits of the CLP. Based on zircon grain ages, Che and Li (Reference Che and Li2013) argued that the contribution of aeolian dust from the Qaidam Basin to the main part of the Loess Plateau was negligible, and instead, a mixed contribution of materials from the northeastern TP and the Altay Mountains was suggested as the primary source of the loess deposits of the CLP. Based on a larger dataset of U-Pb ages and a new mixture-modeling statistic technique, Licht et al. (Reference Licht, Pullen, Kapp, Abell and Giesler2016) suggested that the contribution of dust from the Qaidam Basin to loess deposits on the CLP was no more than 20%. Zhang et al. (Reference Zhang, Lu, Xu, Liu, Yang, Stevens, Bird, Xu, Zhang, Lei and Feng2016) further revealed that the Tengger Desert and Mu Us sand dune field, combined with the northeastern TP, dominate the sediments of the CLP. A similar conclusion regarding dust contribution from the TP was also reached from recent analyses of Sr, Nd, and Hf isotopes (Bird et al., Reference Bird, Millar, Rodenburg, Stevens, Rittner, Vermeesch and Lu2020). Thus, the contribution of eolian dust from the Qaidam Basin to the CLP was overestimated in Pullen et al. (Reference Pullen, Kapp, McCallister, Chang, Gehrels, Garzione, Heermance and Ding2011).
The topography of the Qaidam Basin also militates against its role as an important dust source for the CLP. The Qaidam Basin is bounded on the south by the towering Kunlun Mountains, with numerous peaks in the western area exceeding 5000 m asl; and in the north and east by the Altun and Qilian mountain systems with many peaks exceeding 4500 m asl (Fig. 1a). The minimum difference in the relative elevation between the Qaidam Basin (average elevation 2400–3000 m) and the surrounding mountains is ~1500 m. As pointed out by Tsoar and Pye (Reference Tsoar and Pye1987) and Pye and Zhou (Reference Pye and Zhou1989), the dust transport responsible for the formation of the loess deposits of the Loess Plateau occurs mainly in the lower 1500 m of the atmosphere. Thus, a large amount of the dust produced in the Qaidam Basin cannot be transported across the surrounding mountains by low-altitude winds and deposited on the Loess Plateau. The aeolian materials crossing these mountains are much finer-grained, and they are more likely to be part of the long-range dust component transported to the North Pacific by high-level (> 3000 m) westerly circulation (Gong et al., Reference Gong, Xie, Wang, Zhang, Zhang and Yang2017; Nie et al., Reference Nie, Pullen, Garzione, Peng and Wang2018; Sun et al., Reference Sun, Yan, Nie, Li, Shi, Qiang, Chang and An2020). Therefore, based on atmospheric circulation patterns and geographical characteristics, the role of the Qaidam Basin as a major source of aeolian dust in the CLP can be excluded.
On glacial–interglacial timescales, the U-Pb geochronological evidence from the Qaidam Basin (Pullen et al., Reference Pullen, Kapp, McCallister, Chang, Gehrels, Garzione, Heermance and Ding2011) also suggested that the prevailing dust-bearing wind direction shifted to the northwest during interglacial periods, different from the direction during glacial and interstadial periods. Our AMS results from the paleosol units in both Section A and Section B show magnetic lineation directions intensively oriented along a NW–SE direction, consistent with the AMS results of the loess units (Figs. 7, 8). Similar AMS results were also reported for the nearby BCY section over the past 130 ka (Huang and Sun, Reference Huang and Sun2005). These observations therefore suggest that the prevailing wind responsible for dust transport of the loess deposits in the western Loess Plateau is relatively stable on glacial–interglacial timescales.
For the eastern CLP, much sedimentary and AMS evidence also suggests that the northwesterly winds of the East Asian winter monsoon were the dominant transport mechanism for the loess deposits in north-central China. This inference has been confirmed by evidence of the fining of the aeolian grain size (Liu, Reference Liu1985; Ding et al., Reference Ding, Sun, Rutter, Rokosh and Liu1999; Yang and Ding, Reference Yang and Ding2008), a decrease in dust sedimentation rates (Lu and Sun, Reference Lu and Sun2000), and the thinning of loess deposits (Wang et al., Reference Wang, Wu, Kou, Oliver, Mou and Ge2010) from northwest to southeast in the main part of the Loess Plateau. In addition, spatial variations in loess grain size from the past two glacial and interglacial cycles in the eastern Loess Plateau presented in Yang and Ding (Reference Yang and Ding2008) showed a near NW–SE gradient for both glacials and interglacials, also indicating a stable dust-transport pathway for the loess deposits in the CLP. Earlier AMS studies of the loess deposits of the LJP, YL, XF, and YC sections (see Fig. 10 for abbreviations and locations) also revealed a preferred orientation of Dec-κ max along the NW–SE direction (Thistlewood and Sun, Reference Thistlewood and Sun1991; Sun et al., Reference Sun, Ding and Liu1995; Zhang et al., Reference Zhang, Kravchinsky, Zhu and Yue2010), which confirms the dominant role of the winter monsoon in transporting aeolian dust to the CLP. Recent AMS studies of the Neogene red clay sequences spanning from 7.0–2.6 Ma in the Lingtai section, and 11.0–2.6 Ma in the Shilou section, revealed that the Dec-κ max of the magnetic fabrics are grouped in the NW quadrant (Gong et al., Reference Gong, Zhang, Yue, Zhang and Li2015), which likely indicates that the northwesterly winter monsoon played the dominant role in the transport of the dust even for pre-Quaternary aeolian deposits despite glacial and interglacial variations.
In summary, both the AMS results and independent sedimentary evidence indicate that for the entire CLP, the prevailing winds responsible for dust transport are the northwesterly winds of the East Asian winter monsoon during both glacial and interglacial intervals. Theoretically, the main sources of aeolian deposits are usually located in the upwind direction of the dust sink regions (e.g., the Chinese Loess Plateau). Our AMS results therefore imply that large areas of deserts and Gobi deserts (Liu, Reference Liu1985; Sun, Reference Sun2002; Sun et al., Reference Sun, Yan, Nie, Li, Shi, Qiang, Chang and An2020), as well as Yellow River sediments (Nie et al., Reference Nie, Stevens, Rittner, Stockli, Garzanti, Limonta and Bird2015; Licht et al., Reference Licht, Pullen, Kapp, Abell and Giesler2016) to the northwest of the CLP, may have been providing dust for loess deposits in the Loess Plateau at least for the last glacial and interglacial cycle. However, our results cannot distinguish the contribution of these specific, individual dust source areas that all lie in the upwind direction from the CLP along the prevailing East Asian winter monsoon winds.
CONCLUSION
We have studied the AMS of two parallel loess profiles spanning the past 130 ka in Caotan county, Gansu Province, in the western Chinese Loess Plateau. Our results show that the magnetic lineations of the loess units are significantly clustered along the NW to SE direction, consistent with the direction of the winds of the modern East Asian winter monsoon. This suggests that the East Asian winter monsoon creates the prevailing winds responsible for dust transport to the western Chinese Loess Plateau. Similar paleowind directions were derived from AMS results from paleosol units in both two sections, which suggests that the dust-bearing wind directions in the western Loess Plateau are relatively stable during glacial and interglacial cycles. Combined with sedimentary and AMS evidence from the eastern CLP, we conclude that the East Asian winter monsoon dominates dust transport across the entire Chinese Loess Plateau during both glacial and interglacial periods. Our AMS results highlight the large areas of deserts and Gobi deserts located in the upwind direction as the dominant sources of the aeolian deposits of the Loess Plateau.
Acknowledgments
We are grateful to France Lagroix, Junsheng Nie, and the editor Nicholas Lancaster for their constructive comments and suggestions, which improved the manuscript significantly; to Aleeya Rahman and Jan Bloemendal for language improvement. Special thanks are due to Shuangchi Liu and Huafeng Qin for their kind assistance with the magnetic measurements.
Financial Support
This study was jointly supported by the Strategic Priority Research Program of Chinese Academy of Sciences (award XDB26000000), the National Natural Science Foundation of China (awards 41888101, 41625010, and 41690114), and the National Key Research and Development Program (award 2017YFE0112800).


