


Over the last centuries, many attempts have been made to categorize the large and diverse group of irrational human fears and phobias (Berrios, Reference Berrios1996; Marks, Reference Marks1987). More recently, many factor analyses of self-reported fears have been published with varying results (Cox, McWilliams, Clara, & Stein, Reference Cox, McWilliams, Clara and Stein2003; Fisher, Schaefer, Watkins, Worrell, & Hall, Reference Fisher, Schaefer, Watkins, Worrell and Hall2006; Hallam & Hafner, Reference Hallam and Hafner1978; Meikle & Mitchell, Reference Meikle and Mitchell1974; Mellon, Reference Mellon2000; Muris & Ollendick, Reference Muris and Ollendick2002; Rothstein, Boblitt, & Holmes, Reference Rothstein, Boblitt and Holmes1972).
While the online ‘Phobia list’ enumerates hundreds of phobias (Culberson, Reference Culberson2012), the Feighner Criteria (Feighner et al., Reference Feighner, Robins, Guze, Woodruff, Winokur and Munoz1972) – the first widely used operationalized diagnostic criteria for psychiatric disorders – contained a single category of ‘Phobic Neurosis’ without subtypes. The Research Diagnostic Criteria published a few years later included Phobic Disorder with three subtypes: agoraphobia, social phobia, and simple phobia (Spitzer, Endicott, & Robins, Reference Spitzer, Endicott and Robins1975). This typology was adopted in DSM-III (American Psychiatric Association, 1980) and carried forward to DSM-III-R (American Psychiatric Association, 1987). DSM-IV proposed an expanded system, maintaining agora-, social, and specific phobias, and proposing four subtypes of specific phobia: animal, situational, natural environment, and blood-injection-injury subtypes (American Psychiatric Association, 1994). This approach was essentially unchanged in DSM-5 (American Psychiatric Association, 2013).
Although psychometric network analyses have been recently making major contributions to our understanding of the structure of psychopathology (Borsboom, Reference Borsboom2017; Robinaugh, Hoekstra, Toner, & Borsboom, Reference Robinaugh, Hoekstra, Toner and Borsboom2020), we are unaware of prior efforts to apply it to phobias. The main utility of network models applied to ‘between-subjects’ data is estimating and visualizing highly multivariate dependencies in phobia data without making many strong assumptions. Utilized this way, network analysis is an exploratory tool that helps generate hypotheses to be tested in follow-up work. Detailed information about challenges and opportunities of the network approach to psychopathology, as well as overviews of clinical network theory, statistical network models, and their inter-relations, can be found elsewhere (Fried, Reference Fried2020; Fried & Cramer, Reference Fried and Cramer2017; Guloksuz, Pries, & van Os, Reference Guloksuz, Pries and van Os2017). Network analysis and factor analysis are statistically equivalent, under a set of conditions (Kruis & Maris, Reference Kruis and Maris2016; van Bork et al., Reference van Bork, Rhemtulla, Waldorp, Kruis, Rezvanifar and Borsboom2019), which means that each network model has a factor model with equal fit to the data, and vice versa. However, while factor models summarize the correlations among items in latent variables, we sought to map out conditional dependence relations among all the individual phobic fears. We are interested in determining the ‘connectivity’ amongst the individual phobias that remain after partialing away their joint associations with the other phobias.
In this report, we examine the topography of 21 phobic fears, assessed at personal interview, in 7585 male and female adult twins sampled from the population-based Virginia Twin Register. These fears and phobias were designed to assess all phobia categories in DSM-IV and V except the natural environment subtype of specific phobia. We seek to address three questions:
First, what do the network relationships among all 21 individual phobic fears look like, and do network structures differ between women and men?
Second, how many groups of phobias (referred to as ‘communities’ in the context of network models) can be identified, and how well do they map onto the categories articulated in DSM-IV and V?
Third, can we validate the anticipated specific relationship between panic disorder and agoraphobia (Craske & Simos, Reference Craske, Simos, Simos and Hofmann2013; Gittelman & Klein, Reference Gittelman and Klein1984; Grant et al., Reference Grant, Hasin, Stinson, Dawson, Goldstein, Smith and Saha2006; Joyce, Bushnell, Oakley-Browne, Wells, & Hornblow, Reference Joyce, Bushnell, Oakley-Browne, Wells and Hornblow1989)?
Methods
Sample
Participants in this study derive from two inter-related studies in Caucasian same-sex twin pairs participating in the Virginia Adult Twin Study of Psychiatric and Substance Abuse Disorders (VATSPSUD) (Kendler & Prescott, Reference Kendler and Prescott2006). All subjects were ascertained from the Virginia Twin Registry – a population-based register formed from a systematic review of birth certificates in the Commonwealth of Virginia. Female–female (FF, N = 1943) individual twins, born 1934–1974, became eligible if both members previously responded to a mailed questionnaire in 1987–1988, the response rate to which was ~64%. Data on fears and phobias used in this report were collected at the fourth wave of interviews (FF4), conducted in 1995–1997, where we interviewed 85% of the eligible subjects. Data on the male–male and male–female pairs (MM for short) came from a sample (birth years 1940–1974) initially ascertained directly from registry records by a phone interview with a 72% response rate. Data on fears and phobias were collected at the second wave of interviews (MM2, N = 5642 individual twins), conducted in 1994–1998 with a response rate of 83%. The mean (s.d.) age and years of education of the twins were 36.5 (8.6) and 14.3 (2.2) at the FF4 interview, and 37.0 (9.1) and 13.6 (2.6) at the MM2 interview. These analyses included a total of 7585 twins, 44% female and 56% male. Those who had complete data and were used in network analysis included 7514 twins.
Clinical assessment
The lifetime prevalence of irrational fears and phobias were assessed at personal interview by trained mental health professionals blind to the status of the cotwin using a module based on the Diagnostic Interview Schedule (DIS; Robins & Helzer, Reference Robins and Helzer1985) and was introduced as follows:
Next, I want to ask you about phobias, which are fears of particular things or situations that are so strong a person avoids them even though there is no real danger.
For each item, the interviewer then asked ‘Have you ever had an unreasonable fear of …’. If the respondent answered positively, the interviewer inquired whether the fear ever interfered with their life or activities. Interference was here defined objectively and required the respondent to report some practical way in which the fear or the avoidance of the phobic stimulus impacted on their life functions. Merely experiencing fear in the presence of the stimulus even if intense was insufficient to be scored as interference, coded as: 1 = major, 3 = minor, and 5 = none.
For these analyses, twins' responses were recoded, for each specific phobic stimulus, into four groups: (i) those who reported no fear (coded 0), (ii) those who reported the presence of an irrational fear with no interference (coded 1), (iii) those who reported both the irrational fear and a minor level of objective interference associated with the fear (coded 2), and (iv) those who reported both the irrational fear and a major level of objective interference associated with the fear (coded 3). This approach represents a modification of the DSM-III criteria (American Psychiatric Association, 1980) on which this DIS was based. In these network analyses, the recoded phobic fears were treated as ordinal four-category variables with increasing integers indicating greater levels of negative impact.
We assessed the presence or absence of fears or phobias associated with the 21 individual specific phobic stimuli. An abbreviated description of these 21 items and the category of phobic fears to which they were a priori assigned is seen in Table 1.
Table 1. Assessed phobic stimuli by their a priori phobic subtype

Panic disorder was assessed using DSM-IV criteria (American Psychiatric Association, 1994). Because of the rarity of cases meeting full criteria, we used a broadly defined form which required (i) two or more panic attacks in a 4-week period or 2 or more hours per week worried about having another attack, (ii) four or more out of 14 panic criteria, and (iii) the attack reached a peak within 30 min of onset. This definition had a prevalence of 3.8% in our sample (v. 2.0% for the full set of criteria). We had a small number of twins missing data on panic disorder, so the effective sample size for those analyses was 7220.
Statistical methods
We estimated Gaussian Graphical Models (GGMs) with LASSO (least absolute shrinkage and selection operator) regularization. These network models are the most commonly used models in the contemporary network analysis literature. A detailed introduction to and tutorial on estimating GGMs can be found elsewhere (Epskamp & Fried, Reference Epskamp and Fried2018; Epskamp, Borsboom, & Fried, Reference Epskamp, Borsboom and Fried2018). Briefly, using Spearman ρ rank order correlations, GGMs estimate conditional dependence relations among a set of items, the result of which can be plotted as a graph that contains nodes (variables) and edges (regularized partial correlations). LASSO regularization shrinks all edge weights, and pushes a subset of the weaker edges to be exactly zero depending on the hyperparameter γ (in our case, the default of 0.5), which deals efficiently with increased type-I error rates that result from the many parameters that are estimated in GGMs, and has shown good model recovery (Friedman, Hastie, & Tibshirani, Reference Friedman, Hastie and Tibshirani2008).
Overall, we performed five analyses. First, we estimated two GGMs: one model with 21 phobic fears, and a second model in which we included panic disorder. The layout of the phobic fears network is based on the Fruchterman–Reingold algorithm (Fruchterman & Reingold, Reference Fruchterman and Reingold1991), which aims to place related nodes close to each other; we used the same layout for the panic network. Due to recent work that identified potential problems with regularization, we also used a novel network estimation method, ggmmodSelect (http://psychosystems.org/qgraph_1.5). The result was nearly identical to regularized estimation (for details see Supplementary materials), which is why we keep the conceptually simpler model in the main manuscript.
Second, we used the Network Comparison Test (NCT) (van Borkulo et al., Reference van Borkulo, Boschloo, Kossakowski, Tio, Schoevers, Borsboom and Boschloo2017) to compare the network structures of women and men. The NCT is a permutation test that investigates if two samples differ in their underlying network structures with, in our case, 5000 iterations. Because regularized network estimation depends on sample size, we included all 3325 women, and a random subsample of 3325 (out of 4189) men in the analyses. We also correlated the resulting adjacency matrices (i.e. network structures) of women and men to establish the degree of similarity, using Spearman correlations.
Third, we estimated predictability (Haslbeck & Fried, Reference Haslbeck and Fried2017), which is the shared variance a node has with all its neighbors in the network (in case of the binary panic node, beyond the intercept model). Predictability is plotted in filled circles around nodes (the fuller the circle, the more variance explained).
We do not interpret predictability in detail in the results, but provide it merely as a descriptive tool to (similar to the means of the items) show how much variance is explained in each node, which gives an indication of the variance that may not be captured in the system.
Fourth, to establish the number and nature of groups of phobic fears, we utilized IComDetSpin (Werner, Reference Werner2018), a recently developed procedure that uses the well-established spinglass algorithm and summarizes the results across (in our case, 5000) iterations (Werner, Reference Werner2018). Spinglass is a non-deterministic community detection algorithm that has been shown to perform well in retrieving the true number and structure of communities (Yang, Algesheimer, & Tessone, Reference Yang, Algesheimer and Tessone2016). Yet, its non-deterministic nature can result in receiving different solutions when repeating the algorithm on the same network. Since these differing solutions can represent meaningful insights, IComDetSpin utilizes this non-deterministic nature and provides two pieces of information: (1) community-level information, i.e. the frequency of community structures across all iterations, and (2) node-level information, i.e. which nodes tend to be grouped together across all iterations.
Fifth, we conducted a number of robustness and sensitivity analyses, described in detail in the Supplementary materials. Briefly, network models are highly parameterized. To obtain information on how accurate all parameters were estimated, we used the routines implemented in the R-package bootnet, discussed in detail elsewhere (Epskamp et al., Reference Epskamp, Borsboom and Fried2018). In sum, we used bootstrapping routines with 1000 iterations to estimate confidence regions among edge weights, and edge weights difference tests where we determine statistically whether each edge is significantly different from each other test (note that this test currently does not control for multiple testing).
Results
Network model of phobic fears
The 21-item phobic fears network is presented in Fig. 1. Of 210 possible edge weights, 174 (82.9%) were non-zero, all estimated as positive. The strongest three edges were ‘bugs’–‘spiders’ (0.24), ‘tunnels’–‘closed’ (0.24), and ‘needles’–‘hospitals’ (0.22). To reiterate, an edge of 0.24 indicates that the information of a person's score on the item ‘bugs’ is positively associated to that person's score for ‘spiders’ after partialing out (co)variance of all other variables in the data. Bootstrap routine showed that these three edges were roughly equal in strength but differed significantly from all weaker edges (for detailed stability analyses, see Supplementary materials).
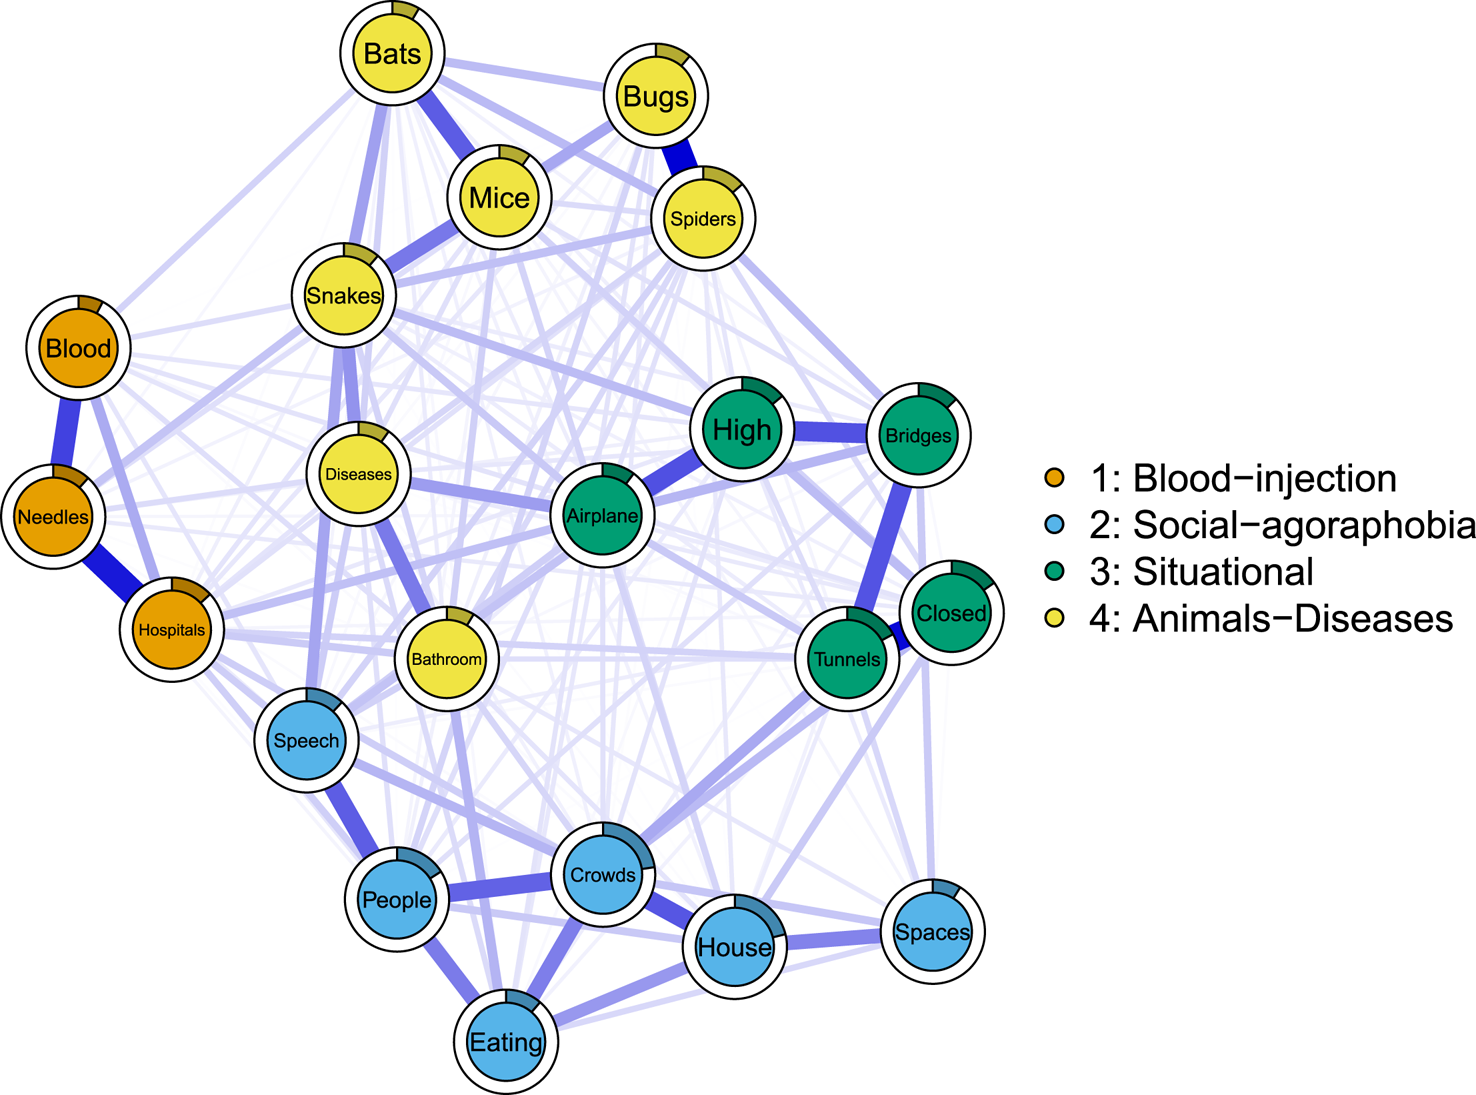
Fig. 1. Phobic fears network, in which nodes are 21 phobic fears, and edges represent regularized conditional dependence relations that can be interpreted akin to conservative partial correlation. Thicker edges represent stronger coefficients, and the filled (colored) proportion of the full circle around each node indicates its predictability, i.e. the amount of variance explained by all other nodes in the network. The four communities of nodes were derived statistically using iterated spinglass community detection.
The NCT did not reject the null hypothesis that networks of women and men are structurally equivalent (p = 0.097, see Supplementary materials). However, the Spearman correlations between the network structures of women and men only indicated moderate similarity (r = 0.50), calling for more detailed investigations of potential differences.
Community detection
The results of the most commonly identified four communities are also presented in Fig. 1. This solution emerged in 47.5% of 5000 iterations. In the second most common solution (21.1% of iterations), bathrooms and diseases emerged as a separate fifth community. We focus on the four-community solution here, for which we assigned the following names: (i) blood-injection, (ii) social-agoraphobia, (iii) situational, and (iv) animal-disease.
These network community groupings differed from the prescribed DSM-IV organization of phobic subtypes in two major ways. First, social and agoraphobic fears were not separated as they are in DSM-IV. Second, animal phobias expanded beyond those articulated in DSM-IV to include fear of using public bathrooms, a performance fear within social phobia in DSM IV (American Psychiatric Association, 1994) (p. 414), and fear of certain diseases such as cancer or AIDS which in our instrument was an example of blood-injury fears.
Other subtler features of the community structure of potential clinical significance are noteworthy. First, within the situational phobia community, one pair of fears ‘closed in places’–‘tunnels’ constituted a claustrophobic cluster, and another pair ‘high places’–‘fear of flying/airplanes’ made up an acrophobic cluster. Both of these clusters were more tightly linked with fear of bridges suggesting that such a fear could function as ‘transitional situational stimulus’ that could elicit both claustrophobic and acrophobic fears.
Second, an interesting substructure was also seen within the social and agoraphobic community. Fear of open spaces was most closely linked with fear of going out of the house alone to form an agoraphobic subcluster. Fear of meeting new people was most closely related to fear of public speaking and eating in public, constituting a social phobic subcluster. Fear of crowds was tightly linked with both subclusters suggesting that crowds could function as a ‘transitional social-agoraphobic stimulus’ which could elicit both agora- and social phobic fears.
Third, within our animal-diseases community, a major division was seen between an animal subcluster and a diseases/bathrooms subcluster with a fear of snakes linked to each subcluster. Within the animal cluster, two further subdivisions were evident: bugs and spiders v. bats, mice and snakes. Perhaps bridges, crowds and snakes formed transitions between distinct clusters because exposures to them could result in distinct fear attributions – such as snakes being seen as ‘dangerous’, and/or ‘disgusting’.
Panic network
We added panic disorder to our 21 phobic fears and re-fit the network model, the result of which is depicted in Fig. 2. The structure of the network changed minimally: the correlation between the adjacency matrix (i.e. conditional dependence relations) of the 21 phobic fears before and after adding panic disorder was +0.98. Panic disorder exhibited 13 non-zero relations, the strongest of which were to the three agoraphobia fears: being in crowds (0.12), going out of the house alone (0.09), and being in open spaces (0.07).

Fig. 2. Panic network, consisting of 21 phobic fears and one additional node for panic disorder. Edges represent regularized conditional dependence relations that can be interpreted akin to conservative partial correlations. Thicker edges represent stronger coefficients, and the filled (colored) proportion of the full circle around each node indicates its predictability, i.e. the amount of variance explained by all other nodes in the network. The four communities of nodes were derived statistically using iterated spinglass community detection.
Robustness and stability analyses
We conducted two robustness and stability analyses. First, estimating networks via regularized GGMs or the alternative estimation procedure, ggmmodSelect, made little differences: the resulting networks were highly similar (Spearman correlation of 0.90 among adjacency matrices for the phobic fears network). Further, the two most commonly identified community structures [4 communities (Fig. 1) v. 5 communities, see Supplementary materials] were identical for both estimation procedures, demonstrating the robustness of the identified community solutions.
Second, the stability analyses showed that confidence regions around the edge weights were of moderate size. This means that the order of edge weights needs to be interpreted with some care (for details, see Supplementary materials).
Discussion
We applied network psychometric models, in a large sample of population-based twins, to the assessments at personal interview of a lifetime history of 21 phobic fears and any associated interference. We sought to answer three major questions which we address in turn.
We initially examined the degree to which we replicated the structure of our phobic fears proposed for these five categories of phobias in DSM-IV and DSM-V. Our results were in substantial but not complete agreement with the DSM-IV typology. Three noteworthy differences were noted. Most importantly, our initial network analyses did not support the DSM typology that agoraphobia and social phobia were separate phobic subtypes. In our analyses, the two sets of phobic fears aggregated into a single community. This raises the question of the validity of the distinction between these two groups of phobic fears defined by the DSM-IV as reflecting the fear of ‘being in places or situations from which escape might be difficult or embarrassing or in which help might not be available (American Psychiatric Association, 1994, p. 396)’ and the ‘fear of one or more social or performance situations in which the person is exposed to unfamiliar people or to the possible scrutiny by others (American Psychiatric Association, 1994, p. 416)’. However, within that large fear community, subclusters could be seen which reflected agoraphobic v. social phobic fears. Furthermore, our results with the addition of panic disorder to our analyses produced somewhat divergent results. That is, panic disorder demonstrated a much stronger relationship with agoraphobic than the social phobia items, supporting the validity of their distinction. Thus, our analyses provided some support for and against the validity of the DSM-IV distinction between agoraphobia and social phobia.
Second, our group of animal phobias contained two fears not part of this subtype in DSM-IV: the fear of using public bathrooms, which is a performance fear considered characteristic of social phobia in DSM IV (American Psychiatric Association, 1994) (p. 414) and the fear of certain diseases such as cancer or AIDS. While not formally so noted in DSM-IV, fear of diseases is often considered an example of blood-injury fears. As seen in Fig. 1, it was a peripheral member of that community. We could not identify in the literature, a direct precedent for this finding. Fears of using public restroom were noted as one of the social fears with the largest sex difference being more common in men likely because urination is more exposed in men's public bathrooms (Turk et al., Reference Turk, Heimberg, Orsillo, Holt, Gitow, Street and Liebowitz1998). In an item-response analysis of multiple datasets for social phobic fears, the fear of using public bathrooms reflected high levels of social anxiety and it was, along with public speaking, among the least discriminating of the items (Crome & Baillie, Reference Crome and Baillie2014). This perhaps explains why it did not cluster strongly with the other social phobia fears in our data. Furthermore, fear of use of public restrooms can be associated with concerns about ‘catching’ lice or ‘venereal diseases’ from ‘dirty’ toilet seats, thereby explaining the association with fear of ‘bugs’ (Brently, Reference Brently2012).
Third, fear of diseases formed part of our animal rather than our blood-injury group of phobic fears. A prior literature has suggested an association between fear of diseases and blood-injury phobia. For example, Thyer et al. review studies of what they termed ‘Blood-injury-illness phobia’ in which they suggest that these fears are distinctive because they are ‘selectively associated with a vasovagal fainting response upon exposure to phobic stimuli (Thyer, Himle, & Curtis, Reference Thyer, Himle and Curtis1985, p. 451)’. DSM-IV, by contrast, uses a more restrictive term ‘blood-injection-injury’ which they also suggest is ‘often characterized by a strong vasovagal response’ that is ‘cued by seeing blood or an injury of by receiving an injection or other invasive medical procedure (American Psychiatric Association, 1994, p. 406)’. So, fear of diseases as a group, which are only indirectly involved with exposure to blood, injections, or medical procedures, has existed on the periphery of the ‘blood-injury’ phobia group. Our results support this position and suggest that they are more closely related to animal than classical blood-injury fears/phobias.
Our next question was to determine the similarity or differences in the topography of phobic fears in men and women. This is a natural question given the substantially greater prevalence of most phobias in women than in men (Fredrikson, Annas, Fischer, & Wik, Reference Fredrikson, Annas, Fischer and Wik1996; Furmark et al., Reference Furmark, Tillfors, Everz, Marteinsdottir, Gefvert and Fredrikson1999; McLean & Anderson, Reference McLean and Anderson2009). Our results were surprising. Despite our relatively large sample sizes, we could not reject the null-hypothesis that network structures of phobic fears are equal across men and women. However, our skewed ordinal data likely lower precision of network parameter estimates, and therefore may reduce power for the NCT to detect differences. Perhaps our results suggest that the causes for the sex differences across the various phobic fears may be a general vulnerability (McLean & Anderson, Reference McLean and Anderson2009) rather than a more complex series of risk factors specific to individual domains.
Our final question was to examine the relationship between panic disorder and our topography of phobic fears. This question addresses the specificity v. non-specificity of the relationship between panic disorder and agoraphobic fears (Craske & Barlow, Reference Craske and Barlow2008). The validity of our data on this question is strengthened because our assessment of the presence of panic disorder and phobic fears occurred in independent sections of our interview. Our results were clear-cut. A history of broadly defined panic disorder was related most strongly to the three core agoraphobic fears.
A number of prior factor analyses have been performed on lists of phobic fears often in student populations. Typically, the scales used recorded only the existence of the fear without evaluating fear-related impairment. Most relevant to our report, therefore, was the study reporting results of an exploratory factor analysis from the National Comorbidity Survey (Cox et al., Reference Cox, McWilliams, Clara and Stein2003), which examined 19 feared situations present in the CIDI interview derived from the DSM-III-R (American Psychiatric Association, 1987). Scoring positive on these items required either avoidance of the phobic stimulus or being ‘extremely uncomfortable’ in its presence. Congruence between their results and ours was not strong. They identified five factors: ‘agoraphobia’, ‘speaking fears’, ‘fears of being observed’, ‘fear of heights or water’, and ‘threat fears’. For example, the DSM social phobic fears split into two factors – ‘speaking fears’ and ‘fears of being observed’ – with ‘public toilet use’ in the latter factor. ‘Fear of blood and needles’ was part of their residual ‘threat fears’ along with ‘snakes/animals’ and ‘closed places’.
This twin sample had previously been used to identify exploratory genetic and environmental phobic factors analyses (Loken, Hettema, Aggen, & Kendler, Reference Loken, Hettema, Aggen and Kendler2014). Focusing on genetic factors, the greatest similarities with our results were that in both studies, the agora- and social phobia fears were in the same factor/community. However, they had a clear blood-injection-injury phobic genetic factor which included diseases and the acro- and claustrophobic fears were on different genetic factors. The patterns of resemblance of phobic fears that we examine here arose from all causes including genetic and environmental risk factors and potential causal effects of one phobic fear upon another. There is therefore no a priori reason why the structure of phobic fears found in a prior genetic analysis should resemble those we discovered here as genetic and environmental structures for psychiatric disorders often differ (Kendler et al., Reference Kendler, Aggen, Knudsen, Roysamb, Neale and Reichborn-Kjennerud2011).
Limitations
These results need to be interpreted in the context of six potentially significant limitations. First, our sample is limited to adult Caucasian Virginians and may not generalize to other age groups or ethnicities.
Second, while the included phobia subtypes represent many of the common phobias, our list was far from complete and, for example, did not include natural environment types of phobias such as storms, heights, and water, and other specific phobias included in other studies such as cemeteries, pain, and traffic (Phillips, Fulker, & Rose, Reference Phillips, Fulker and Rose1987; Torgersen, Reference Torgersen1979). The results of our network analyses are, of course, dependent on the phobias we examine, and would have differed had we assessed a different set. However, our items do represent a large number of diverse phobic stimuli.
Third, while the network literature in psychopathology has often interpreted edges as putative causal relations (e.g. insomnia leads to sad mood, which in turn leads to suicidal ideation), we used network psychometric models as an agnostic tool to estimate and visualize multivariate dependencies in the data. Much more work will be required to try to understand the nature of the identified relations, i.e. why certain phobic fears cluster strongly together, while others do not.
Fourth, the comparison of the network structures of women and men provided us with mixed results. The NCT indicated no difference between structures, but the structures were only moderately correlated. This inconsistency may in part stem from the fact that the highly skewed ordinal data reduce power to detect differences, despite our large sample size. Novel statistical tests for comparing network structures are under development, such as Bayesian equivalence tests, but none were validated at the time of writing this manuscript.
Fifth, the dataset analyzed was collected in twins, consisting of nested twin members which formally violates the assumptions of independence of observations in network estimation (specifically, the dataset consists of n = 6046 twins from complete pairs and n = 1453 unpaired twins). To study the impact of this violation, we conducted a series of sensitivity analyses described in detail in the Supplementary materials. These analyses included comparing network structures in three subsets of twin 1 v. twin 2 v. singletons (where we did not find that twin 1 v. twin 2 networks were considerably stronger than the networks of twin 1 or twin 2 v. singletons), and running the community detection algorithm for all three subgroups (where we found that the most common solution identified in singletons is exactly identical with the main solution identified in the full dataset reported above). These results alleviate our concerns as to the limited generalizability of our results in non-twin data.
Finally, spinglass is one of several different community detection algorithms that can be applied in network science, and other methods such as the walktrap algorithm and clique percolation (Blanken et al., Reference Blanken, Deserno, Dalege, Borsboom, Blanken, Kerkhof and Cramer2018; Golino & Epskamp, Reference Golino and Epskamp2017) exist. It is currently not known which of these different techniques work better for the various types of data investigated in our field, and we hope that dedicated statistical work comparing these methods will provide guidance for empirical work on which method to use in which case.
Conclusions
Using network analyses applied to a large population-based sample of twins, we broadly validated the DSM-IV typography of phobic fears with two potential exceptions. First, our main analyses did not support the clear distinction of agoraphobic and social phobic fears. Second, fear of public restrooms, considered a social phobic fear in DSM-IV, clustered in our analyses with animal phobias. We found no differences in the structure of phobic fears in men and women. Our results provided strong support for the specificity of the relationship between panic disorder and the key agoraphobic fears of going out of the house alone, being in crowds, and being in open spaces.
Supplementary material
The supplementary material for this article can be found at https://doi.org/10.1017/S0033291720004493.
Acknowledgements
None.
Financial support
This project was supported by grants R01MH-40828 and R01MH/AA/DA49492 from the National Institutes of Health.
Conflict of interest
None.
Ethical standards
The authors assert that all procedures contributing to this work comply with the ethical standards of the relevant national and institutional committees on human experimentation and with the Helsinki Declaration of 1975, as revised in 2008.
Location of where work was done
Virginia Commonwealth University, Leiden University, Amsterdam University Medical Center.


