


I. INTRODUCTION
It is now established that the textures of the coating layers greatly affect the cut performance of tools (e.g., Ruppi et al., Reference Ruppi2008). Especially for CVD coating, the textures of α-Al2O3 and MT (medium temperature)-TiCN layers have been extensively studied in relation to materials properties and cut performance in the metal cutting industry.
Coating textures are generally characterized by X-ray diffraction (XRD) with texture coefficient (TC) analysis, calculation from pole figures, or by inverse pole figures (IPFs) from electron backscatter diffraction (EBSD) data with a scanning electron microscope (SEM). Here, the IPF is an orientation of the sample direction mapped onto the crystal coordination system, and such sample orientation distributions are most instructive when the texture is nearly uniaxial, or fiber orientation is expected. CVD coatings are one of these cases since there is no preferential crystal growth in the in-plane direction. For the TC calculations, the Harris formula (Harris et al., Reference Harris1952) has been widely used with the number (n) of selected diffraction peaks with I and I 0 being the diffraction intensity from the sample and randomly oriented specimen, or a given ICDD PDF card respectively as,
 $${\rm T}{\rm C}^{hkl} = \displaystyle{{I^{hkl}/I_0^{hkl} } \over {( {1/n} ) \times \sum\nolimits_{( hkl) }^n {( I^{hkl}/I_0^{hkl} ) } }}$$
The advantage of the TC method is that only a powder diffractometer is required without a Eulerian cradle or special optics, therefore fast measurements are possible, and historical (existing) data taken with this geometry can be reanalyzed as well. In most of the cases, tabulated values of TChkl for selected (hkl) in the calculations are reported; except for some strong textures such as (0001) for α-Al2O3, coatings with the other textures or weaker preferred directions that are rather difficult to be visualized from the TC tables.
Over a couple of decades, EBSD characterization using an SEM has been popular for texture analysis in the metal cutting industries, and not only the macrotextures, but microtextures (such as grain boundaries misorientations) can also be characterized. Most of the IPF calculations in the metal cutting industry nowadays are based on EBSD. On the other hand, IPF mapping using XRD TC data is less time-consuming, and useful information can be obtained in some cases, and a fairly large number of spectra are available in the database. The sample is mounted in reflection geometry with its normal parallel to the direction of interest, in the present case coating direction, and the reflected intensities are measured with 2θ/θ scan. The resulting (hkl) intensities are normalized to the intensities of a standard sample with random texture or from a chosen ICDD PDF card. The data processing up to this point is the same as regular TC determinations as in Eq. (1). The IPF can be constructed (Engler and Randle, Reference Engler and Randle2010) by mapping each TChkl to the stereographic surface or equal area projection. In the IPF mapping, (hkl) datapoints are mostly at crystallographically symmetrical points below 2θ < 180° without extinction rules, thus generally the available (hkl) data points are limited (mostly typical facet faces) especially for high symmetry crystal structures. In addition, for coating analysis, the peaks are chosen which do not interfere with peaks from the other coating phases or substrate, the available (hkl) points are further limited, such as cubic TiCN and TiN cases. Yet, for α-Al2O3 case, the lower crystal symmetry (rhombohedral R  $\bar{3}$c) results in relatively peak-rich diffractograms, and important reflections (0006) and (00012) are not in fully extinct conditions, thus fortunately (0001) the basal texture can still be characterized.
To the best of author's knowledge, there have been no or very few attempts to evaluate IPF of CVD-based α-Al2O3 coating in the metal cutting industry using a powder X-ray diffractometer. This time, α-Al2O3 IPF results are characterized for several commercially available metal cutting inserts from selected vendors and compared with EBSD results. All the IPF results presented here are in the coating directions and equal area projections are used.
II. METHODS
A. Samples
Several commercial metal cutting tool inserts from several vendors, produced in the past and present, were selected for this study. All the XRD measurements were done for the inserts in the as-received conditions. The coatings architectures used here are common for many commercial products with (WC /Co substrate)–TiN–MT TiCN–α-Al2O3 and thin top layer TiN. For comparison studies with EBSD, we used JEOL JSM-7100F with standard SEM settings for a polished surface from the cross-sections.
B. X-ray diffraction measurements
A PANalytical X'Pert MPD X-ray diffractometer with Cu Kα radiation was used for the measurements and the peak intensities were extracted using HighScore Plus software (Degen et al., Reference Degen, Sadki, Bron, König and Nénert2014). Variable divergence slits were used to have a constant irradiation area of 2× 10 mm2 and the intensity was later numerically converted to a fixed slit size mode by software. X-rays are diffracted primarily from the topmost coating layer due to the increasing attenuation of the incident beam with depth. The measured spectra were fit (Pawley fit) including TiN, TiCN (multiple phases are included when necessary), α-Al2O3, and WC, and the intensity of (hkil) reflections of α-Al2O3 were extracted by deconvolution. A representative diffraction spectrum is shown in Figure 1. Absorption from the thin TiN outermost layer was not corrected since its thickness data were often unavailable. Peaks with significant intensity overlap from other phases were not included in the IPF calculation. As for normalization, one must be careful with choosing an appropriate PDF reference card where data quality and experimental conditions are ensured, and errors in the I 0 (hkil) from preferred orientations are minimized. Thanks to ICDD reviews, ICDD star quality reference could be found easily, and the star quality PDF 01-070-7346 was used as I 0 (hkil) in this paper.

Figure 1. Typical diffraction pattern from CVD-coated WC. Peak position of α-Al2O3 is shown with (hkl) index. Closely located peaks, overlapping with the other phases, were not included in the analysis.
C. Calculation program
The position of (hkil) points in the IPF can be calculated for α-Al2O3. The angle φ between two planes (h 1k 1i 1l 1) and (h 2k 2i 2l 2) can be written as,
 $$\cos {\rm \varphi } = \displaystyle{{h_1h_2 + ( 1/2) ( {h_1k_2 + k_1h_2} ) + ( 3/4) l_1l_2{( {a/c} ) }^2} \over {\sqrt {h_1^2 + h_1^2 + h_1k_1 + ( 3/4) l_1^2 {( {a/c} ) }^2} \sqrt {h_2^2 + h_2^2 + h_2k_2 + ( 3/4) l_2^2 {( {a/c} ) }^2} }}$$
where a and c are lattice parameters a = 4.76 and c = 12.99 Å, respectively.
Corundum α-Al2O3 has a rhombohedral crystal structure with space group R  $\bar{3}$c, with Laue class of m
  $\bar{3}$. When the texture is measured by EBSD, each grain is measured with a two-dimensional detector, the section of the projected sphere in the IPF is considered based on Laue class m
  $\bar{3}$.
On the other hand, when we use a powder diffractometer, the diffracted intensity is recorded as a function of one variable (Bragg angle). Lattice planes such as R+ (10 $\bar{1}4$) (positive rhombs) and R− (01
 $\bar{1}4$) (negative rhombs) are nonequivalent in this crystal system, but diffracted at the same Bragg angle, so these planes are not separated using powder diffraction. The powder Laue class (6/mmm) is thus used instead of Laue class (m
  $\bar{3}$) (Pecharsky and Zavalij, Reference Pecharsky and Zavalij2008). This change halves the sectors in IPF. For this reason, the 30° sector made of (0001), (10
 $\bar{1}$0), and (11
 $\bar{2}$0) is used for the XRD, and 60° sector made of (0001), (10
 $\bar{1}$0), and (01
 $\bar{1}$0) is used for EBSD. The 30° sector made of (0001), (01
 $\bar{1}$0), and (11
 $\bar{2}$0) for the EBSD are folded back with respect to (0001)–(11
 $\bar{2}$0) to the 30° sector made of (0001), (10
 $\bar{1}$0), and (11
 $\bar{2}$0) for XRD, therefore, for example, R+ and R− comes to the same point in XRD IPF and the intensity sums up.
The coordinate of an arbitrary (hkil) point in IPF map can be obtained from Eq. (2), where the zenith angle φ 1 is the angle between (hkil) and (0001), and azimuth angle φ 2 is the angle between (hkil) and (11 $\bar{2}l$). Then, TC of (hkil) data points were plotted at polar coordinate (r, φ 2) with r = 2 tan(φ 1/2) for stereograph, or with r = 2 sin(φ 1/2) in equal area projections. Here, special planes of basal C (0001), hexagonal prisms M {10
 $\bar{1}$0}, A {11
 $\bar{2}$0}, rhombohedrons R {10
 $\bar{1}$2}, and hexagonal bipyramid N {11
 $\bar{2}$3} are denoted following those of a sapphire (single crystal α-Al2O3) as shown in Figure 2. The critical resolved shear stress (CRSS) for these planes with the given direction (slip systems) is significantly different (Mizumoto et al., Reference Mizumoto, Maas, Kakimura and Min2017; Shoja et al., Reference Shoja, Alm, Norgren, Andren and Halvarsson2021), thus the crystallographic planes of the α-Al2O3 exposed on the rake surface where the chip flows affect the cutting performance.
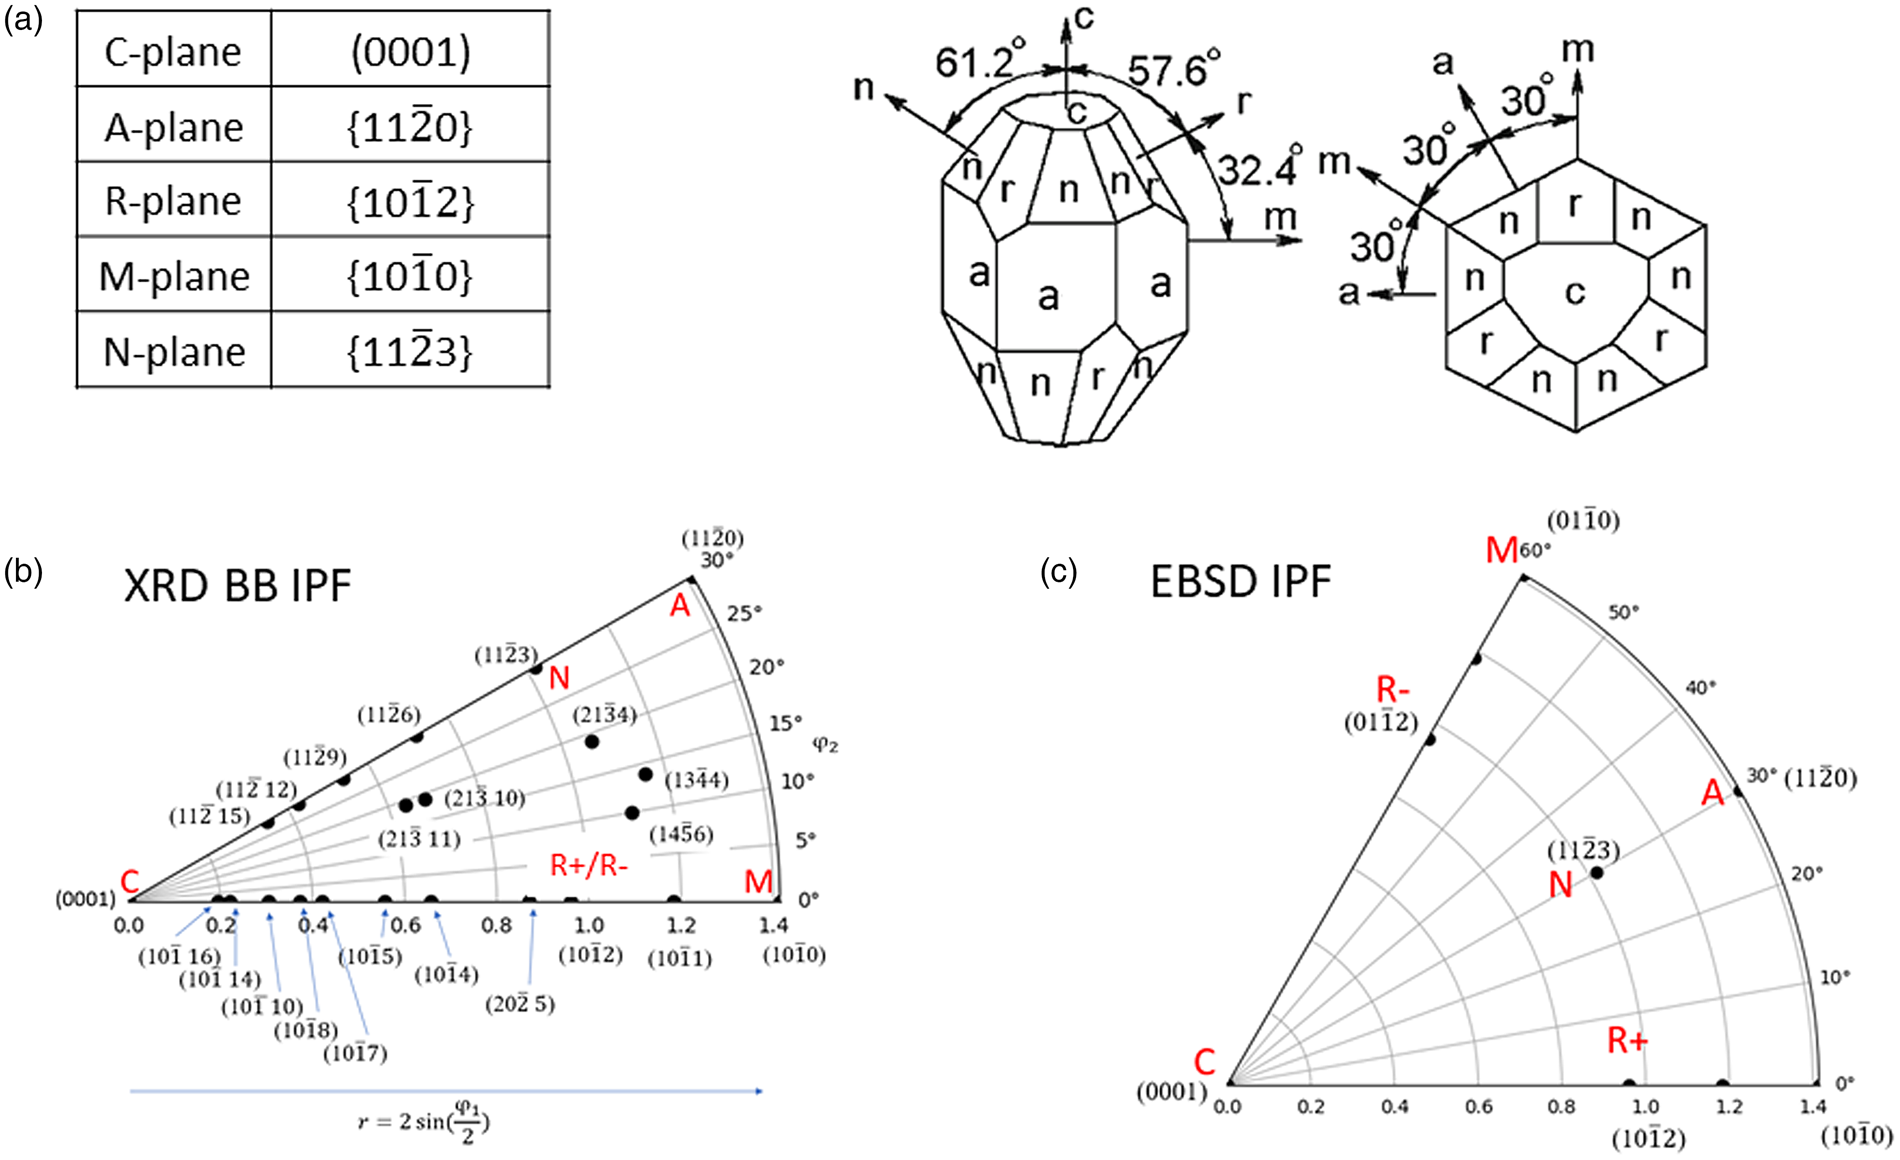
Figure 2. (a) Crystallographic orientation of α-Al2O3 (c/a = 2.79), and special planes. (b) IPF map based on powder XRD, where definition of φ 1, φ 2, and notation of R, A, M, N, and C planes. Available (hkil) points using Cu Kα diffractometer are plotted as dots in the IPF field (not necessarily used for the present analysis). (c) IPF field based on EBSD for comparison. The crystal structure is  $\bar{3}$ symmetry, and m
  $\bar{3}$ symmetry for EBSD based map with 60° section. The IPF field based on powder XRD is with 30° section because of 6/mmm powder Laue symmetry.
The programs were coded using PYTHON3.7 using matplotlib, and tricontourf to create a color map. The included (hkil) points were selected depending on the data range and overlap with other peaks, so the absolute intensities (which is maximum n: number of reflections used) cannot be directly compared unless the exact same sets of (hkil) peaks were used. In most of the cases, the texture growth is controlled in recent coating grades, the crystallites are oriented in one dominant direction. For better visualization, IPFs are plotted as linear (I), square root ( $\sqrt I$), and biquadratic root
  $\root 4 \of I$ to visualize the nondominant orientations. Color scale was set to [0, n (number of reflections used)].
III. RESUTLS
A. Comparison with EBSD IPF
Two metal cutting insert grades at the flank surface were compared with the XRD IPF map and EBSD IPF-Y map, which correspond to the out-of-plane (growth) direction, thus correlated to the IPF surface maps. One is C (0001) texture, and the other is R (10 $\bar{1}$2) texture. Figure 3 shows (a) band contrast, (b) α-Al2O3 orientation of each grain (coating direction), (c) IPF based on EBSD, and (d) IPF based on XRD where
  $\sqrt I \;$ was plotted with datapoints as white dots. For the IPF, the equal area projection is used. For both texture cases, EBSD and XRD-based IPF are qualitatively similar. In some cases, the construction of the IPF using XRD data results in a problem around the edge at φ 1 = 90° possibly due to the absence of some datapoints. The section angle of 60° is taken for the EBSD IPF while 30° for the XRD IPF map as described before.

Figure 3. Comparison between EBSD and XRD IPF for two grades exhibiting (a) C (basal) and (b) R (rhombohedral) texture. Note the section for the EBSD-based IPF is 60° and XRD powder diffraction based is 30°, where XRD IPF is a folded image of EBSD IPF.
Due to the limited number of datapoints (hkil), the deviation from strict (0001) texture cannot be expressed in the XRD IPF mapping. The texture strength near the (0001) plane may be evaluated if the reflections near (0001) such as (11 $\bar{2}$ 12), or (11
 $\bar{2}$ 15) (10
 $\bar{1}$ 16) with sufficient statistics are included in the IPF, or the rocking curves width of (0006), or (00012) may be included, but were not studied in this paper. Shoja et al. (Reference Shoja, Alm, Norgren, Andren and Halvarsson2021) compared TC from XRD data and EBSD IPF maps and attributed the difference of the (01
 $\bar{1}$2) texture case to the texture gradient and the different sampling volume. In the present case, the EBSD is taken from the cross-section image, therefore there were consistent results between the XRD IPF and the EBSD results.
B. XRD Bragg Brentano method vs. EBSD
There are several characteristic differences in techniques between XRD IPF and SEM IPF. These are summarized in Table I.
TABLE I. Comparison of the IPF between XRD powder diffraction and EBSD methods

C. Comparison studies of historical and current metal cutting inserts
Examples of IPF mappings are shown in Figure 4, for older and current grades, for several application ranges, for one selected vendor. The grades are tabulated according to the application range of steel (P) and cast iron (K) from their publications (catalogues/URLs) using current grades and corresponding previous grades for comparison. In the available XRD spectral data of historical samples, the 2θ range was often limited, so we could only use the data up to  $2{\rm \theta } \le 80^\circ$ for IPF calculation. The textures were mostly A (11
 $\bar{2}$0), and/or R (01
 $\bar{1}$2) textures for the previous grades (years 2000–2010). For the current grades, basal C (0001) textures were observed as shown in IPF mapping. For the application for roughing machining or interrupted cut, κ-Al2O3 coating were used for both the older and current grades. From the extensive studies for α-Al2O3 based CVD coating, the C (0001) textures are favored for some applications. Many metal cutting tool suppliers seem to adopt (0001) textures for most of the application range.
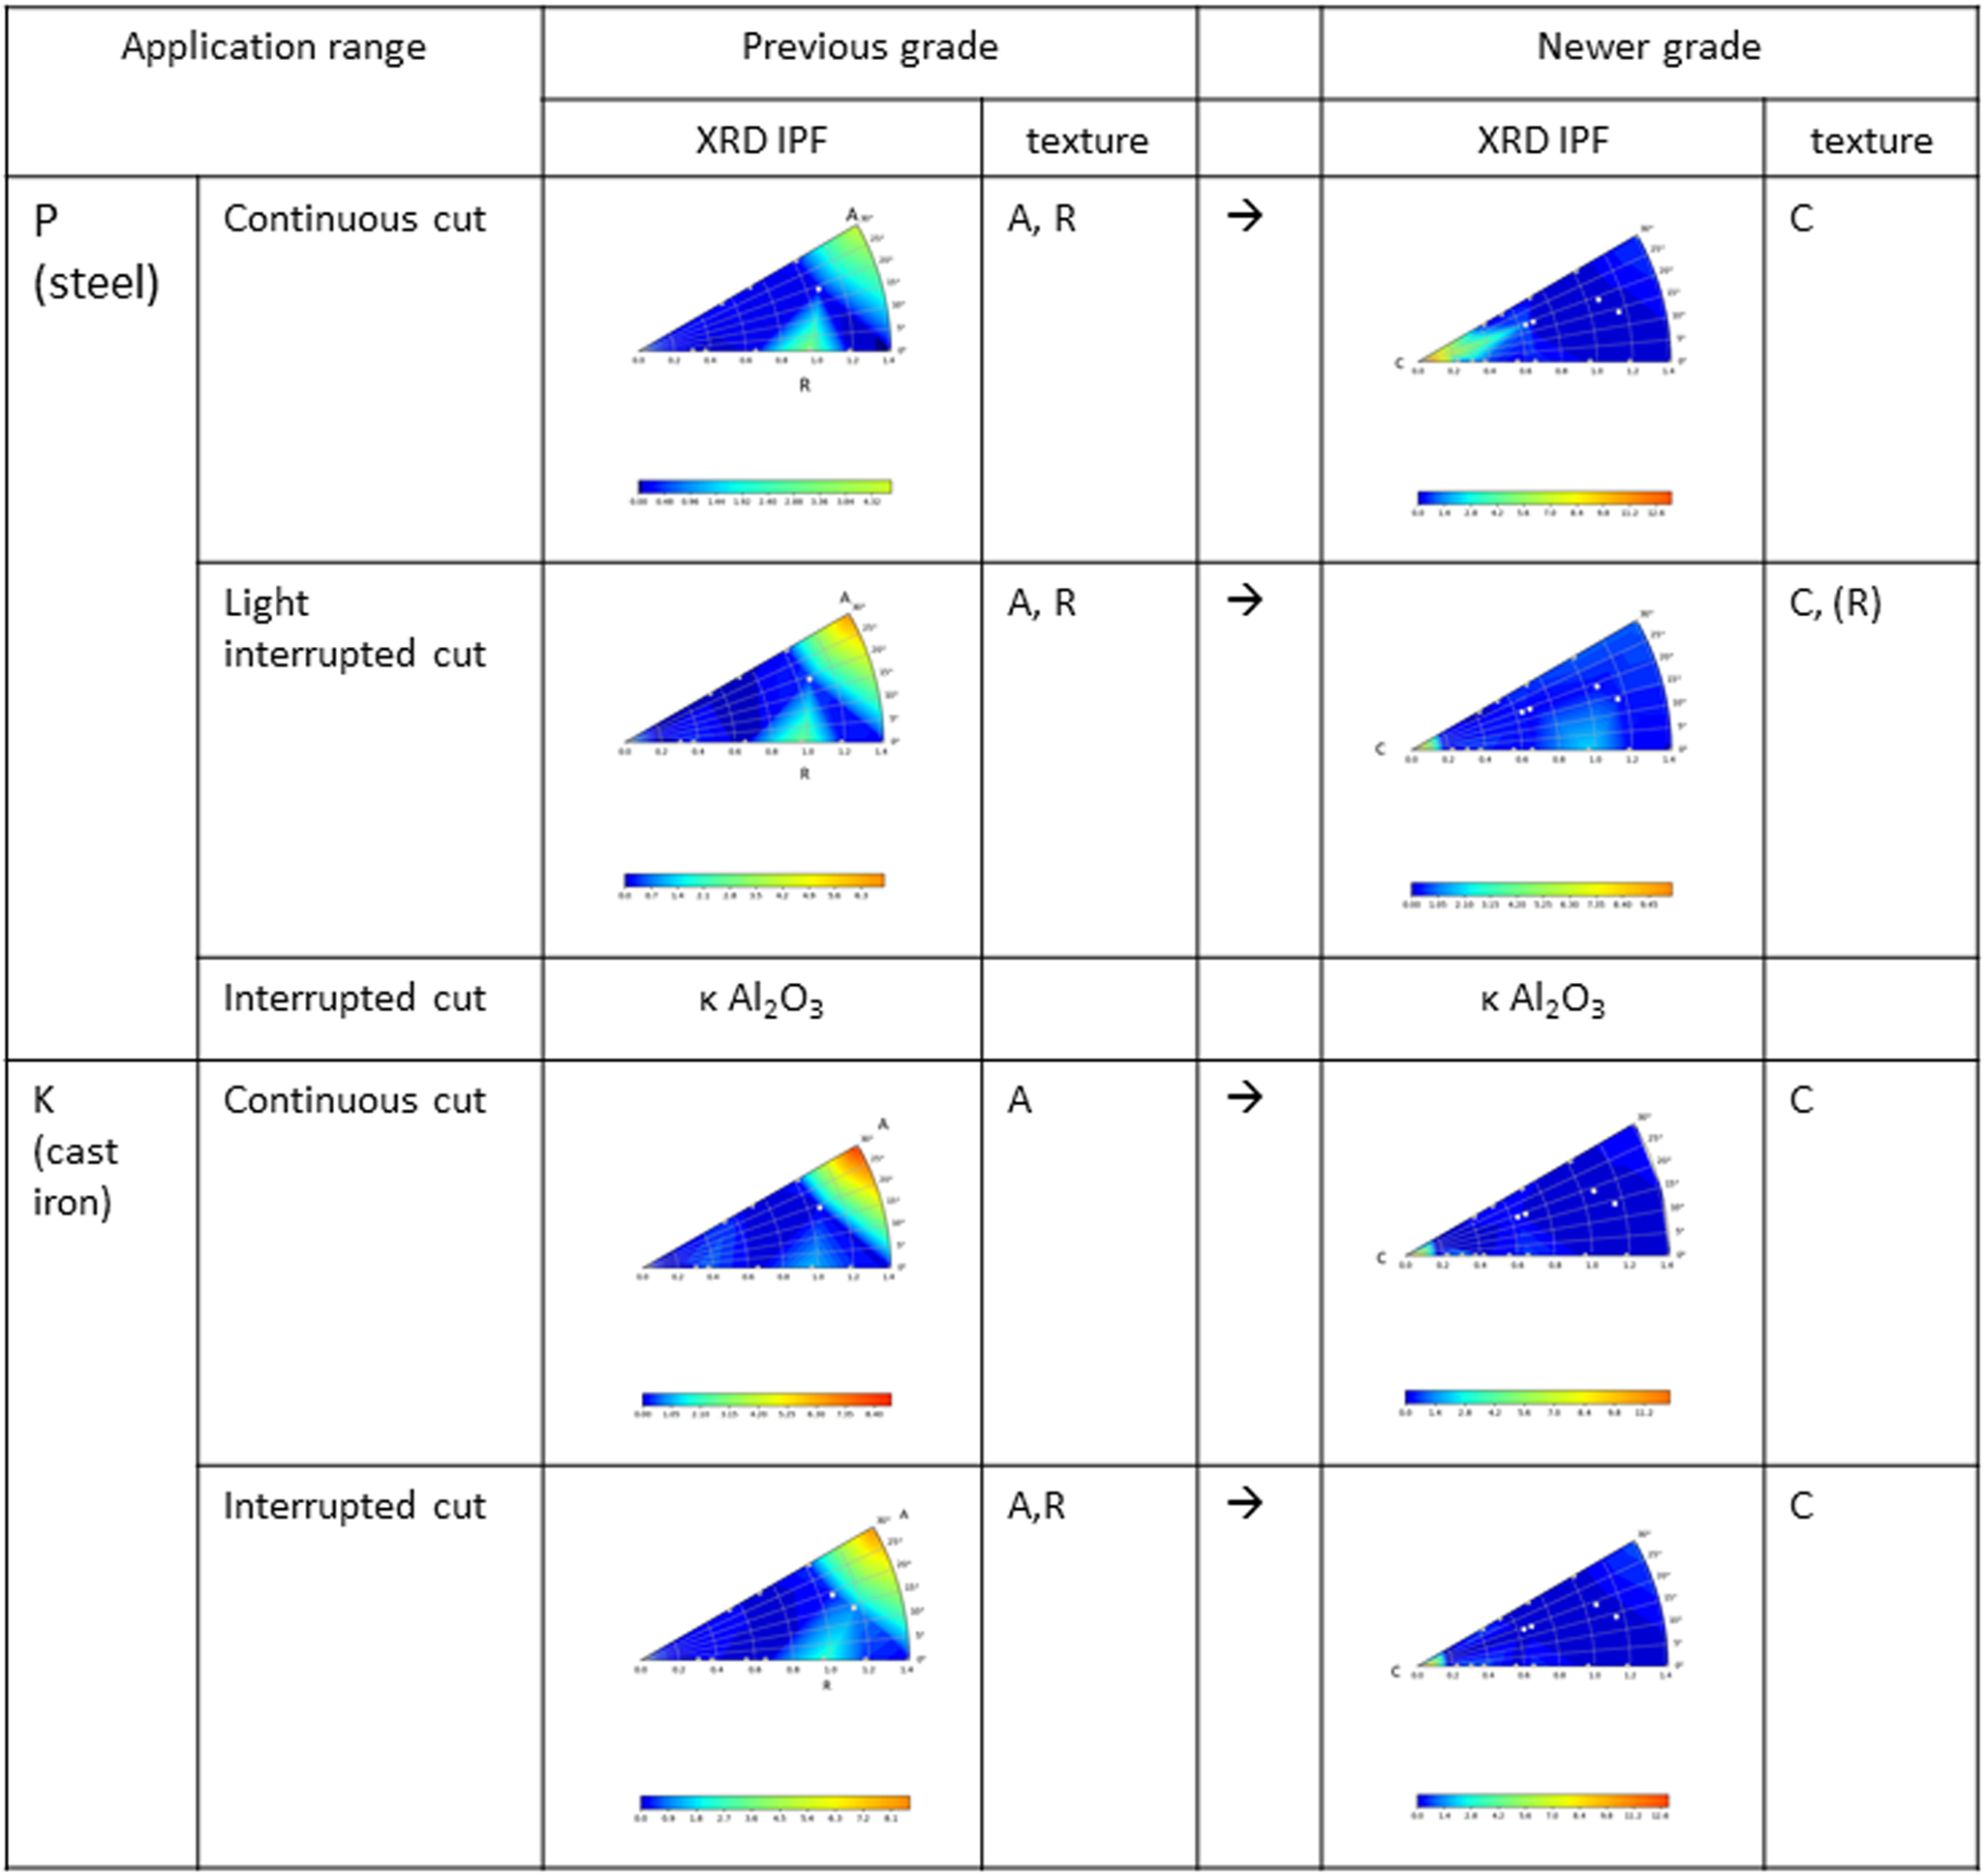
Figure 4. Comparison of the IPF for a vender A, previous and newer grade with different application ranges. $\sqrt I$ is plotted for XRD IPF. Previous grades of A, R textures were replaced by C texture for newer grades for these application ranges.
IV. DISCUSSION
There are a couple of notes for comparison of the different grades.
A. Outer Ti(C)N layer
The effect of outer Ti(C)N layers modified the intensity of α-Al2O3 peak intensities by absorption. This layer is typically 1–2 μm. Intensity correction, by multiplying exp((2μ Ti(C)Nt Ti(C)N)/sinθ) with μ Ti(C)N, t Ti(C)N being the absorption coefficient and thickness of outer layers, respectively, may be possible, but was not studied in this paper.
B. Peak intensity evaluation method
Stylianou et al. (Reference Stylianou, Tkadletz, Schalk, Penoy, Czettl and Mitterer2019) studied the TC variation by selecting the different ICDD cards, integrated intensities vs. peak height, etc. The TC values largely depend on these selections. The strain/stress state can alter these evaluations for TChkl significantly with a rapid decrease of peak height with 2θ when microstrain or crystallite size effects are present. The strain and residual stress of the α-Al2O3 introduced by post-coat processes may alter the TC results. The IPF mapping, which is more qualitative visual representations for the present purpose, is relatively insensitive to these variations, and the trend of textures are still discernible. Note that errors from the normalization may be minimized when an appropriate reference PDF card is chosen; ICDD editor reviewed star quality reference card would be a good choice since factors influencing intensities, such as data quality and experimental conditions, were also reviewed.
C. Statistics for the evaluation of small intensity peaks
Since the diffraction peak intensity of the random distribution  $I_0^{hkl} \;$ varies with (hkl), the uncertainties of the TC for (hkl) also varies. The uncertainty of the TC for (h 0k 0l 0) plane
  $( {\rm \Delta }( TC^{h_0k_0l_0}) )$ is proportional to the inverse of
  $I_0^{h_0k_0l_0}$, therefore, when the diffraction intensity of the random distribution
  $I_0^{h_0k_0l_0}$ is small,
  ${\rm \Delta }( TC^{h_0k_0l_0})$ becomes large as shown in Eq. (3)
 $${\rm \Delta }( TC^{h_0k_0l_0}) \cong \displaystyle{1 \over {( {1/n} ) \times \sum\nolimits_{( hkl) }^n {( {I^{hkl}/I_0^{hkl} } ) } }} \times \;\displaystyle{{{\rm \Delta }I^{h_0k_0l_0}} \over {I_0^{h_0k_0l_0} }}\;\;$$
For small intensity peaks  $\;I_0^{h_0k_0l_0}$, the background noise level fluctuation may be translated to the large uncertainty of the texture coefficient
  ${\rm \Delta }( TC^{h_0k_0l_0})$ ~ 1. To avoid this, enough statistics need to be taken until the level of the background level is reasonably flat in the range of the corresponding peaks.
D. Limitation of the hkl reflections
Another limitation is the number of points in the IPF map is inevitably limited. This creates rather rough color mapping. For the α-Al2O3 case, the points are denser along (11 l), and (10 l) lines, and the center region is scarce. It might be possible to measure rocking curves of several peaks and estimate the sharpness of each reflection and incorporate this information in the map (Vaudin et al., Reference Vaudin2001).
V. CONCLUSION
Despite several differences, IPF maps based on XRD powder diffraction qualitatively represents the texture of metal cutting inserts. The textures of α-Al2O3 can be mostly classified as C (basal), R (rhombohedral), and A (pyramidal) planes in the direction of coatings. We could include all these typical planes into the analysis, which may be a reason we could obtain qualitatively good agreement between XRD and SEM results. The XRD powder diffraction-based IPF is a quick method and useful for the metal cutting industries for α-Al2O3 coatings. In particular, when the intensity was plotted as  $I, \;\,\sqrt I , \;\,{\rm and}\,\root 4 \of I$, the crystal orientation of nondominant direction can also be discernible. This work will further be investigated with the relations with cut performance and application range and historical transition.
ACKNOWLEDGEMENTS
T.S. acknowledges Loretta Bell, Kalissa Andre, Karen Harris, Peter Leicht, and Binky Sargent for fruitful discussion. T.S. acknowledges Larry Meenan for legal review of the manuscript, Kalissa Andre for providing SEM results, and Mike Beblo for all the historical data before 2015. Reviewer of the manuscript is also acknowledged for providing many useful suggestions prior to publication.
CONFLICTS OF INTEREST
The authors have no conflicts of interest to declare.


