


Preface
This publication was written to commemorate the late Associate Professor Frank Reith – our colleague, mentor and friend. Frank's research focused primarily on understanding the interactions between bacteria and gold; however, he strove to diversify and expand gold biogeochemistry research. In 2006, Frank joined the Commonwealth Scientific and Industry Research Organization (CSIRO) and his research group (Microbes and Heavy Metal) remained integrated at the CSIRO Waite Campus (Urrbrae, South Australia). After working alongside Dr Anupama Kumar for nearly a decade at CSIRO, they developed a collaborative research project that bridged the disciplines of gold biogeochemistry with ecotoxicology. In doing so, members of the Microbe and Heavy Metal and CSIRO's Environmental Contaminant Mitigations and Biotechnologies Programme collaborated. Together, these groups brought this study to fruition despite Frank's lamentable absence. While this study is fundamental in its outcomes, it highlights the potential for developing further interdisciplinary collaborations to address issues related to ecotoxicology and assessing the impact of anthropogenic activity on natural environments.
Introduction
In natural environments, gold nanoparticles (AuNPs) are associated with clay minerals on the surface of placer gold particles. Some of these AuNPs appear semi-spherical but are actually euhedral crystals ranging from 10s to 100s of nm in size and contribute to secondary gold enrichment on the surface of particles (Reith et al., Reference Reith, Brugger, Zammit, Nies and Southam2013 and references therein; Shuster et al., Reference Shuster, Reith, Cornelis, Parsons, Parsons and Southam2017). On the contrary, synthesised AuNPs are colloidal and ≤100 nm in size. The first evidence of AuNPs applications date back to ‘ancient’ Arabia, China and India where colloidal solutions were used as medicinal elixirs. During the Middle Ages in Europe, the use of colloidal solutions as treatments for a variety of illnesses continued. For example, King Louis XIII of France was given a colloidal gold solution as an elixir for longevity by the alchemist David de Planis-Campy (Dykman and Khlebtsov, Reference Dykman and Khlebtsov2011). It was not until the 1970s when AuNPs were used in practical biomedical applications; specifically imaging antigens on the surface of Salmonellae sp. using electron microscopy (Dykman and Khlebtsov, Reference Dykman and Khlebtsov2011). Since then, the use of AuNPs in biomedical application has diversified (e.g. clinical chemistry to targeted drug delivery) and has been also used in electronic as well as cosmetic applications (Chen et al., Reference Chen, Li, Wang, Baltzer and Copponnex2014; Bhagyaraj and Oluwafemi, Reference Bhagyaraj, Oluwafemi, Bhaygaraj, Oluwatobi, Kalarikkal and Thomas2018). As the number of applications involving AuNPs continues to increase, it is reasonably foreseeable that some AuNPs could inadvertently contaminate natural environments. The need to assess the potential impacts of precious metals on the environment has already been highlighted by the use of silver nanoparticles in commercial products (i.e. Khaksar et al., Reference Khaksar, Jolley, Sekine, Vasilev, Johannessen, Donner and Lombi2015). Synthetic AuNPs could enter aquatic environments directly from industrial manufacturing or from waste materials. In aquatic environments, various plants, crustaceans, or fish could potentially come in contact with AuNPs. Previous studies have investigated how short-term nanoparticle exposures affect organ development or cause mortality (acute toxicity) in a variety of organisms (Alkilany and Murphy, Reference Alkilany and Murphy2010). Fish are sensitive to environmental stressors especially during early development (i.e. larval stage). For example, physiological defects during the larvae stage could potentially impair reproduction once the fish has reached maturity thereby impacting on fish populations. Golden perch (Macquaria ambigua) is a type of freshwater fish that is native from central to southeast Australia and is often used in recreational sport fishing (Carragher and Rees, Reference Carragher and Rees1994). Golden perch spawn during the spring or summer and the fecundity of a mature golden perch can be up to 500,000 eggs. Fertilised eggs are 3–4 mm in diameter, colourless and semi-buoyant. Larvae emerge after 24 h and have a yolk-sac. Larvae start feeding 6–7 days post-hatch and are fully developed after 18–20 days. Although growth can be variable, full maturity in males and females is reached at 3–4 and 6 years old, respectively, and adult fish can reach up to 50 cm in length (Reynolds Reference Reynolds1983; Mallen-Copper et al., Reference Mallen-Cooper, Stuart, Hides-Pearson and Harris1995; Harris and Rowland, Reference Harris, Rowland and McDowall1996). The presence of dams has inhibited the migration of adult fish to spawning grounds, which has led to decreased populations or resulted in complete disappearance in some regions. Therefore, golden perch was listed as a vulnerable species under the Victorian Flora and Fauna Guarantee Act 1988. To date, there is paucity of research on the effects of gold (aqueous or nanoparticulate) on golden perch larvae. Based on the above information, the following hypotheses were tested: exposure to gold nanoparticles does not result in adverse effects in golden perch larvae (null hypothesis), exposure to gold nanoparticles results in adverse effects such as abnormalities in golden perch larvae (alternate hypothesis I), the severity of effects depends upon the size of gold nanoparticles (alternate hypothesis II). Overall, the aim of this project was to determine the effect of short-term exposures to different concentrations and different size AuNPs on golden perch larvae under controlled laboratory conditions.
Materials and methods
Fish larvae and sources of gold
One-day old golden perch larvae were purchased from a fisheries station (Narrendera, NSW Australia) and assessed for physical abnormalities before experimental use. No abnormalities were observed. Pure (≥99.9%) gold chloride (AuCl3) was purchased from Alfa Aesar (Victoria, Australia). A measured 5 μM gold stock solution was prepared by dissolving gold chloride into deionised water. The gold stock solution was twice filter-sterilised using 0.1 μm pore-size filters and stored in a sealed Schott bottle wrapped in aluminium foil to prevent photocatalytic reduction of gold. Pure gold nanoparticles (AuNPs with 5 or 50 nm diameters) suspended in deionised water were purchased from Nanopartz Inc. (Colorado, USA). Prior to experimental use, the vials were placed in a Powersonic Ultrasonic water bath for ~10 s to ensure that the AuNPs were dispersed in solution.
Experiments: fish larvae–gold systems
All experiments were based on the Organisation for Economic Co-operation and Development guidelines (1998) Test No. 212: Fish, short-term toxicity test on embryo and sac-fry stages and conducted under CSIRO Animal Ethics Committee Project Number 817. Two types of experiments were constructed using sterile borosilicate glass beakers containing fish larvae in 50 mL of deionised water (pH 7.7 ± 0.3) and gold. Experiment 1 involved the exposure of 10 fish larvae to 0.05 μM gold. In these fish larvae–gold systems, gold occurred as either aqueous gold (AuCl3), 5 nm AuNPs, or 50 nm AuNPs. In Experiment II, fish larvae were exposed to higher concentrations (5 or 50 μM) of 5 or 50 nm AuNPs. A control containing 10 larvae and 50 mL deionised water was performed in parallel with Experiments I and II. All fish larvae–gold systems and controls were incubated in a 16 h light/8 h dark cycle incubator for six days at 23 ± 2°C. Each concentration included four replicates (beakers). During semi-static exposure, solutions were replaced every 24 hrs. Dissolved oxygen and pH of all systems were monitored using a CyberScan multi-meter with pH calibrated to 4.0, 7.0 and 10.0 reference standards. Any morphological changes or deceased fish larvae were recorded. During the exposure period, deceased fish larvae were removed from the respective beakers to avoid contamination. These larvae were individually placed in 1 mL-volume Eppendorf tubes containing deionised water, and were snap frozen using liquid nitrogen. After seven days of incubation, all remaining larvae were individually snap frozen.
Ten snap-frozen larvae, selected randomly from each larvae–gold system and control, were transferred to 10%(aq) formalin for at least 24 hours to defrost whilst preserving their cellular structure. These ‘fixed’ larvae were imaged using an Olympus SZX9 stereomicroscope equipped with an Olympus SC180 digital camera and Olympus LG-PS2 light source. Yolk-sac width and height were measured using the Olympus Image Analysis Software and known pixel dimensions. The larvae were kept in formalin for preparation for scanning electron microscopy analysis (described below).
Enzymatic activity analysis
To assess the stress response of larvae exposed to gold, enzyme (catalase, glutathione reductase and glutathione S-transferase) activity assays were performed. From each larvae–gold system and control, five larvae were selected randomly and pooled to represent each system. Pooled larvae were placed in 200 μL of 100 mM potassium phosphate buffer (pH 7.0) and pulverised using a bead beater to homogenise the sample. The homogenised samples were centrifuged (14,000 rpm for 15 minutes at 4°C) and the supernatants (i.e. enzyme extract) were collected. Total protein context of the enzyme extracts was estimated according to method defined by Bradford (Reference Bradford1976) using bovine serum albumin (Sigma Aldrich) as a standard.
Catalase (CAT) activity was determined by hydrogen peroxide (H2O2) decomposition in the method defined by Aebi (Reference Aebi1984). In doing so, a reaction mixture was made by adding 100 mM phosphate buffer (pH 7.0) and 20 mM H2O2 to an aliquot of the enzyme extract. The change in absorbance at 240 nm was measured using a Molecular Devices Spectramax 340 Microplate Reader and Spectrophotometer. Catalyse activity was calculated (equation 1) using the change in absorbance over time (ΔA/t) with t = 1 minute and the extinction coefficient (ɛmM) for H2O2 = 43.6M–1 cm–1. Concentrations were then converted to mU mg–1 based on the estimated total amount of protein content of the enzyme extract (equation 2).
 $$U\;\rm {mL}^{{-}1} = \displaystyle{{\left({\displaystyle{{\Delta {\it A}_{{\rm sample}\;}-\;\Delta {\it A}_{{\rm blank}}} \over {\it {t}\;\times \;\rm {\lpar {dilution\;factor} \rpar} }}} \right)} \over \rm {{\varepsilon ^{mM}\;\times \;\lpar {sample\;volume\;in\;mL} \rpar} }}$$
 $$U\;\rm mg^{{-}1} = \displaystyle{{{\it U}\;mL^{{-}1}\;of\;glutathione\;reductase} \over {mg\;of\;protein\;in\;mL^{{-}1}of\;sample}}$$
For the glutathione reductase (GR) assay, a modified method by Smith et al. (Reference Smith, Vierheller and Thorne1988) was performed. A reaction mixture was made by adding phosphate buffer, 2 mM oxidised glutathione disodium salt (GSSG), 2 mM β-nicotinamide adenine dinucleotide phosphate (NADPH) and 3 mM 5,5-dithiobis-2-nitrobenzoic acid (DTNB) to an aliquot of the enzyme extract at 25°C. Using the same spectrophotometer, the change of absorbance at 412 nm of the reaction mixture was measured. Glutathione reductase activity was calculated (equation 1), using the change in absorbance over time (ΔA/t) with t = 10 minutes and the extinction coefficient (ɛmM) of 5-thio-2-nitrobenzoic acid (TNB, a by-product of the reaction mixture: 14.15 mM–1 cm–1), and converted to mU mg–1 (equation 2).
Glutathione S transferase (GST) assay was performed in a method modified from Drotar et al. (Reference Drotar, Phelps and Fall1985) by adding phosphate buffer, 40 mM 1-chloro-2,4 dinitrobenzene (CDNB) and 10 mM glutathione (GSH) to an aliquot of the enzyme extract at 25°C. Using the same spectrophotometer, the change in absorbance at 340 nm was measured. The GST activity was calculated using the same equations mentioned previously with the change in absorbance over time (ΔA/t) with t = 20 minutes and the extinction coefficient (ɛmM) of CDNB (9.6 mM–1cm–1).
Inductively coupled plasma-mass spectroscopy
Four snap-frozen larvae from Experiment I, Experiment II (involving exposures to 50 μM AuNPs), and the respective controls were selected randomly to determine the average concentration of gold within larvae. Three of the larvae replicates were individually placed in concentrated aqua regia (3 parts 37%(aq) HCl to 1 part 70%(aq) HNO3) to completely digest the larvae and AuNPs. Note that the fourth replicates were used for single-particle inductively coupled plasma mass spectroscopy (ICP-MS, described below). Gold concentrations were measured using an Agilent 5100 Synchronous Vertical Dual View ICP-MS calibrated with gold standards. The average number of AuNPs within larvae was calculated using measured gold concentrations, particle sizes (5 or 50 nm diameters) and known unit cell dimensions.
The fourth larvae replicates were used to identify any changes in AuNPs size using single-particle inductively coupled plasma mass spectroscopy (SP-ICP-MS) and a method modified from Rea et al. (Reference Rea, Shuster, Kumar, Reith and Stephan2020). Briefly, larvae were individually digested in 30%(aq) tetramethylammonium hydroxide (TMAH) for 24 hours to dissolve the fish larvae but not the AuNPs. Samples were diluted (1.0%(aq) final concentration) using fresh TMAH and analysed using a PerkinElmer NexION™ 350D SP-ICP-MS calibrated with gold standards. Four AuNPs solutions (20, 40, 60, or 80 nm size AuNPs, British Biocell International, UK) were also used as reference standards. All data were processed using the Nano Application Module Syngistix™ software.
Scanning electron microscopy-energy dispersive spectroscopy
After light microscopy analysis the same formalin-fixed larvae were imaged using a scanning electron microscope (SEM) to characterise how AuNPs were associated with larvae. In doing so, fish larvae were prepared for energy dispersive spectroscopy (EDS) analysis using a method modified from Shuster et al. (Reference Shuster, Southam, Reith, Kenney, Veeramani and Alessi2019). Briefly, larvae were individually and sequentially incubated in ethanol solutions (50, 75, 90%(aq) and 100%) for 15 minutes at each concentration. The larvae were transferred to a solution containing100% ethanol and 100% hexamethyldisilazane (HMDS) with a 1:1 ratio and incubated for 30 minutes. The larvae were transferred to 100% HMDS and incubated for an additional 30 minutes; this step was repeated albeit with a 15 minutes incubation. After the final incubation, the samples were air-dried for 24 hours, placed on aluminium stubs using carbon adhesive tabs and coated with carbon (10 nm thick). The larvae were imaged using a FEI DualBeam focused ion beam (FIB) SEM equipped with an Oxford Instrument energy dispersive X-ray spectrometer (EDXS). Micrographs were taken in secondary electron (SE) and back-scatter electron (BSE) mode using 10 and 20 keV, respectively.
Results
Yolk-sac morphology
Overall, the presence of aqueous gold or AuNPs correlated with increased yolk-sac height and width (i.e. relative size) from larvae in both types of experiments. From Experiment I, larvae exposed to 0.05 μM aqueous gold had yolk-sacs that were 0.03–0.12 mm bigger in width compared to larvae from the control and larvae exposed to 0.05 μM AuNPs, respectively (Fig. 1). Larvae from Experiment II had the greatest increase in yolk-sac size; 0.86 and 0.83 mm in width and height, respectively. Compared to the control, larvae exposed to 50 μM of 5 nm AuNPs had yolk-sacs that were ~ 1.5 times larger. By measuring the angle of the notochord above the yolk-sac, larvae from the control had an average 147° angle. Larvae exposed to 50 μM of 5 nm AuNPs had an average 132° angle thereby giving them a forward bending arched shape (Fig. 1).
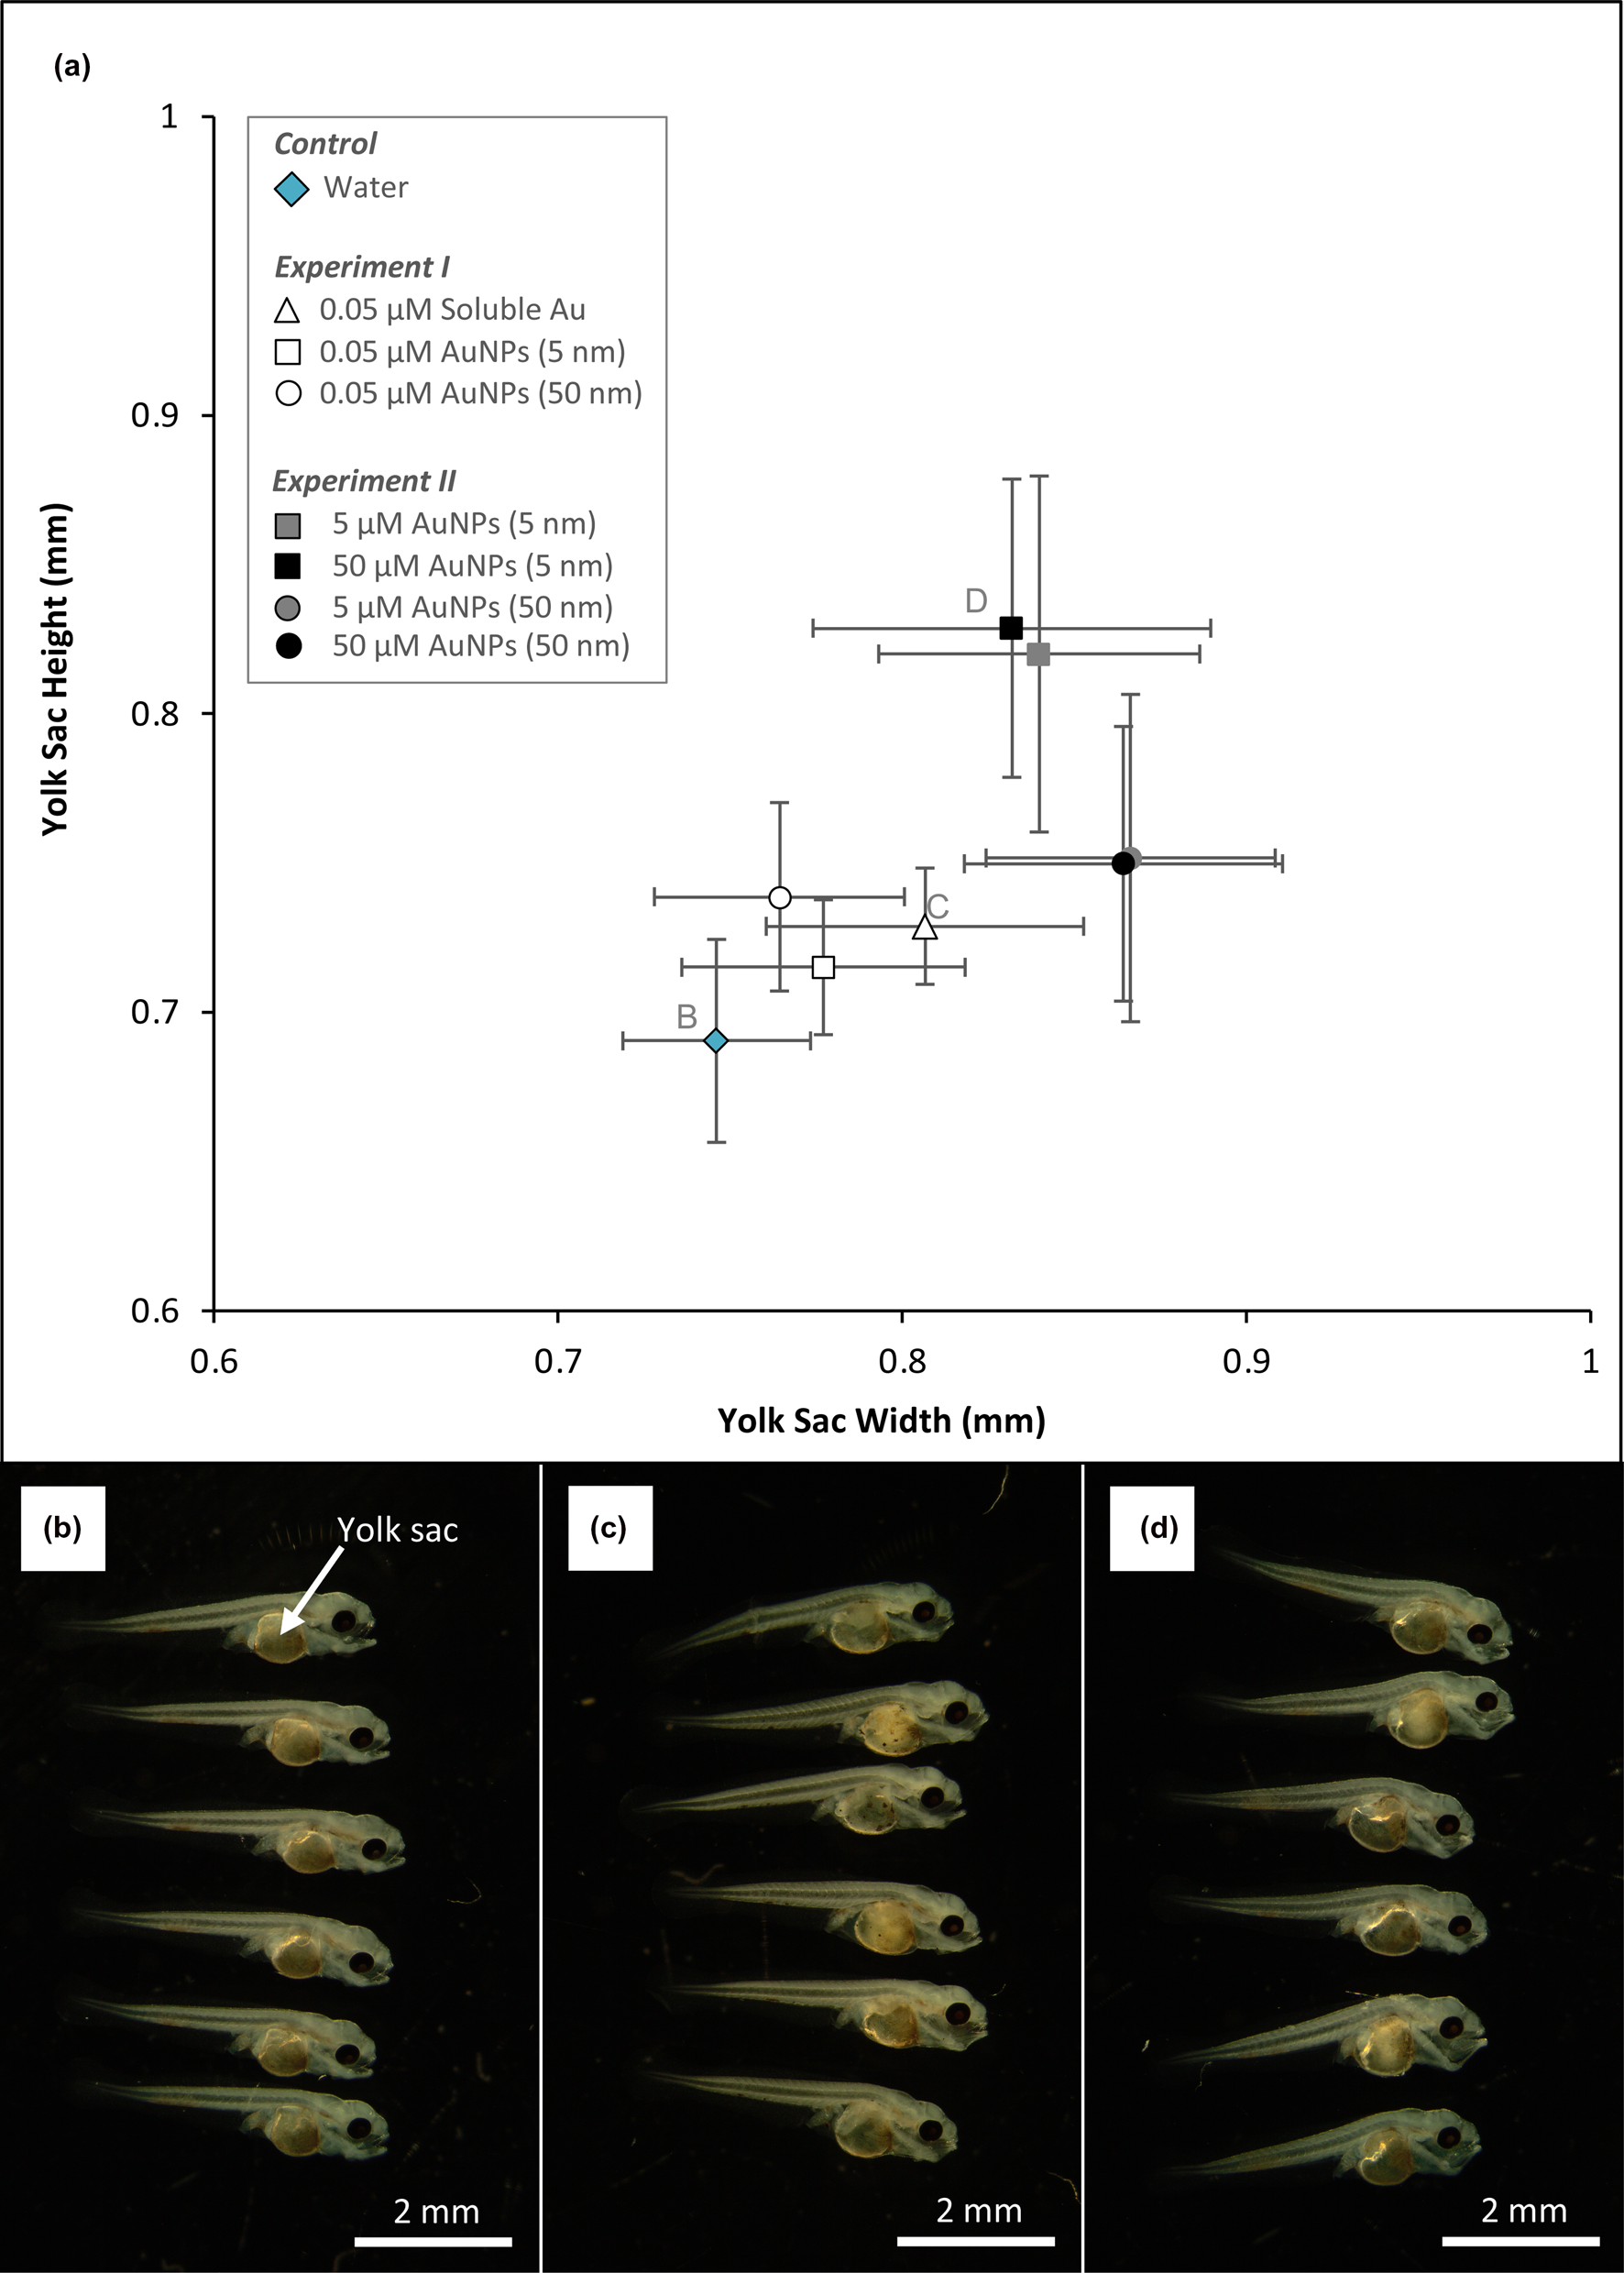
Fig. 1. (a) Changes in yolk-sac height and width of larvae from Experiments I and II and the control. (b) A photograph of fish larvae from the control; (c) exposed to 0.05 μM aqueous gold for seven days; (d) exposed to 50 μM of 5 nm size AuNPs for three days.
Oxidative stress response
In general, fish larvae from the majority of experiments contained protein concentrations that were within the range detected from the control system across all enzyme (CAT, GR and GST) assays. Of these assays, catalase had both the greatest average protein concentrations as well as greatest range. In terms of nanoparticle size, protein concentrations were generally more variable from larvae exposed to 50 nm AuNPs relative to larvae exposed to 5 nm AuNPs.
From Experiment I, larvae exposed to 0.05 μM aqueous Au contained average CAT, GR and GST concentrations that were 12, 7 and 3 mU mg–1 greater, respectively, compared to the control. Larvae exposed to 0.05 μM of 5 nm AuNPs had average CAT and GST and GR concentrations that were similar to the controls. Larvae exposed to 0.05 μM of 50 nm AuNPs, however, had an average CAT concentration that was 20 mU mg–1 greater than the control. In this same system, the average GST concentration had little change while the average GST concentration was 3 mU mg–1 relative to the control. Between larvae–gold systems, CAT concentrations from larvae exposed to 0.05 μM aqueous gold or 50 nm AuNPs were similar (Fig. 2, Experiment I).

Fig. 2. Indicators of stress based on protein concentrations measured from fish larvae using catalase (CAT), glutathione reductase (GR) and glutathione S-transferase (GST) assays.
From Experiment II, larvae exposed to 5 μM of 5 nm AuNPs had average CAT, GR and GST concentrations that were 12, 2 and 4 mU mg–1 less compared to the control. Larvae exposed to 50 μM of 5 nm AuNPs had an average CAT concentration similar to the control whereas average GR and GST concentrations from this system were 6 and 3 mU mg–1 greater, respectively, compared to the control. The enzyme assays were similar for larvae that were exposed to 5 or 50 μM concentrations. Larvae exposed to 5 μM of 5 nm AuNPs had average CAT, GR and GST concentrations that were 9, 1 and 2 mU mg–1 less, respectively, compared to the control. Larvae exposed to 50 μM of 50 nm AuNPs had an average CAT concentration 4 mU mg–1 less than the control and an average GST concentration 1 mU mg–1 greater than the control (Fig. 2, Experiment II).
Larvae mortality
In terms of total mortality, 10% of fish larvae died in the control after 6 days. All the larvae–gold systems from Experiment I had total mortalities less than the control at the end of the experiment. Total mortality was the same for larvae exposed to 0.05 μM aqueous Au or 50 nm AuNPs (9%), whereas larvae exposed to 5 nm AuNPs was the lowest (4%). Total mortalities in the larvae–gold systems from Experiment II were higher compared to the control. In general, 5 nm AuNPs appeared to be more lethal than 50 nm AuNPs. Larvae exposed to 5 μM or 50 μM of 50 nm AuNPs had 18% and 19% total mortality, respectively, whereas larvae exposed to 5 μM or 50 μM of 5 nm AuNPs had 23% and 100%, respectively (Fig. 3). It is important to note that the fish larvae–gold system with 100% total mortality occurred after 2 days and were the same fish larvae with ‘swollen’ yolk-sacs.

Fig. 3. Total mortality of fish larvae from Experiments I and II and the control over time.
Gold accumulation and distribution within fish larvae
The 0.05 μM AuNPs concentrations used in Experiment I contained 7.82 × 10¹² of 5 nm AuNPs and 7.82 × 10⁹ of 50 nm AuNPs, respectively, whereas the 50 μM AuNPs concentrations used in Experiment II contained 7.82 × 10¹⁵ of 5 nm AuNPs and 7.82 × 10¹² 50 nm AuNPs. See Table 1 for calculations regarding the number of AuNPs for each concentration. Based on ICP-MS analysis, greater detections of gold within larvae correlated with exposures involving higher concentrations. In terms of moles, larvae exposed to 0.05 μM aqueous gold contained the highest amount of gold (6.24 × 10⁻¹⁰ moles Au in 10 larvae), which was 25% of aqueous gold removed from solution. Comparatively, larvae exposed to 0.05 μM of 5 or 50 nm AuNPs, removed 8% and 1%, respectively. Larvae exposed to 50 μM of 5 or 50 nm AuNPs, from Experiment II, removed ≤0.1% (Table 2).
Table 1. Calculations for determining the number of AuNPs in 0.05 and 50 μM concentrations.

a AuNP Volume = (4/3) π (r 3). Note that r is half the respective diameter for each AuNP.
b Unit cells per AuNP = a ÷ Unit cell of gold (6.79 × 10⁻² nm3). Note that gold has a cubic unit cell with a length of 4.08 × 10⁻¹ nm; hence, the volume is 6.79 × 10⁻² nm3.
c Au atoms per AuNP = b × 4 atoms per unit cell of gold
d Au moles per AuNP = c ÷ Avogardo's number (6.022 ×10²³).
e Number of AuNP = ((0.05 or 50 μM) ÷ (1.0 ×10⁶)) ÷ d.
Table 2. Calculations for determining the average number of AuNPs within fish larvae from the lowest and highest exposure concentrations.

a Au Concentrations measured by ICP-MS
b Au Mass per Larvae = (a ÷ 1.0 ×10³) × average larvae mass (1.17 ×10⁻⁶ kg)
c Gold Moles per Larvae = b ÷ molar mass of gold (196.96657 g mol–1)
d AuNPs per Larvae = c ÷ (Au moles per AuNP Table 1a)
e Percent Gold Uptake = (c ×10 larvae) ÷ (Au moles in 50 mL fish larvae–gold system). Note that 0.05 μM is 2.50×10⁻⁹ Au mols per 50 mL and 50 μM is 2.50×10⁻⁶ Au mols per 50 mL.
*Reduction of soluble gold resulted in a range of AuNP sizes. See Fig. 4.
Analysis by SP-ICP-MS indicated that aqueous gold was reduced to elemental AuNPs ranging between 20 to 150 nm in diameter. Though the distribution was somewhat normal, the majority of these nanoparticles were within 41 to 45 nm in size. The 5 nm AuNPs appeared to form aggregates up to 150 nm in size; however, aggregates between 21 to 25 nm and 41 to 45 nm were most frequent. Similarly, 50 nm AuNPs also formed aggregates that were comparable in size to those comprised of 5 nm AuNPs. In addition to aggregation, the detection of 50 nm AuNPs had a subtle peak indicating smaller nanoparticles with diameters between 31 to 35 nm (Fig. 4).

Fig. 4. Size distribution of AuNPs within fish larvae. Note that detection frequencies are the sum of the two concentrations (0.05 and 50 μM) for each respective AuNPs size.
High-resolution SEM and corresponding EDS confirmed that aqueous gold was reduced as AuNPs within fish larvae. These nanoparticles along with 5 nm AuNPs formed aggregates within cells comprising the epidermis and fin. Aggregated AuNPs appeared to form larger clusters up to 1 μm in size (Fig. 5). Note that 50 nm AuNPs were not observed within cells of the epidermis or fin. A summary of all larvae–gold systems and the different analytical techniques can be found in Table 3.

Fig. 5. (a) A representative energy-dispersive spectrum confirming that aqueous gold was reduced to elemental AuNPs within fish larvae; (inset) a corresponding low-magnification back-scatter electron (BSE) micrograph of fin cells containing reduced aqueous gold. (b) A low-magnification BSE-SEM micrograph of 5 nm AuNPs aggregated (arrows) within cells of a dorsal fin. (c) A high-magnification BSE-SEM micrograph of an aggregated 5 nm AuNPs in epidermis cells. (d) The aggregates appear to form a larger cluster.
Table 3. A summary of larvae–gold systems (i.e. treatment) and the number of larvae used for each analysis.

* Each larvae–gold system involved 100 larvae.
** These were the same larvae.
Discussion
Gold-induced stress and the toxicity of AuNPs
The lipophilicity of yolk-sacs prevents solutes from permeating the internal environment; however, some compounds can passively enter cells comprising the yolk-sac (Sant and Timme-Laragy, Reference Sant and Timme-laragy2018). For example, nanoparticulate materials, such as ZnO and SiO2, have been shown to cause yolk-sac edema (swelling) in zebrafish embryos (Choi et al., Reference Choi, Kim, Yoon and Kim2016; Chao et al., Reference Chao, Huang, Chen and Huang2017). Similarly, silver nanoparticles have been known to cause edema and physical abnormalities, as well as disrupting gill osmoregulation (Wu et al., Reference Wu, Zhou, Li, Liu, Wang and Jiang2010; Masouleh et al., Reference Masouleh, Amiri, Mirvaghefi, Ghafoori and Madsen2017). In this study, 5 nm AuNPs caused the greatest swelling of yolk-sacs (Fig. 1). Gold nanoparticles <10 nm in diameter can pass directly through cell membranes (Jiang et al., Reference Jiang, Huo, Mizuhara, Das, Lee, Hou, Moyano, Duncan, Liang and Rotello2015). Therefore, it is reasonable to suggest that both aqueous gold and the 5 nm AuNPs passively entered into the larvae. The latter form of gold, at higher concentrations, resulted in the most extensive yolk-sac edema, consequently impacting the larvae's notochords. The 50 nm AuNPs were too large to passively enter cells, which would explain the lack of detection using SEM. However, detection based on SP-ICP-MS and ICP-MS suggests that these particles could have been taken up through the mouth or gills. It is possible that the uptake of these AuNPs via the gills could have disrupted osmoregulation thereby resulting in yolk-sac swelling. From a biochemical perspective, the majority of larvae exposed to gold did not express high enzymatic activity (CAT, GR activity or GST activity) relative to the control. Golden perch are known to quickly acclimatise and recover from stress ranging from chronic to acute levels (Carragher and Rees, Reference Carragher and Rees1994). Therefore, it can be interpreted that these larvae were actively acclimatising to the presence of gold within the respective larvae–gold systems (Fig. 2). It is important to note that larvae exposed to aqueous gold expressed greater oxidative stress compared to the controls. Gold complexes, like other heavy metals, exert an oxidative stress on cells and have a strong affinity for sulfur-bearing compounds such as thiol (HS) functional groups in glutathione (Ortego et al., Reference Ortego, Cardoso, Martins, Fillat, Laguna, Meireles, Villacampa and Concepción Gimeno2014). The increased concentration of GR and GST in larvae exposed to aqueous gold could also suggest that cells were trying to replenish these S-bearing compounds that were ‘lost’ to aqueous gold. Additionally, this provides a possible mechanism for gold nanoparticle formation within cells, which was observed by SEM (biomineralisation discussed below). Overall, the ability of larvae to acclimate to stress is reflected in the low mortality rates where at least 75% of the entire population survived after 7 days (Fig. 3). From Experiment I, larvae mortality was similar yet more gold was detected within larvae exposed to aqueous gold compared to AuNPs, supporting the notion that solutes and particles <10 nm can cross cell walls/membranes (Table 1; Jiang et al., Reference Jiang, Huo, Mizuhara, Das, Lee, Hou, Moyano, Duncan, Liang and Rotello2015). Of the all the larvae–gold systems, the 50 μM concentration of 5 nm AuNPs (from Experiment II) was the most lethal and the amount of gold detected within these larvae represented <1% of the exposure concentrations. The rate of uptake of AuNPs was probably a sudden shock to the larvae hence the limited expression of stress (proteins) prior to death.
Gold mineralisation and AuNPs accumulation
The reduction of aqueous gold complexes, by organic compounds, generally produces a relatively normal distribution of nanoparticle sizes (Turkevich et al., Reference Turkevich, Stevenson and Hillier1951). Since this early study, various types of organic materials (bacteria, fungi and other chemicals) have been shown to reduce aqueous gold, forming nanoparticles (Shuster and Reith, Reference Shuster and Reith2018; Bohu et al., Reference Bohu, Anand, Noble, Lintern, Kaksonen, Mei, Cheng, Deng, Veder, Bunce, Power and Verral2019; Daruich De Souza et al., Reference Daruich De Souza, Nogueira, Elisa and Rostelato2019 and references therein). For example, aqueous gold can be reduced by fatty acid, a model organic compound, contributing to mineralisation, Reaction 1:
 $${\rm AuC}{\rm l}_3 + X {\hskip -1pt-}{\rm C}{\rm H}_3{\rm CO}{\rm O}^\ndash + 3{\rm O}{\rm H}^\ndash \to {\rm A}{\rm u}_{\lpar {\rm S}\rpar } + X {\hskip -1pt-}{\rm C}{\rm H}_2{\rm O}^\ndash + {\rm C}{\rm O}_2 + 2{\rm H}_2{\rm O} + 3{\rm C}{\rm l}^\ndash \eqno(1)$$
Additionally, the presence of heavy metals is known to increase the production of glutathione (Lu, Reference Lu2009; Townsend et al., Reference Townsend, Tew and Tapiero2003). In this study, aqueous gold was reduced as AuNPs with the majority occurring between 21–25 nm in diameter. It is reasonable to suggest that aqueous gold could have been binding with glutathione and could explain the increased enzymatic activity. Interestingly, these AuNPs did not appear to ‘coat’ the larvae indicating that the aqueous complex entered cells passively and biomineralisation occurred intracellularly, primarily with epidermis and fin cells that were in direct contact with water (Figs 3–5). Additionally, glutathione can serve as a molecular linker for AuNPs (Basu and Pal, Reference Basu and Pal2007; Chen et al., Reference Chen, Wang, Chen, Wang and Huang2012). The clustering of these AuNPs, including larvae exposed to 5 nm AuNPs, not only highlights the cellular uptake of gold but also its transport within cells, which is dependent on nanoparticle size (Liu et al., Reference Liu, Li, Liang, Li, Wang, Li, Lv, Chen, Song, Lee, Shi, Wang, Lal and Fan2017). This could also be important for AuNPs ‘transformation’ (dissolution and re-precipitation) within a cellular environment.
In regard to exposures to different size AuNPs, the ‘peak’ and ‘shoulder’ at 21–25 nm and 45–50 nm, respectively, could be attributed to aggregation of 5 nm AuNPs (Kim et al., Reference Kim, Lee, Joo and Lee2008) after extraction from larvae. On the contrary, the small peak at 31–35 nm for the 50 nm AuNPs could suggest that these nanoparticles were reduced in size within larvae prior to extraction. Cells produce hydrogen peroxide, a reactive oxygen species (ROS), as a stress response to contaminants such as heavy metals; hence the production of catalase to release oxygen from hydrogen peroxide subsequently reducing the concentration of this ROS (Schieber and Chandel, Reference Schieber and Chandel2014; Holmström and Finkel, Reference Holmström and Finkel2014). Inferred from increased catalase production, it is possible that hydrogen peroxide could have been a biochemical mechanism for AuNPs dissolution leading to smaller nanoparticle sizes (Reaction 2):
 $$2 {\rm A}{\rm u}^0 + {\rm H}_2{\rm O}_2\to 2 {\rm A}{\rm u}^ + { + } 2\,{\rm O}{\rm H}^\ndash \eqno(2)$$
Intuitively, solubilised gold would probably not remain stable and would, therefore, become reduced as smaller AuNPs (Fig. 4).
Implications for future ecotoxicological studies
In vitro experiments demonstrated that AuNPs are mobile within water columns, accumulate in the food web and therefore have the potential for similar mobility within natural environments (Ferry et al., Reference Ferry, Craig, Hexel, Sisco, Frey, Pennington, Fulton, Scott, Decho, Kashiwada, Murphy and Shaw2009). In light of this potential, measurable amounts of gold have been detected in wastewater treatment plants from communities with strong industrial activities related to mining, metal refining and jewellery production (Reeves et al., Reference Reeves, Plimer and Foster1999; Westerhoff et al., Reference Westerhoff, Lee, Yang, Gordon, Hristovski, Halden and Herckes2015; Vriens et al., Reference Vriens, Voegelin, Hug, Kaegi, Winkel, Buser and Berg2017). With increased AuNPs used in electronic and pharmaceutical applications, it is reasonable to suggest that gold from wastewater, if left untreated, will make its way back to the natural environment. This phenomenon has been observed with silver nanoparticles from commercial products (Lombi et al., Reference Lombi, Donner, Taheri, Tavakkoli, Jamting, McClure, Naidu, Miller, Scheckel and Vasilev2013). Although AuNPs are considered generally to be low-risk in terms of toxicity (Alkilany et al., Reference Alkilany and Murphy2010), the detection in wastewaters further highlights its social value and the need to steer future behaviours. The more that is known about AuNPs and their interaction with various organisms, the more prepared society will be to deal with environmental contamination.
The results from this present study broadly highlights the effects of gold on golden perch larvae. While this study provides information in regard to relative stress tolerance, future studies could involve golden perch at different growth stages (embryos or adult), a range of AuNPs sizes <10 nm, or different nanoparticle compositions (e.g. gold–silver alloy). Additionally, to prevent AuNPs from naturally aggregating, ligands such as citrate or alkanethiols are used as ‘capping’ agents (Frens Reference Frens1973; Brust et al., Reference Brust, Walker, Bethell, Schiffrin and Whyman1994). Depending on the amount of capping agent per nanoparticle, the concentration of ligands can be more toxic than the nanoparticles themselves (Ju-Nam and Lead, Reference Ju-Nam and Lead2008; Chen et al., Reference Chen, Hung, Lian and Huang2009; Perala and Kumar, Reference Perala and Kumar2013). Therefore, future studies could assess how ligands on ‘spent’ AuNPs (nanoparticles used for initial biomedical or technological purposes) could impact larvae and fish. Indeed, the increasing use of AuNPs and the potential for contamination in natural environments has been the incentive for assessing their effect on various organisms (e.g. Chen et al., Reference Chen, Hung, Lian and Huang2009; Zhang et al., Reference Zhang, Yang, Cai, Feng, Wang, Zhang and Pan2019 and references therein). Because AuNPs can adsorb to both organic and inorganic materials (Hanlie et al., Reference Hanlie, Liyun, Qiujuan and Yong2006; Zhu et al., Reference Zhu, Letaief, Liu, Gervais and Detellier2009; Feichtmeier et al., Reference Feichtmeier, Walther and Leopold2015), the occurrence of AuNPs in natural environments requires assessment to accurately determine ‘environmentally relevant’ concentrations that actually pose risks. Additionally, the chemistry of different natural water systems (wastewater, lakes and rivers) could influence the structure or chemistry of AuNPs or gold-alloy nanoparticles. Therefore, future studies could investigate how water chemistry could influence the toxicity of AuNPs using experimental systems (microcosms) that are more representative of natural environmental conditions. Dynamic modelling of AuNPs mobility within these environments would also complement future ecotoxicological studies to understand how uptake of dispersed AuNPs could differ from monodispersed AuNPs.
Conclusion
In this study, golden perch (Macquaria ambigua) larvae were exposed to gold for up to 6 days. The effect of gold was based on larval responses to aqueous gold, 5 nm AuNPs, or 50 nm AuNPs (Experiment I). Similarly, the relationship between AuNPs dosages and larval responses was also assessed (Experiment II). Overall, aqueous gold and 5 nm AuNPs are capable of entering epidermis and fin cells that are in direct contact to gold-bearing water, whereas 50 nm AuNPs were probably ingested. Both uptake mechanisms appear to have caused yolk-sac swelling with variable expression of oxidative stress enzymes. Though higher concentrations of smaller AuNPs were most lethal, the mortality within the other larvae–gold systems was comparable to the control suggesting that a fraction of the population would have been able to continue developing into adult fish. As a model, this study highlighted how larvae tolerate, or could acclimatise, to the presence of aqueous gold or AuNPs derived from anthropogenic use (biomedical and technological applications) that are not recovered from wastewater treatment. Additionally, this model could provide some insight on the tandem effects of alloy nanoparticles. Indeed, the extent of yolk-sac swelling, expression of stress proteins, and mortality rate would vary under in situ conditions, especially as biogeochemical processes could alter AuNPs structure as well as the chemistry of the coating, if present. In conclusion, this study provides a broad perspective of how fish larvae could be impacted by aqueous gold and AuNPs. The use of AuNPs in biomedical and electronic application continues to increase and diversify, which could inadvertently contaminate natural environments. Therefore, the potential for AuNPs to contaminate natural water systems is the motivation for assessing the effect of AuNPs on golden perch.
Acknowledgements
This research was based on the CSIRO AEC Project 817 and supported, in part, by the Australian Research Council (ARC) Future Fellowship (FT100150200) awarded to the late Frank Reith (c/o Jeremiah Shuster). Experiments and enzyme activity assays were performed at CSIRO Land and Water, Environmental Toxicology and Chemistry (Urrbrae, SA 5064, Australia). Scanning electron microscopy analysis was performed at Adelaide Microscopy, The University of Adelaide (Adelaide, SA 5005, Australia). Single-particle inductively coupled plasma mass spectroscopy analysis was performed at Flinders Analytical, Flinders University (Bedford Park, SA 5042, Australia). Inductively coupled plasma mass spectroscopy analysis was performed at CSIRO Analytical Services Unit (Urrbrae, SA 5064, Australia). We thank Hapreet Bhatia, Animesh Basak, Jason Young, John Gouzos and Claire Wright for their technical support.


