


Stakeholder theory has gained a prominent place in the management literature (i.e., Freeman, Harrison, Wicks, Parmar, & de Colle, Reference Freeman, Harrison, Wicks, Parmar and de Colle2010; Harrison, Barney, Freeman, & Phillips, Reference Harrison, Barney, Freeman and Phillips2019; Laplume, Sonpar, & Litz, Reference Laplume, Sonpar and Litz2008). Stakeholders are those “who can assist or hinder the achievement of the organization’s objectives” (Phillips, Freeman, & Wicks, Reference Phillips, Freeman and Wicks2003: 483). Managing for stakeholders (Freeman, Harrison, & Wicks, Reference Freeman, Harrison and Wicks2007) is associated with what we call a high level of stakeholder management performance (SMP). The instrumental version of stakeholder theory argues for a positive relationship between SMP and firm performance (Donaldson & Preston, Reference Donaldson and Preston1995; Jones, Reference Jones1995; Jones, Harrison, & Felps, Reference Jones, Harrison and Felps2018), and the empirical literature is generally supportive of a positive relationship (Mattingly, Reference Mattingly2017).
According to Phillips et al. (Reference Phillips, Freeman and Wicks2003), one of the common misconceptions about stakeholder theory is the argument that the interests of stakeholders should be given equal weight (Gioia, Reference Gioia1999; Marcoux, Reference Marcoux, DesJardins and McCall2000; Sternberg, Reference Sternberg1998). Research that demonstrates that higher-performing firms practice some minimum level of competence with each stakeholder group (Garcia-Castro & Francoeur, Reference Garcia-Castro and Francoeur2016) is supportive of this argument. Notions like balancing stakeholder interests (Reynolds, Schultz, & Hekman, Reference Reynolds, Schultz and Hekman2006) that have “intrinsic value” (Jones & Wicks, Reference Jones and Wicks1999a: 207) reinforce a balanced stakeholder view and provoke critics to denounce stakeholder theory for naively promoting equal balancing of stakeholder interests despite difficulties in practice (Gioia, Reference Gioia1999; Jones & Wicks, Reference Jones and Wicks1999b; Reynolds et al., Reference Reynolds, Schultz and Hekman2006).
All this is problematic given that “equal balancing” contradicts scholarship that explicitly recognizes the need to make resource allocation decisions that favor some stakeholders over others (Barney, Reference Barney2018; Harrison & Bosse, Reference Harrison and Bosse2013; Phillips et al., Reference Phillips, Freeman and Wicks2003). It also denies salience research that suggests managers give various stakeholder groups different weight in their decision-making (i.e., Agle, Mitchell, & Sonnenfeld, Reference Agle, Mitchell and Sonnenfeld1999; Mitchell, Agle, & Wood, Reference Mitchell, Agle and Wood1997). In fact, Reynolds et al. (Reference Reynolds, Schultz and Hekman2006) find that unequal levels of stakeholder salience make balancing stakeholder interests difficult.
A related problem is that empirical research often reinforces the balanced stakeholder perspective by measuring SMP with a composite measure, such as average performance across stakeholder groups, which gives them equal weight (e.g., Bettinazzi & Feldman, Reference Bettinazzi and Feldman2020; Bettinazzi & Zollo, Reference Bettinazzi and Zollo2017; Choi & Wang, Reference Choi and Wang2009; Hillman & Keim, Reference Hillman and Keim2001). In their well-cited empirical study pioneering the averaging approach, because no theoretical work supports giving one stakeholder group a higher priority than another, Hillman and Keim (Reference Hillman and Keim2001: 131) chose to give “equal importance” to each of the stakeholder categories in their study. This problem has stretched to the point that some researchers are making assumptions about composite stakeholder performance scores that may or may not be accurate. For example, Bettinazzi and Feldman (Reference Bettinazzi and Feldman2020: 22) interpret their composite score as ranging from “lower (in which the firm is attentive to fewer of its stakeholders) to higher (in which the firm is attentive to more of its stakeholders).” This interpretation suggests that a composite score can measure imbalanced stakeholder performance, but we question whether this is really the case.
As a simple illustration of this composite measure problem, consider an empirical study that examines the attention and resources firms devote to areas of importance to three stakeholder groups. A firm that scores 3 for customers, 3 for employees, and 3 for communities would have the same composite score as a firm that scores 5 for customers, 3 for employees, and 1 for communities. However, the stakeholder management strategies of these two firms are quite different—a difference that is not reflected in composite measures.
Because of the theoretical and empirical importance of these issues, research is needed to clarify the nature of the relationship between variation in SMP and firm performance. Our study asks, Is imbalance superior to balance, and does imbalance, if taken too far, turn into a negative force? One study that breaks with the norm of summing SMP scores is Garcia-Castro and Francoeur (Reference Garcia-Castro and Francoeur2016). Using set-theoretic methods, which establish preconditions necessary to achieving a particular outcome, they find that the very highest performing firms in their sample achieved, on one hand, at least a minimal SMP for each of the stakeholders included in the study and, on the other hand, did not exhibit an extremely high SMP for any one stakeholder. These findings imply that lower variation in SMP across stakeholders is requisite to the highest performance because either very high or very low SMP for one stakeholder would increase that variation. Interestingly, one empirical study in the corporate social responsibility (CSR) literature, but which operationalizes CSR in stakeholder terms, reports that firms that achieve consistency in CSR over time and across stakeholders outperform others, especially in knowledge-intensive industries (Wang & Choi, Reference Wang and Choi2013). Our study challenges the argument that consistency (e.g., balance) in SMP across stakeholders is associated with higher firm performance.
In this study, we unmask imbalance in the attention and resources firms devote to the interests of stakeholders by sorting out the theoretical arguments surrounding SMP variation, and we employ an empirical variances method when measuring SMP (instead of sums or means). Because we are interested in assessing the degree of imbalance, we conceptualize SMP variation as a measure capturing imbalance, operationalized as the standard deviation of SMP across stakeholder interests for a given firm. On the basis of the notion that attention and resources should be allocated where they will have the greatest positive influence on the value created by a firm (Barney, Reference Barney2018), we argue that SMP imbalance should be positively related to firm performance, which we measure using the market measure Tobin’s q (Choi & Wang, Reference Choi and Wang2009) and replicate with a return-on-assets (ROA) accounting measure. We also argue that in addition to too little, too much variation (imbalance) in SMP is associated with lower performance (an inverted U–shaped relationship). Using a large sample of firms and a longitudinal design, we find empirical support for both hypotheses, even when controlling for a traditional composite measure of SMP in the models.
This study makes three main contributions to the literature. First, our hypothesis that variation in SMP is associated with higher, not lower, firm performance addresses the misconception that balanced allocation of attention and resources across stakeholder groups is requisite to high performance. Our new evidence on SMP imbalance can provide a springboard for investigating the instrumental implications of alignments between the distribution of interest and resources to particular stakeholders and various firm strategies and environmental contexts associated with societal, political/legal, and industry conditions (e.g., Bridoux & Stoelhorst, Reference Bridoux and Stoelhorst2016; Garcia-Castro & Francoeur, Reference Garcia-Castro and Francoeur2016; Jones et al., Reference Jones, Harrison and Felps2018).
Second, this study is the first to document an inverted U–shaped relationship between SMP variation and firm performance. This provides an important middle ground between those who might believe in complete balance among stakeholder interests and those who believe that some stakeholders should be given most of the attention and resources, even at the expense of other stakeholders.
Third, the SMP variation measure developed in this article, SMP Imbalance, is very different from the composite measures found in most of the empirical research on instrumental stakeholder theory. It is simple and valuable both as an explanatory variable and because it may help illuminate why some of the previous research using a composite measure of SMP or a broader conceptualization of CSR that includes social issues is not entirely supportive of the instrumental notion that SMP is positively related to firm performance (Mattingly, Reference Mattingly2017).
This article proceeds as follows. First, we develop theory about the relationship of SMP variation and firm performance. We then describe our measure of the construct, which we call SMP imbalance, as well as our data, sample, and statistical modeling procedures. After presenting the results of our empirical tests, we discuss the implications of our study for instrumental stakeholder research and for practice.
THEORY AND HYPOTHESES
This section begins with a brief description of the core ideas of instrumental stakeholder theory, followed by an explanation for why the theory could be construed or interpreted to argue that firms should attempt to balance the amount of attention and resources they allocate across stakeholders. We then challenge this idea and present a case for variation across stakeholders, which reflects the idea that firm strategies should result in varying stakeholder priorities. On the basis of this theory, we put forth a hypothesis regarding the relationship we expect between variation (imbalance) in SMP and firm performance. With our second hypothesis, we seek a middle ground where too much imbalance creates negative repercussions for the firm because it damages the firm’s reputation for fair play, visualized as an inverted U–shaped curve.
Instrumental Stakeholder Theory
Instrumental stakeholder theory argues that firms that manage their stakeholders based on ethical principles like honesty, fairness, trustworthiness, generosity, care, loyalty, and respect will likely achieve higher firm performance (Freeman et al., Reference Freeman, Harrison, Wicks, Parmar and de Colle2010; Greenwood & Van Buren, Reference Greenwood and Van Buren2010; Jones, Reference Jones1995; Jones et al., Reference Jones, Harrison and Felps2018; Phillips, Reference Phillips2003). These are essential characteristics associated with managing for stakeholders (i.e., Freeman et al., Reference Freeman, Harrison and Wicks2007; Harrison, Bosse, & Phillips, Reference Harrison, Bosse and Phillips2010) and thus for achieving high SMP. This type of management can increase a stakeholder’s bond to (Bosse & Coughlan, Reference Bosse and Coughlan2016), and positive affiliation with (Harrison & Wicks, Reference Harrison and Wicks2013), an organization, thus increasing the stakeholder’s loyalty to and propensity to contribute additional effort and/or resources to the organization (Jones et al., Reference Jones, Harrison and Felps2018).
The explanatory mechanisms for higher performance include reduced contracting costs between stakeholders and firms (Jones, Reference Jones1995) and trust-based ties (Uzzi, Reference Uzzi1997) with stakeholders that increase efficiency and innovation by facilitating a flow of tacit knowledge about utility functions (Harrison et al., Reference Harrison, Bosse and Phillips2010; Harting, Harmeling, & Venkataraman, Reference Harting, Harmeling and Venkataraman2006). Put simply, firms that develop reputations for fairness earn the trust of stakeholders, who are then willing to share their resources and knowledge.
Managing for stakeholders may also reduce moral hazard—the risk that a stakeholder will shirk responsibilities (Alchian & Demsetz, Reference Alchian and Demsetz1972; Jones et al., Reference Jones, Harrison and Felps2018). In addition, it can reduce costs from antagonistic stakeholder actions, such as legal suits, boycotts, walkouts, adverse regulation, and bad social media (Cornell & Shapiro, Reference Cornell and Shapiro1987; Harrison & St. John, Reference Harrison and St. John1996). A perception that a firm is a less risky investment may even increase the value of the firm’s securities (Graves & Waddock, Reference Graves and Waddock1994) and make the firm a more attractive partner for investments, whether those investments are in the form of capital, new contracts, energy, loyalty, or even specific employee investments (Wang, Barney, & Reuer, Reference Wang, Barney and Reuer2003). Such a firm may also discover ways to produce stakeholder synergies, which involve simultaneous creation of value for multiple stakeholders (Tantalo & Priem, Reference Tantalo and Priem2016).
Of course, significant costs are associated with this sort of management (Garcia-Castro & Francoeur, Reference Garcia-Castro and Francoeur2016; Harrison & Bosse, Reference Harrison and Bosse2013; Jones et al., Reference Jones, Harrison and Felps2018; Sisodia, Wolfe, & Sheth, Reference Sisodia, Wolfe and Sheth2007). For example, generous allocations of material value to stakeholders can directly influence bottom-line profitability. Managers may also lose time and thus effectiveness as they give inordinate voice to stakeholders when making decisions. In addition, firms may avoid taking advantage of stakeholders in ways that could enhance profitability, and there is no guarantee that stakeholders will reciprocate as a result of the costly treatment they receive (Bridoux & Stoelhorst, Reference Bridoux and Stoelhorst2014). If managing for stakeholders is going to improve firm performance, the economic benefits associated with this sort of management must exceed incremental costs. In other words, it is possible that there may come a point after which any additional investment in a stakeholder group, or set of groups, bears diminishing returns or even negative returns.
Although the empirical evidence relevant to instrumental stakeholder theory is mostly, but not entirely, supportive of a positive relationship between managing for stakeholders (composite SMP) and firm performance (Mattingly, Reference Mattingly2017; Orlitzky, Schmidt, & Rynes, Reference Orlitzky, Schmidt and Rynes2003), we should qualify this statement. Studies that directly test the relationship between SMP and firm performance (that do not apply the broader conceptualization of CSR, which includes societal factors not as directly important to stakeholders) tend to be very supportive of a positive relationship (Berman, Wicks, Kotha, & Jones, Reference Berman, Wicks, Kotha and Jones1999; Choi & Wang, Reference Choi and Wang2009; Henisz, Dorobantu, & Nartey, Reference Henisz, Dorobantu and Nartey2014; Preston & Sapienza, Reference Preston and Sapienza1990; Sisodia et al., Reference Sisodia, Wolfe and Sheth2007). However, existing research has not comprehensively examined whether variation in SMP is also associated with firm performance, which is our primary research question. Reasonable arguments both support and oppose the existence of a positive relationship between variation in SMP and firm performance.
Balanced or Imbalanced Stakeholder Management Performance
It is easy to understand why many scholars may have mistakenly believed that stakeholder theory promotes equal treatment of stakeholders, both from statements like the ones in the introduction and based on the theoretical underpinnings of the theory and its methodological application (i.e., a composite measure). At the core of stakeholder theory are relationships between firms and stakeholders (Bridoux & Stoelhorst, Reference Bridoux and Stoelhorst2016; Freeman et al., Reference Freeman, Harrison and Wicks2007; Jones et al., Reference Jones, Harrison and Felps2018), and it would be disingenuous for the theory to suggest that a firm should behave in a way that would lead to anything less than strong relationships. Furthermore, some of the prominent writers argue that it is impossible to separate the normative/moral elements of the theory from the instrumental—that is, all management decisions contain a normative element (e.g., Freeman, Reference Freeman1994; Harris & Freeman, Reference Harris and Freeman2008; Wicks, Reference Wicks1996). Consequently, it is no surprise that stakeholder theory typically advocates for the application of ethical management principles without differentiation across stakeholders (Freeman, Reference Freeman1984; Freeman et al., Reference Freeman, Harrison and Wicks2007; Freeman et al., Reference Freeman, Harrison, Wicks, Parmar and de Colle2010; Jones, Reference Jones1995).
However, we believe a more reasonable set of arguments supports the opposite case. Reciprocity (Bosse, Phillips, & Harrison, Reference Bosse, Phillips and Harrison2009; Donaldson & Dunfee, Reference Donaldson and Dunfee1994; Hahn, Reference Hahn2015; Harrison et al., Reference Harrison, Bosse and Phillips2010; Simon, Reference Simon1966) and its broader application of generalized exchange (based on indirect treatment of stakeholders) (Bearman, Reference Bearman1997; Ekeh, Reference Ekeh1974; Molm, Collett, & Schaefer, Reference Molm, Collett and Schaefer2007) were directly applied to instrumental stakeholder theory by Harrison et al. (Reference Harrison, Bosse and Phillips2010), and their work can help resolve the issue of balanced versus imbalanced attention to the interests of stakeholders (see also Bosse et al., Reference Bosse, Phillips and Harrison2009). They focus on three types of organizational justice—procedural, interactional, and distributional—that enhance the trust stakeholders have in the firm, such that they are willing to provide the firm with tacit knowledge about their utility functions (e.g., their true needs and resources). The firm can use this knowledge to increase innovation, demand, efficiency, and flexibility to deal with unanticipated changes, which is argued to increase firm performance. These benefits are associated with managing for stakeholders through the establishment of trust, which is associated with organizational justice (Bosse et al., Reference Bosse, Phillips and Harrison2009; Jones et al., Reference Jones, Harrison and Felps2018). Does organizational justice imply that stakeholders should be treated the same to unlock these benefits?
According to Adams (as cited in Harrison et al., Reference Harrison, Bosse and Phillips2010: 64), “the distributional justice literature suggests stakeholders are fully cooperative only when they perceive the value they get is fair in comparison to the value received by other stakeholders.” Fairness in the distribution of value can be achieved with widely varying distributions among stakeholders, as long as the value each stakeholder receives is perceived as fair given the resources and effort the stakeholder contributed to creating it (Bosse et al., Reference Bosse, Phillips and Harrison2009). Fairness implies, not equal distributions, but rather distributions that are proportional to the amount of effort and resources contributed by a particular stakeholder (Phillips, Reference Phillips2003). Procedural justice deals with a perception of fairness in the decision-making processes of the firm and suggests that procedure may be just as important to a stakeholder as decision outcomes (Lind & Tyler, Reference Lind and Tyler1988; Phillips et al., Reference Phillips, Freeman and Wicks2003). It is likely that a balanced amount of due process across stakeholders could be considered unfair because of a norm that suggests that those who give the most to value creation should be given a heavier weight in firm decisions.
A similar argument applies to interactional justice, which describes attributes (e.g., respect, honesty, transparency, and reliability) associated with the treatment stakeholders receive when interacting with the firm (Cropanzano, Bowen, & Gilliland, Reference Cropanzano, Bowen and Gilliland2007). It would be hard to argue that firms should not extoll these attributes and demand them of their managers when they are interacting with all their stakeholders to avoid breaches of trust. Yet, the extent to which the firm takes action to repair the real or perceived breach probably does (and should) depend on the importance of the stakeholder to the value-creating processes of the firm, suggesting a role for “optimal trust” (Wicks, Berman, & Jones, Reference Wicks, Berman and Jones1999), at least from a firm performance perspective (especially so with perceived as opposed to real breaches). Also, some stakeholders may be nonreciprocal (Bridoux & Stoelhorst, Reference Bridoux and Stoelhorst2014) or even damaging toward a firm, and these would deserve less attention.
In addition to these organizational justice–related arguments that suggest stakeholders that give the most to the value-creating processes of the firm should receive the most attention and resources, variation is a likely outcome in a firm that is allocating its attention and resources strategically. Strategy is often defined as a process for guiding resource allocation (Bower & Gilbert, Reference Bower and Gilbert2005; Jones et al., Reference Jones, Harrison and Felps2018; Nag, Hambrick, & Chen, Reference Nag, Hambrick and Chen2007). Firms that attempt to allocate attention and resources equally across stakeholders might be referred to as having a “socialistic” (Bernardo, Luo, & Wang, Reference Bernardo, Luo and Wang2006) or “evenhanded” (Gupta, Briscoe, & Hambrick, Reference Gupta, Briscoe and Hambrick2018) allocation approach, which may lead to suboptimal performance. A more targeted approach based on firm strategy might be called a “strategic” or “targeted” allocation approach, which means that the firm is allocating its attention and resources to areas that are important to the stakeholders most closely associated with the strategies of the firm (Harrison & Bosse, Reference Harrison and Bosse2013). This approach is not likely to reduce the trust stakeholders have in a firm, nor reduce the benefits to the firm from managing for stakeholders (i.e., transfer of tacit knowledge, effort, loyalty, attraction, cooperation), if allocation of attention and resources is considered fair.
To summarize, we expect that firms that exhibit variation in the attention and resources allocated to areas that are important to stakeholders will have better performance because organizational justice suggests that to maintain a trust-inducing perception of fairness among stakeholders, the firm is likely to allocate the most attention and resources to stakeholders that contribute the most to value creation, and because variation is expected when the firm is making strategic allocations:
Hypothesis 1: Imbalanced stakeholder management performance is positively associated with firm performance.
Despite the performance-friendly reasons for varying the attention and resources firms allocate to stakeholders, additional reasons suggest that a very high level of imbalance can be problematic (Garcia-Castro & Francoeur, Reference Garcia-Castro and Francoeur2016; Harrison & Bosse, Reference Harrison and Bosse2013). Harrison and Bosse attribute the bankruptcy of Malden Mills to the obsession of its CEO toward taking care of its workers above all other interests: “Malden Mills enjoyed tremendous support from employees and the community, but the costs associated with that support and loyalty were so high that they could not be offset by the associated benefits” (314). They go on to explain, “A firm allocates too much material value to a stakeholder when the marginal unit of value the stakeholder receives results in less than a unit of new value created through reciprocity on the part of the stakeholder” (317). This can happen for a variety of reasons, such as when a stakeholder possesses a great deal of political or economic power owing to resource dependence, network centrality, or the ability to sway public opinion or the legal/regulatory environment (Coff, Reference Coff1999; Freeman, Reference Freeman1984; Frooman, Reference Frooman1999; Pfeffer & Salancik, Reference Pfeffer and Salancik1978; Porter, Reference Porter1980; Rowley, Reference Rowley1997). It may also be evidence of an agency problem (Jensen, Reference Jensen2002; Jensen & Meckling, Reference Jensen and Meckling1976).
Overallocation of attention and resources to stakeholders because of their power or agency problems could drag down the firm’s performance as resources are diverted toward powerful stakeholders. It could also prevent the firm from rewarding more valuable stakeholders for their effort and risk, and the resources they provide to create value (Phillips et al., Reference Phillips, Freeman and Wicks2003). This sort of imbalanced stakeholder management may lead to perceptions of inequity and may cause stakeholders to lose trust in the firm, ultimately harming the firm’s reputation and undermining reciprocity and other benefits from managing for stakeholders (Harrison et al., Reference Harrison, Bosse and Phillips2010).
Of course, all stakeholders must obtain a certain amount of utility through their interactions with the firm to retain their participation (their reservation price), which is a function of each stakeholder’s opportunity costs, or what the stakeholder would receive through similar interactions with other firms (Bosse et al., Reference Bosse, Phillips and Harrison2009; Garcia-Castro & Aguilera, Reference Garcia-Castro and Aguilera2015; Harrison & Wicks, Reference Harrison and Wicks2013). Firms that continuously provide less utility to a stakeholder than its opportunity cost are operating at a high risk of losing the goodwill, motivation, participation, and/or resources of that stakeholder. In some cases, a stakeholder may even retaliate against the firm (Fehr & Gachter, Reference Fehr and Gachter2000; Offerman, Reference Offerman2002). Consequently, firms that manifest a high SMP imbalance as a result of neglecting the interests of other stakeholders may experience lower performance, even though they may treat most other stakeholders well. Combined with H1, these arguments suggest that too much imbalance eventually harms firm performance, following a curvilinear relationship:
Hypothesis 2: An inverted U–shaped relationship exists between imbalanced stakeholder management performance and firm performance.
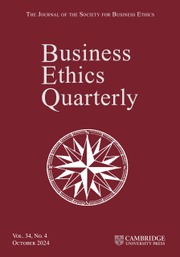
Figure 1 visually depicts the components of the curvilinear relationship using the framework suggested by Haans, Pieters, and He (Reference Haans, Pieters and He2016). Line (a) shows that as firms begin to imbalance allocations of resources to various stakeholders (SMP imbalance), they are likely to experience an increase in performance. This is consistent with H1, which we have referred to as a strategic imbalance effect. However, line (b) shows that as a firm increases the imbalance in its allocations of resources across stakeholders, it is likely to experience some negative performance influences, such as diversion of resources away from critical areas and deserving stakeholders, a perception of unfairness among stakeholders leading to loss of trust and reduced reciprocity, a damaged reputation, and possibly even retaliation by stakeholders. The higher the imbalance is, the more likely it is that these negatives will occur and will impact performance. The relationship is depicted as a curve because the negative effects of imbalance are expected when they reach very high levels—after all, we have argued that some degree of imbalance can be considered fair. A lot is packed into these arguments—for simplicity, we label these forces as a loss of trust. Subtracting the costs of loss of trust (b) from the benefits of strategic allocation (a) results in line (c), which demonstrates an inverted U–shaped relationship between SMP imbalance and firm performance.
Figure 1: Components of an Inverted U–Shaped Curve
METHODS
Sample and Data
Our sample is constructed from two databases. We first collect firms’ ratings from the MSCI ESG Stats (KLD) database to measure SMP. The database contains yearly ratings for corporate environmental, social, and governance behavior. Mattingly (Reference Mattingly2017) reviewed one hundred empirical studies that make use of the KLD data, including studies that test the relationship between stakeholder performance and firm performance (i.e., Agle et al., Reference Agle, Mitchell and Sonnenfeld1999; Choi & Wang, Reference Choi and Wang2009; Waddock & Graves, Reference Waddock and Graves1997). The study by Garcia-Castro and Francoeur (Reference Garcia-Castro and Francoeur2016: 414), which is conceptually the closest to this study, also used data derived in part from the KLD database. Given the importance of the KLD database to this literature, we decided to use it so that our results are directly comparable to the results of these other studies, none of which have examined curvilinear relationships between stakeholder performance variation and firm performance. We also note that the widely used alternative databases with which we are familiar (i.e., Asset4) are derived from the same raw information, such as media and analyst reports, company documents, and direct contacts with companies when clarification is needed. Despite its weaknesses (discussed in the limitations section), the KLD data are based on an extensive data collection effort encompassing essentially all publicly available information about a firm as well as some information gained privately through direct interactions with the firm. Also, the data were not collected for the purpose of doing research on stakeholder theory, which provides for less potential for rater bias than if the data had been collected by hypothesis-testing researchers.
Although the KLD database included only eleven hundred US companies before 2003, it was expanded to approximately three thousand companies after that. Methodological changes in data collection by the company led to a large number of missing observations after 2013. Consequently, our sample period is from 2003 to 2013. We combine the KLD data set with financial data from the Compustat North America database. After excluding financial firms (stakeholder influence capacity [SIC] between 6000 and 6999) and utility firms (SIC between 4900 and 4999), we obtain a sample of 18,337 observations with all variables available for our tests.
Dependent Variable
We use Tobin’s q as a measure of market-based firm performance. More specifically, Tobin’s q is measured as the ratio of the market value of assets to the book value of assets, where the market value of assets is measured as the market value of equity plus the book value of assets minus the book value of equity (Coles, Daniel, & Naveen, Reference Coles, Daniel and Naveen2008). Tobin’s q is used extensively in strategic management research (i.e., Arrfelt, Wiseman, McNamara, & Hult, Reference Arrfelt, Wiseman, McNamara and Hult2015; Mackey, Barney, & Dotson, Reference Mackey, Barney and Dotson2017; Mani & Nandkumar, Reference Mani and Nandkumar2016; Sirmon & Hitt, Reference Sirmon and Hitt2009), including stakeholder-oriented research (Choi & Wang, Reference Choi and Wang2009). Arrfelt et al. (Reference Arrfelt, Wiseman, McNamara and Hult2015) suggest that Tobin’s q is preferred over accounting measures or stock returns for two reasons. First, Tobin’s q is a forward-looking measure of firm performance, in contrast to the backward-looking measures, such as ROA. Therefore Tobin’s q is more consistent with the forward-looking resource allocation across different areas of stakeholders. Second, Arrfelt et al. explain that there is no need to perform risk adjustment or normalization for Tobin’s q because it essentially incorporates the correct risk-adjusted discount rate and alleviates the concerns associated with accounting measures caused by the variations in tax laws and accounting standards across countries. In addition, empirical findings using KLD data are slightly less consistent when market-based measures are used (Mattingly, Reference Mattingly2017), so using a market-based measure is a more conservative test of our theory and, furthermore, perhaps provides some understanding regarding these inconsistencies; that is, SMP variation may provide a partial explanation for the inconsistencies.
Independent Variables
The KLD database provides ratings for corporate environmental, social, and governance behavior along seven dimensions—employee relations, human rights, diversity, product issues, community, environment, and governance. The KLD variables are associated with the attention a firm pays and the resources it devotes to areas that are important to primary stakeholder groups (Harrison & Freeman, Reference Harrison and Freeman1999; Hillman & Keim, Reference Hillman and Keim2001; Waddock & Graves, Reference Waddock and Graves1997). Employee relations, human rights, and diversity relate to the attention and resources a firm devotes to issues and programs that are important to a firm’s employees, product issues relate to customer interests, and community and environment relate to outcomes that are important to the communities in which the firm operates. Governance characteristics are arguably associated with how sensitive a firm is to issues that are important to shareholders; for example, they reflect issues such as executive compensation and reporting transparency (Kang, Reference Kang2015).
We did not include KLD variables that are purely associated with present-day moral issues, such as whether a firm operates in countries with poor human rights records or in a “sin” industry, such as tobacco or gambling (Hillman & Keim, Reference Hillman and Keim2001). We realize that the seven variables do not measure performance for areas of importance for all primary stakeholders; frankly, no set of variables could be that comprehensive. However, inasmuch as our interest is not in absolute stakeholder performance but in variation across stakeholder performance variables as an indication of variation in the priority firms are giving to these areas, we believe that seven is sufficient. Note that we are not portraying the environment as a stakeholder, but also recognize that environmental performance is important to the communities in which the firm operates.
One key assumption associated with using the KLD data is that the degree to which a firm’s interactions with a given stakeholder group is positive or negative reflects the firm’s investment in the relationship with that stakeholder group. The KLD database provides a binary rating for both strengths (programs, policies, and actions that are associated with positive outcomes in one of the seven areas) and concerns (associated with manifest problems in an area). If no evidence is related to a particular strength or concern, it is coded as zero. We construct a net SMP measure (SMP), which is the sum of strength scores across all the strength indicators minus the sum of concern scores across all the concern indicators. We consider both strengths and concerns together because some firms both help and harm certain stakeholders simultaneously (Harrison & Wicks, Reference Harrison and Wicks2019). If we run our tests on the strengths and concerns independently, then we could end up with erroneous results because we are not performing an accurate test of our theory.
However, comparing raw scores across years and dimensions may be inappropriate (Deng, Kang, & Low, Reference Deng, Kang and Low2013; Lins, Servaes, & Tamayo, Reference Lins, Servaes and Tamayo2017) because the number of strength and concern indicators in any category can change over the years. We therefore scale the scores by the respective number of strength or concern indicators for each category, as follows:
 $$ {SMP}_{i,t}=\frac{\sum Strength\;{Scores}_{i,t}}{N\;{\left( Strength\ Indicators\right)}_{i,t}}-\frac{\sum Concern\;{Scores}_{i,t}}{N{\left( Concern\ Indicators\right)}_{i,t}\;}. $$
We compute the SMP score for each of the seven categories and aggregate them to get SMP. Almost all previous studies of the SMP–firm performance relationship utilized a similar measure (e.g., Deng et al., Reference Deng, Kang and Low2013; Tang, Hull, & Rothenberg, Reference Tang, Hull and Rothenberg2012). Adding it to the models allows us to compare the influence of overall SMP with variation in SMP directly. We then compute the standard deviation of individual SMP scores among the seven categories (SMP Imbalance) to measure the extent to which the firm is imbalanced in its attention across these areas. A higher value of standard deviation represents a greater imbalance in managing the interests of different stakeholders.
Control Variables
We include several control variables that are likely to have an influence on Tobin’s q. Kim and Bettis (Reference Kim and Bettis2014) found that cash holding is a significant predictor of this measure (see also Harrison & Coombs, Reference Harrison and Coombs2012), so we control for this influence with the variable Cash/TA, which is cash holdings divided by total assets. Firm size, leverage, and profitability are also likely to influence Tobin’s q. To control for these influences, we use the natural logarithm of total assets (Firm Size), the sum of long-term and short-term debt over total assets (Leverage), and net profit deflated by total assets (ROA). We believe that adding a control like ROA into our models makes our tests more conservative because current profitability would be expected to have a strong influence on market expectations regarding future performance. In addition, to alleviate the concern that the level of investment in fixed assets for the firms in our sample could be biasing our results, in our regressions, we included the ratio of property, plant, and equipment to total assets (Tangibility). In addition, we control for the state-level economic conditions and industry-level competition. GDP is the natural logarithm of real gross domestic product per capita for a state in a given year. HHI (Herfindahl–Hirschman Index) measures industry-level competition and is calculated by squaring the share of sales of each firm in the same industry and then adding the squares together. The higher the HHI is, the lower is the competition in that industry. These two exogenous variables are controlled to mitigate the concern that the association between firm performance and SMP imbalance is affected by omitted variables.
We test our hypotheses using ordinary least squares (OLS) regression with accommodations for a panel design. Specifically, we include year fixed effects and industry fixed effects and use robust standard errors to correct interdependence among observations. We lag all independent variables by one year to mitigate endogeneity concerns.
RESULTS
Descriptive Statistics
The sample descriptive statistics and correlation matrix are reported in Table 1. We report these statistics out of convention, while recognizing that they should be interpreted with caution because they are based on a cross-sectional analysis, whereas the data are in a longitudinal format. The mean value of Tobin’s q is 2.02. The average SMP Imbalance is 0.17. The Pearson correlation matrix shows that Tobin’s q in year t + 1 and SMP Imbalance in year t are negatively and significantly correlated, which is inconsistent with our expectation. However, we also find that Tobin’s q is negatively correlated with firm size, while SMP Imbalance is positively correlated with firm size, which indicates that the negative correlation between Tobin’s q and SMP Imbalance is possibly due to their correlations with firm size. Without a control for firm size, any inferences based on correlation are likely to be biased. We explore this relationship, controlling for firm size and other firm characteristics, in the following multivariate analyses.
Table 1: Descriptive Statistics and Correlation Matrix

Note. N = 18,337. Boldface means significance at the 0.05 level or less.
Main Results
In column 1 of Table 2, we only include SMP and other control variables. The empirical results for H1 are presented in column 2 as we add SMP Imbalance. This setup in columns 1 and 2 allows us to gauge the effect of key testing variables relative to other control variables. The coefficients of SMP Imbalance are positive and significant in both columns (e.g., β = 0.41, p = 0.00 in column 2). The coefficient of SMP Imbalance in column 2 suggests that one standard deviation (SD) increase in SMP Imbalance in year t is associated with a 0.05 increase in Tobin’s q in year t + 1, which is associated with a 2.4 percent increase in Tobin’s q on average. This result, therefore, provides support for H1, that imbalanced stakeholder management is positively associated with firm performance. In column 3, we also report standardized coefficients; our result shows that the scale of SMP Imbalance (0.04) is close to that of SMP (0.05), suggesting that it is important to consider SMP variation relative to the level of SMP. This is an important finding given the large volume of studies that have made use of a measure similar to our SMP variable.
Table 2: Empirical Results for Hypothesis 1

Note. The dependent variable is Tobin’s q t+1 . p-Values calculated based on robust standard errors are reported in parentheses. All independent variables are lagged by one year. Hypothesis-testing variables are in boldface. OLS = ordinary least squares.
We report the empirical results for H2 in Table 3. H2 predicts that too much balance and too much imbalance are both problematic. As predicted in H2, this suggests an inverted U–shaped relationship between SMP Imbalance and Tobin’s q. We include both SMP Imbalance and the square of SMP Imbalance and report the results in column 1 of Table 3. We control for SMP (the aggregate measure) in column 2. In an additional analysis not tabulated here, we also perform a robustness check by including the square term of SMP in column 2 of Tables 2 and 3 to determine if there is a need to control for the quadratic effect of SMP on firm performance. We find that the coefficient of the square term of SMP is not significant at any conventional level in either regression, while our main results remain the same. Therefore we do not include the square term of SMP in the models included in the article.
Table 3: Empirical Results for Hypothesis 2

Note. The dependent variable is Tobin’s q t+1 . p-Values calculated based on robust standard errors are reported in parentheses. All independent variables are lagged by one year. Hypotheses-testing variables are in boldface. OLS = ordinary least squares.
We further recognize that SMP Imbalance does not consider that firms may favor one group over others in a systematic way (e.g., not firm specific). To mitigate the concern that some groups may be favored systematically, we control the level of SMP in each of the individual stakeholder areas in column 3. The sample size drops to 15,200 in column 3 because some observations do not have SMP scores for all stakeholder areas. We find that the coefficients for SMP Imbalance are all significantly positive (p = 0.00) and that the coefficients for SMP Imbalance 2 are all significantly negative (p = 0.00, 0.00, and 0.03 in columns 1–3, respectively), consistent with H2, that there is an inverted U–shaped relationship between SMP variation and firm performance. In addition, we perform two robustness checks. First, we include a cubic term of SMP Imbalance in the regressions of Table 3. We find that the coefficient of the cubic term is not significant at any conventional level, whereas the inverted U–shaped result remains robust. Second, we replace Tobin’s q with ROA as an alternative dependent variable—the inverted U–shaped result still holds.Footnote 1 To gain more intuitive insight into the curvilinear relationship, we plot how firm performance changes with SMP Imbalance in Figure 2.

Figure 2: The Curvilinear Relationship between SMP Imbalance and Firm Performance
As a follow-up analysis, we report the results with standardized variables in columns 4 and 5 of Table 3. We find that the coefficient of SMP Imbalance is 0.13, whereas the coefficient of SMP Imbalance 2 is −0.11 in column 4. In addition, the standardized coefficient of SMP is 0.07, suggesting that the impacts of SMP variation and SMP level on firm performance are close.
Additional Robustness Checks
A potential limitation of our study is that balance (or imbalance) in SMP is not exactly the same as balance (or imbalance) in the actual allocation of resources and attention to various stakeholders. This is because, to achieve the same SMP score in different areas of stakeholder management as evaluated by KLD, the firm may have to allocate more resources and attention to one area (such as employee relations) than another (such as a customer’s desire for affordable yet safe products). This leads to a potential concern that scores across the SMP dimensions may not be directly comparable. To alleviate this concern, we followed Wang and Choi’s (Reference Wang and Choi2013) method and constructed standardized measures of imbalance in SMP as well as the level of SMP. Specifically, the alternative SMP imbalance measure was calculated as the variance in the normalized SMP scores for each dimension, standardized by the SD from the sample mean. Similarly, the standardized measure of SMP level was calculated by taking the average of standardized scores across stakeholders. We then ran the regression analyses of Tables 2 and 3 again, using the revised measures, and found that our findings remain robust. We further checked the robustness of the results by reducing the seven dimensions of SMP to five dimensions, consistent with Wang and Choi (Reference Wang and Choi2013); the findings are the same.Footnote 2
Haans et al. (Reference Haans, Pieters and He2016) argue that it is important to employ a variety of empirical tests to validate the presence of inverted U shapes. We follow their suggested framework and employ the three-step testing process.Footnote 3 In the first step, as mentioned previously, we determine that the coefficient of the square term of SMP Imbalance is significantly negative (see Table 3). In the second step, we test whether the slope is sufficiently steep at both ends of our data range between XL and XH. For the inverted U shape, β1 + 2β2 XL needs to be significantly positive and β1 + 2β2 XH needs to be significantly negative, where β1 represents the coefficient of SMP Imbalance and β2 represents the coefficient of its square term. Our test results show steep slopes at both ends. The slope at the low end of the X-range is 1.42, F (1, 18307) = 50.88, p < 0.01. The slope at the high end of the X-range is −2.98, F (1,18307) = 28.15, p < 0.01. These tests strongly support the inverted U shape. In the third step, we use the formula of –β1/2β2 to calculate the turning point, which equals 0.34 (−1.42/(2 × −2.10)). This turning point of 0.34 is located within our SMP Imbalance data range between 0 and 1.05. This turning point can also be visually observed in Figure 2. The 95 percent confidence interval using the Fieller method of the turning point is [0.28, 0.42], also within the data range.
DISCUSSION
Despite considerable discussion about the position of stakeholder theory regarding equally balancing stakeholder interests (Gioia, Reference Gioia1999; Harrison & Bosse, Reference Harrison and Bosse2013; Marcoux, Reference Marcoux, DesJardins and McCall2000; Phillips et al., Reference Phillips, Freeman and Wicks2003; Sternberg, Reference Sternberg1998), very limited empirical work exists on this topic (Garcia-Castro & Francoeur, Reference Garcia-Castro and Francoeur2016; Reynolds et al., Reference Reynolds, Schultz and Hekman2006), and the work that does exist does not directly test how much imbalance, if any, is most desirable for firm performance. In this study, we find that a moderate amount of variation in the attention a firm pays to areas that are important to its stakeholders is associated with higher Tobin’s q. We find support for a “strategic” (Harrison & Bosse, Reference Harrison and Bosse2013), as opposed to a “socialistic” (Bernardo et al., Reference Bernardo, Luo and Wang2006) or “evenhanded” (Gupta et al., Reference Gupta, Briscoe and Hambrick2018), approach to managing stakeholder interests. We have presented evidence of a middle ground between advocates of balanced stakeholder management and those who believe in a management strategy that gives most attention and resources to particular stakeholders.
Our findings are supportive of the theory developed by Barnett (Reference Barnett2007). He argued that investments in CSR, like investments in other intangible assets, such as R&D or advertising, lead to highly uncertain outcomes that make it difficult to determine the optimal investment patterns. To address this problem, he argues that some of the variations in performance associated with investments in CSR can be explained by what he called stakeholder influence capacity, which is “a multidimensional, firm-level construct composed of the dynamic relationships a firm has with its myriad stakeholders” (803). A firm with high SIC is more likely to be able to identify investment opportunities in CSR that will yield positive financial returns. The theory suggests that a firm would want to invest in relationships with a wide variety of stakeholders to increase SIC. However, at some point, investments in stakeholder relationships are likely to hit a point of diminishing returns. These arguments suggest an inverted U–shaped performance curve associated with investments in stakeholder relationships, which our results support.
In an interesting twist, our theory and findings contradict the arguments of Reynolds et al. (Reference Reynolds, Schultz and Hekman2006), but not their results. They argue for the balancing of stakeholder interests owing to sharing norms and incomplete contracts, but the results of their study suggested that doing so was very difficult for managers because of indivisible resources and differences in stakeholder saliency. Our results add clarity to what they found by demonstrating that some level of balance is associated with higher firm performance, but that taking balance to an extreme is likely to lead to lower performance. Consequently, precise balancing of interests is not only not a requirement for managers but not even recommended.
Our findings are distinct from those of Wang and Choi (Reference Wang and Choi2013), who examined imbalance in CSR performance (but measured CSR in stakeholder terms). They discovered that consistency in social performance with regard to many stakeholders was associated with higher financial performance. This runs counter to our findings for H1. However, Wang and Choi’s data are older—we use 2003–13, whereas they use 1991–2000—and our sample is approximately ten times larger. Also, Wang and Choi did not test for an inverted U–shaped relationship (H2), which is the most important finding of this study.
It is important to note that our findings do not contradict, but rather help explain, what Garcia-Castro and Francoeur (Reference Garcia-Castro and Francoeur2016) discovered when they examined SMP preconditions to achieving high firm performance. As mentioned previously, they found some support that the majority (set at 0.75 level) of very high performing firms tend not to completely neglect any particular area of importance to any of the stakeholders included in the study, nor do they give the interests of any one stakeholder a very high level of attention. While the authors’ findings, especially at the high end of SMP, could be interpreted as suggesting that moving attention uniformly toward the center (toward an equally balanced distribution) is necessary to achieve high performance, the set-theoretic logic they employed does not really test this notion. However, combining Garcia-Castro and Francoeur’s findings with our results (based on continuous variables) supports the idea that a moderate amount of variation in attention to stakeholder interests, on average, is the optimal point for achieving higher firm performance. Our modeling also demonstrates that very low variation is associated with low performance, which is something they did not test.
Our study offers three main contributions to the instrumental stakeholder management literature. First, our finding that variation in SMP is associated with higher, not lower, firm performance helps to resolve the debate about balanced versus unbalanced stakeholder management. As Phillips et al. (Reference Phillips, Freeman and Wicks2003) suggested, there is a lingering misconception that stakeholder theory argues for an equal weighting of stakeholder interests (Gioia, Reference Gioia1999; Marcoux, Reference Marcoux, DesJardins and McCall2000; Reynolds et al., Reference Reynolds, Schultz and Hekman2006; Sternberg, Reference Sternberg1998). This idea is reinforced in the empirical literature because most studies use a composite measure of SMP that weighs stakeholders equally (e.g., Bettinazzi & Feldman, Reference Bettinazzi and Feldman2020; Bettinazzi & Zollo, Reference Bettinazzi and Zollo2017; Choi & Wang, Reference Choi and Wang2009; Hillman & Keim, Reference Hillman and Keim2001). Hillman and Keim once argued that there is no theoretical justification for doing otherwise. This study provides the theoretical justification to seriously consider the allocation of attention and resources to various stakeholders. This new perspective on SMP imbalance provides ample possibilities for examining the instrumental implications of alignments between the distribution of attention and resources to particular stakeholders and various firm strategies and environmental contexts associated with societal, political/legal, and industry conditions (e.g., Bridoux & Stoelhorst, Reference Bridoux and Stoelhorst2016; Garcia-Castro & Francoeur, Reference Garcia-Castro and Francoeur2016; Jones et al., Reference Jones, Harrison and Felps2018), to be discussed in the next section, on future research.
Second, our operationalization of SMP variation allowed us to examine how the level or degree of variation in allocation of attention and resources is related to firm performance. In particular, this study is the first to document an inverted U–shaped relationship between SMP variation and firm performance. As explained in our theory section, a close examination of the organizational justice literature that has been used as support for instrumental stakeholder theory (i.e., Harrison et al., Reference Harrison, Bosse and Phillips2010) leads to the conclusion that fairness does not require equal distributions of attention and resources to stakeholders. Furthermore, the attempt to achieve equal distributions could actually backfire by denying resources to stakeholders that are the most deserving based on their contributions to firm value. Also, a strategic perspective on attention to stakeholder interests supports aligning strategy with allocations of resources. Of course, there are implications for practitioners in these findings as well. They suggest that managers may be ill advised to interpret stakeholder theory as equally balancing the interests of stakeholders to promote justice or equity and that, rather, too much imbalance may also be problematic.
Third, the SMP variation measure itself, SMP Imbalance, is potentially valuable for future research and could help explain some past studies. Variance in SMP is simple to construct, and the data are available to researchers using the KLD or Asset4 database. It is a significant predictor of both market-based and accounting-based firm performance, even in the presence of a traditional (composite average) measure of SMP, and could help explain why some previous research is not entirely supportive of the instrumental notion that SMP is positively related to firm performance (Mattingly, Reference Mattingly2017). That is, most studies have been based on composite SMP measures, which could have masked the influence that the level of variation in those scores might have had on their models (Bettinazzi & Feldman, Reference Bettinazzi and Feldman2020; Bettinazzi & Zollo, Reference Bettinazzi and Zollo2017; Hillman & Keim, Reference Hillman and Keim2001).
Future Research
Our results provide interesting opportunities for future research. As suggested previously, context seems very important (i.e., Garcia-Castro & Francoeur, Reference Garcia-Castro and Francoeur2016; Jones et al., Reference Jones, Harrison and Felps2018). For example, researchers may wish to examine types of imbalances in particular contexts. Some whole industries may be more imbalanced in favor of one stakeholder group, such as employees, over others, such as customers and suppliers. In these situations, what happens to a firm that has a different stakeholder balance? Is it still able to attract high-quality stakeholders (Jones et al., Reference Jones, Harrison and Felps2018)? How do competitors respond if a firm changes its balance? Could the balancing of stakeholder interests relative to rivals actually be an important element of competitive dynamics (e.g., Chen & Miller, Reference Chen and Miller2012)? The performance implications of imbalances in SMP within and across industries could be very interesting.
In addition, researchers could investigate the extent to which firms do/should purposely seek imbalance in favor of stakeholders that fit best with their business strategies. For instance, low-cost firms might favor investors, whereas differentiated firms may favor customers. Thus, drawing on the idea that SMP may moderate strategy, it would be interesting to see if types of imbalance are related to business and corporate strategies and whether their fit (or lack of fit) leads to higher (or lower) firm performance. Future research might also look at changes over time (Wang & Choi, Reference Wang and Choi2013). How does an economic shock, such as the Great Recession or a pandemic, impact a firm’s attention to issues of importance to various stakeholders?
It would also be interesting to examine variations in attention and resources allocated across stakeholders without the assumption of a zero-sum game, replacing it with the idea that increased allocations to one stakeholder do not necessarily reduce allocations to one or more other stakeholders (Jones & Harrison, Reference Jones, Harrison, Barney, Harrison, Freeman and Phillips2019). Garcia-Castro and Aguilera (Reference Garcia-Castro and Aguilera2015) discuss what they call value creation-appropriation elasticity, which occurs in situations in which increased allocations to one stakeholder increase the total value created and thus available to all stakeholders. This concept is similar to what Jones et al. (Reference Jones, Donaldson, Freeman, Harrison, Leana, Mahoney and Pearce2016) call pareto optimality, in which one stakeholder is made better off and no other stakeholder is made worse off. Under this sort of operationalization, it might be possible to track shifts in resource allocations to areas that are aligned with particular stakeholders and the impact of these shifts on performance, thus identifying a sort of optimal imbalance, from a performance perspective.
Last, the concept of fairness could be explored in greater detail. For example, Garcia-Castro and Francoeur (Reference Garcia-Castro and Francoeur2016) found that very high performing firms tend not to completely neglect any stakeholder, nor do they give a very high level of attention to any stakeholder. To what extent does variation between stakeholders affect perceptions of fairness, and consequently firm performance? Research in social inequality has found that a high degree of variation between the bottom and top is bad not just for those at the bottom but also for those at the top (Wilkinson & Pickett, Reference Wilkinson and Pickett2010). Our study found that very high SMP variation is negatively related to firm performance—to what extent might this be related to stakeholder perceptions of fairness?
Limitations
Our study, like all empirical work, suffers from limitations, some of which provide future research opportunities. One important weakness is that our sample was limited to the US context, where cultural and business factors are likely to be more uniform than they would be in cross-country studies. There is an opportunity to replicate or extend this study using cross-country samples with an eye on potential country-level moderators, such as power distance, individualism/collectivism, and other cultural dimensions (Hofstede, Reference Hofstede1991).
There are also weaknesses associated with using the KLD database. We were intentional in using KLD data because we are introducing a new measure into a very well-established stream of research that includes at least one hundred previous studies (Mattingly, Reference Mattingly2017), and we wanted comparability. However, we recognize the weaknesses apparent when using this sort of database. For example, while we accept the idea that a firm that, for example, has an employee profit-sharing program and strong health and safety programs is providing more attention and resources to employees than a firm that only does one of these things, the fact is that the relationship is not linear (the firm with two attributes is not providing twice as much attention and resources to employees), yet that is the assumption we have to make when using a database like KLD.
In addition, owing to issues with the comparability of the KLD data over time, our sample time frame ended in 2013. Future research using a different data set could be extended beyond this date. Finally, we were limited to the stakeholder variables supplied in the KLD database. As research moves forward in this space, many more areas that are relevant to stakeholders can be included in models based on instrumental stakeholder theory. Indeed, some bold researchers who study instrumental stakeholder theory have used a variety of data that are not based at all on some of the larger databases (Henisz et al., Reference Henisz, Dorobantu and Nartey2014; Sisodia et al., Reference Sisodia, Wolfe and Sheth2007). The data collection efforts for these two studies were nothing short of monumental, and we give high praise to the researchers for conducting them.
CONCLUSION
We reconceptualize SMP by including the key mechanism of balance/imbalance, leading to a new construct we call SMP variation. We theorize and find support for an inverted U–shaped relationship between SMP variation and firm performance. We hope that this simple and elegant construct will be helpful to future researchers examining the advantages and disadvantages of stakeholder management. Managers should recognize the need for variation in the attention and resources they allocate to their stakeholders but also be wary of widely disproportionate allocations.
Acknowledgements
Zhou Zhang acknowledges financial support from the Social Sciences and Humanities Research Council (grant 435-2016-0935) and CPA Research Scholar. The authors thank the editor, Bruce Barry, and three anonymous reviewers for their constructive comments during the review process.
André O. Laplume, associate professor, teaches and researches strategic management, entrepreneurship, and innovation at the Ted Rogers’ School at Ryerson University. His research articles have appeared in leading journals, including the Journal of Management, Research Policy, Human Relations, and the Journal of International Business Studies. His focus is to study the intersections and dynamics of incumbent firms and new entrants, including both positive and potentially negative interactions.
Jeffrey S. Harrison (harrison@richmond.edu, corresponding author) is a University Distinguished Scholar and the W. David Robbins Chair of Strategic Management at the University of Richmond. His primary research interests focus on stakeholder theory, especially as applied in strategic management to enhance value co-creation with a firm’s stakeholders. Much of his work has been published in high-impact academic journals, such as Academy of Management Journal, Academy of Management Review, Strategic Management Journal, the Journal of Management, Business Ethics Quarterly, and the Journal of Business Ethics. He has published thirteen books, most recently Sustaining High Performance in Business: Systems, Resources and Stakeholders.
Zhou Zhang is an associate professor in finance at the Faculty of Business Administration, University of Regina. He was the recipient of CPA Research Scholar, Leaders Council Scholar, Viterra Faculty Fellow, and CMA Faculty Fellow. Zhang’s research interests are primarily in corporate finance areas with a focus on cross-country studies. He also conducts cross-disciplinary research on corporate social responsibility and occupational community. He has published articles in the Journal of Business Ethics, the Journal of Corporate Finance, Financial Review, the Accounting, Auditing, and Accountability Journal, the British Journal of Management, and the Journal of Business Research.
Xin Yu is senior lecturer at the University of Queensland Business School. Her research interests include corporate governance, family business, and corporate disclosure. Yu has published in leading journals, including the Journal of Business Ethics, the Journal of Business Research, the Journal of Business Finance and Accounting, British Accounting Review, and Financial Management.
Kent Walker, associate professor, has been at the Odette School of Business, University of Windsor for eleven years and is currently the MBA program director. He has published in journals like Organization Studies, Journal of Business Ethics, and the British Journal of Management. He has also published eight teaching cases and recently published a book on meditation and happiness.


