


Introduction
Upland rice cropping has become a familiar part of the landscape in Madagascar’s central highlands (Raboin et al., Reference Raboin, Randriambololona, Radanielina, Ramanantsoanirina, Ahmadi and Dusserre2014), spreading over hillsides at middle and high altitudes (from 750 to 1800 m asl.). Ferralsols are the major soil type in this sloping terrain (Grinand et al., Reference Grinand, Rajaonarivo, Bernoux, Pajot, Brossard and Razafimbelo2009). These highly weathered acidic soils contain little soil organic matter and nutrients and are characterized by their low capacity to retain applied nutrients and their high potential to fix phosphorus (von Uexküll and Mutert, Reference von Uexküll and Mutert1995). Use of mineral fertilizer is uniformly low in rural Madagascar because of its excessive cost (Minten et al., Reference Minten, Randrianarisoa and Barrett2007). To sustain crop production and reduce erosion, conservation agriculture (CA), which involves minimal soil disturbance or no-till, permanent soil cover with crops, cover crops, or a mulch of crop residues and crop rotations, has been proposed to farmers (Husson et al., Reference Husson, Séguy, Charpentier, Rakotondramanana Michellon, Raharison, Naudin, Enjalric, Moussa, Razanamparany, Rasolomanjaka, Bouzinac, Chabanne, Boulakia, Tivet, Chabierski, Razafintsalama, Rakotoarinivo, Andrianasolo, Chabaud, Rakotondralambo and Ramaroson2013). As the promotion of CA in smallholder farming systems is still the subject of debate, its potential benefits for smallholder farmers require further assessment (Corbeels et al., Reference Corbeels, de Graaff, Ndah, Penot, Baudron, Naudin, Andrieu, Chirat, Schuler, Nyagumbo, Rusinamhodzi, Traore, Mzoba and Adolwa2014; Giller et al., Reference Giller, Witter, Corbeels and Tittonell2009).
Changing from conventional tillage (CT) to CA cropping systems can have a major impact on N dynamics in the soil (Scopel et al., Reference Scopel, Triomphe, Affholder, Da Silva, Corbeels, Xavier, Lahmar, Recous, Bernoux, Blanchart, De Carvalho Mendes and De Tourdonnet2013) as well as on N uptake by rice (Dusserre et al., Reference Dusserre, Chopart, Douzet, Rakotoarisoa and Scopel2012). Mulching with crop residues reduces soil water evaporation and runoff but increases drainage (Scopel et al., Reference Scopel, Findeling, Chavez Guerra and Corbeels2005). Part of the soil N supply originates from the decomposition of residues from the previous crop. The N mineralization pattern of crop residues is determined by different factors including the quality of the residues, the type of soil, temperature, moisture, and the location of the crop residues. Crop residues with a high carbon (C) to N ratio, such as straw from cereal crops, immobilize N during the early stages of their decomposition and consequently compete with the following crop for available N in the soil (Mary et al., Reference Mary, Recous, Darwis and Robin1996; Recous et al., Reference Recous, Robin, Darwis and Mary1995). In contrast, residues from legumes – which generally have a lower C to N ratio – may rapidly release their N. Rapid release of large amounts of N may in turn lead to losses through leaching, since crop N uptake is low at the beginning of the growing season (Crews and Peoples, Reference Crews and Peoples2005).
Soil N availability is a major limiting factor in low-input farming systems with limited access to mineral N and hence relies to a greater extent on sources of organic inputs and their mineralization (Dawson et al., Reference Dawson, Huggins and Jones2008). The N in the soil that is available during the growing season comes from different origins: the soil itself, organic matter returns (harvest residues, organic amendments), atmospheric inputs (by deposition or precipitation), and fertilizers. Soil N consists of inorganic N at planting time and the integral over the net mineralization rate up to the time of harvest of the crop. Net mineralization is the sum of two components: humus mineralization, which results from the decomposition of stabilized organic matter in the soil, and mineralization of crop residues or organic amendments added to the soil. The N balance in the soil–plant system depends on the main processes that affect the inorganic N content of the soil, that is, mineralization, immobilization, nitrification, volatilization, denitrification, and leaching, and the source/sink effect of the crop, that is, symbiotic N fixation, and absorption of inorganic N. Crop models can be used to integrate N and water dynamics over the growing season. C and N cycling strongly depend on interactions among plant growth processes, soil water dynamics, and soil N dynamics that are highly nonlinear and hence difficult to predict using simple approaches. Crop models, like the Decision Support Systems for Agrotechnology Transfer (DSSAT) model (Hoogenboom et al., Reference Hoogenboom, Porter, Shelia, Boote, Singh, White, Hunt, Ogoshi, Lizaso, Koo, Asseng, Singels, Moreno and Jones2019; Jones et al., Reference Jones, Hoogenboom, Porter, Boote, Batchelor, Hunt, Wilkens, Singh, Gijsman and Ritchie2003), are based on ecological principles and simulate crop development and growth as a function of weather conditions, soil properties, and management practices. DSSAT has been used to compare the performance of different cropping systems and crop production technologies (Caviglia et al., Reference Caviglia, Sadras and Andrade2013; Corbeels et al., Reference Corbeels, Chirat, Messad and Thierfelder2016; Jagtap and Abamu, Reference Jagtap and Abamu2003) and has also been used to assess and analyze the agronomic performance of CA cropping systems (Corbeels et al., Reference Corbeels, Chirat, Messad and Thierfelder2016; Gerardeaux et al., Reference Gerardeaux, Giner, Ramanantsoanirina and Dusserre2012; Ngwira et al., Reference Ngwira, Aune and Thierfelder2014).
The aim of the work reported here was to study the effects of contrasted cropping systems on upland rice yield and N uptake in rainfed conditions. We used the DSSAT crop model on the assumption that it is sufficiently robust to simulate the main soil N fluxes (mineralization, immobilization, leaching, nitrification, and denitrification) and can be used to predict soil N availability for crops depending on the cropping system. The analysis was performed on data collected in different experiments comparing cropping systems in CT, CA with a mulch of maize, and CA with a legume mulch.
Materials and Methods
Site description
Three experiments were conducted in the vicinity of the village of Ivory, in the mid-west region of Madagascar (19°33′27 S, 46°24′43 E, 960 m asl.) over five consecutive upland rice cropping seasons, 2012–2013, 2013–2014, 2014–2015, 2015–2016, and 2016–2017 (hereafter referred to as 2013, 2014, 2015, 2016, and 2017). The climatic conditions correspond to a tropical savannah climate, with a unimodal rainfall pattern. Rains start in November and end in April. Cumulative rainfall was 1452 mm in the 2013 cropping season, 1194 mm in 2014, 1814 mm in 2015, 1274 mm in 2016, and 1343 mm in 2017 (Figure 1). Monthly mean temperatures at the site ranged from 23.5 to 25.6 °C during the five cropping seasons. Daily temperatures, solar radiation, and rainfall data were recorded by an on-site automatic meteorological station (ENERCO 404 Series, Cimel, France). According to Jones et al. (Reference Jones, Breuning-Madsen, Brossard, Dampha, Deckers, Dewitte, Gallali, Hallett, Jones, Kilasara, Le Roux, Micheli, Montanarella, Spaargaren, Thiombiano, Van Ranst, Yemefack and Zougmoré2013), the soil is classified as Haplic Ferralsol (Oxisol order of the US Soil Taxonomy). Several soil profiles were characterized at the site, and for the experiments, we used a soil profile type containing 20% of clay and 32% of silt. Soil water-holding characteristics were estimated at 0.14 as the lower limit and at 0.28 as the drained upper limit, with total soil N, P, and C concentrations of, respectively, 0.9, 0.6, and 10.8 g kg−1, a pH (water) of 5, and a soil bulk density of 1.16 g cm−3 in experiment 1, and total soil N, P, and C concentrations of, respectively, 1.0, 0.8, and 12.2 g kg−1, a pH (water) of 5.4, and a soil bulk density of 1.10 g cm−3 in experiments 2 and 3, in the top 20 cm of the soil profile.

Figure 1. Rainfall and accumulated rainfall (mm) at the experimental site during the five growing seasons. Season 2012–2013: rice sowing date November 30, harvest March 29; Season 2013–2014: sowing date November 20, harvest March 27; Season 2014–2015: sowing date November 29, harvest April 6 in experiment 1; sowing date November 26, harvest March 25 in experiment 2; Season 2015–2016: rice sowing date November 23, harvest March 31; Season 2016–2017: sowing date November 16, harvest March 15.
Experimental designs
The data originate from three separate experiments (Table 1). The same upland rice (Oryza sativa L.) variety New rice Africa (NERICA) 4 was sown in all three experiments. A randomized block design was used in all the experiments with six replicates. In experiment 1, upland rice was grown with CT only, and data were used for model calibration. In experiment 2, upland rice was evaluated over a two-year period (2015 and 2016) under three cropping systems (Table 1). In experiment 3, upland rice was evaluated over a one-year period (2017) under two cropping systems (Table 1), but the cropping systems were older. The treatments had been stabilized for five cropping seasons, which allowed us to compare a cropping system with Stylosanthes managed as a living cover with total restitution of crop residues versus a cropping system managed conventionally with repeated plowing with total export of residues.
Table 1. Description of the experimental treatments in the different datasets. T or CT: conventional tillage; CAm: no-tillage with a mulch of maize; CAs: no-tillage with a mulch of stylosanthes; uN: unit of N applied in kg h−1; LAI: Leaf area index (m2 m−²); AGPN: aboveground plant N (kg ha−1); AGB: aboveground biomass (t ha−1); GY: grain yield (t ha−1); RLD: Root length density (cm cm−3); SN: Soil inorganic N content (kg ha−1)

*At sowing, a base dressing of 5000 kg ha−1 of cattle manure (N concentration 1.4%), 150 kg ha−1 of triple superphosphate, 130 kg ha−1 of potassium sulfate, and 500 kg ha−1 of dolomite was applied to each hill in all the plots in experiment 1; a base dressing of 100 kg ha−1 of triple superphosphate was applied to each hill in all the plots in experiment 2 and a base dressing of 10 000 kg ha−1 of cattle manure (concentration of 0.93% N) was applied to each hill in all the plots in experiment 3. In experiments 1 and 2, urea was split into three equal amounts and applied at the emergence stage, the tillering stage, and the booting stage. In experiment 3, urea was split into two equal amounts and applied at the emergence stage and the tillering stage.
In experiment 1, the size of the elementary plot was 2 m × 3.8 m with a total of 190 hills; hill spacing was 20 cm × 20 cm, and 4 to 6 seeds were sown in each hill. In experiment 2, the size of elementary plot was 6 m × 7 m with a total of 1 050 hills; hill spacing was 20 cm × 20 cm. In experiment 3, the size of elementary plot was 15 m × 9 m; hill spacing was 30 cm × 20 cm.
Measurements
Soil inorganic N contents were measured at the beginning of the cropping season, and in experiment 3 only, soil inorganic N content was also measured at the booting, flowering, and harvest stages of upland rice, in the 0- to 80-cm soil layer. Inorganic N (nitrate and ammonium) was measured by continuous flow colorimetry after extraction with a 1M KCl solution.
The number of days to flowering was recorded at the 50% flowering stage, that is, when the anthers extruded from the spikelets in 50% of the plants. In experiment 1 only, for the model settings (genetic coefficients), the leaf area index (LAI) was measured nondestructively in individual plots using a SunScan (Delta-T Devices, Cambridge, UK) placed under the rice canopy, with five readings per plot. In all three experiments, in each plot, whole plants on four hills (0.16 m2) were cut at ground level and pooled to form one sample. The plant samples were oven dried at 60 °C for 72 h and weighed to estimate biomass at flowering (and also at the booting stage in experiments 2 and 3).
In experiment 2 only, the spatial distribution of roots was measured twice, at the booting stage, and at the flowering stage, on four replicates. Using a grid with a 5 × 5 cm mesh, root intersections of the upland rice were counted down to a depth of 80 cm over 40-cm-wide soil profiles. Root length density was calculated from the number of root intersections (Dusserre et al., Reference Dusserre, Audebert, Radanielson and Chopart2009).
At maturity, grain and straw yields were measured in an area (5.4 m² in experiment 1 and 20 m² in experiments 2 and 3) located in the center of each plot to exclude the edges of the crop. Whole plants from nine hills (0.36 m²) were harvested in the middle of each plot and separated into straw and panicles. The panicles were hand threshed, and filled spikelets were separated from unfilled spikelets. The dry weights of filled spikelets and straw were determined after oven drying at 60 °C for 72 h. As described in Rakotoson et al. (Reference Rakotoson, Dusserre, Letourmy, Ramonta, Cao, Ramanantsoanirina, Roumet, Ahmadi and Raboin2017), the concentration of N in the filled grain and in the straw at harvest was assessed by near-infrared spectrometry (Labspec 4 spectrometer; ASD Inc., Malvern Panalytical, UK) calibrated against a Dumas procedure using a Leco-N-analyzer (FP528; Leco Inc., St Joseph, USA). Crop N uptake was calculated as (grain yield × grain N content/100) + (straw yield x straw N content/100). The agronomic efficiency of N fertilizer (AEN), which represents the amount of grain produced per unit of N applied in kg−1 N, was calculated as (grain yield in the treatment with inorganic N fertilization − grain yield in the treatment with no inorganic N fertilizer)/quantity of N fertilizer.
Statistical analyses were performed with SAS 9.3 (SAS Institute Inc., Cary, NC, USA). The generalized linear model procedure was used for analysis of variance. Means were compared according to the least significant difference (LSD) with Fisher’s LSD test with a probability level of 0.05. Graphs and regressions were performed with Sigma plot version 12.5 (Systat Software Inc.).
Model setting
DSSAT is a complex nonlinear dynamic model that simulates outputs such as crop development and yield as a function of a large number of input parameters, including plant and soil parameters, whose values are usually estimated based on field experiments, or taken from available literature, or determined through model calibration. To begin a DSSAT simulation, the model is informed about the specific weather, crop, and soil characteristics. The corresponding input files are linked to the main structure of the model, comprising the modules for the field characterization, the initial soil conditions, and the management operations. A detailed description of the DSSAT model with its modules is given in Jones et al. (Reference Jones, Hoogenboom, Porter, Boote, Batchelor, Hunt, Wilkens, Singh, Gijsman and Ritchie2003). DSSAT has been regularly revised to improve the biophysical representation of soil water, organic matter and nutrient (N and P) dynamics, and their effects on crop growth and yield. The CENTURY soil organic matter model was incorporated in DSSAT by Gijsman et al. (Reference Gijsman, Hoogenboom, Parton and Kerridge2002) to improve simulations of long-term soil C and N dynamics. In 2010, further modifications were made to DSSAT to simulate the effects of tillage and surface crop residues on soil water and organic matter dynamics (Porter et al., Reference Porter, Jones, Adiku, Gijsman, Gargiulo and Naab2010).
In this study, we used (1) DSSAT version 4.6, with Crop Environment REsource Synthesis (CERES)-wheat as the crop model that we adapted for upland rice because the plant model settings were more complete than CERES-rice, (2) CENTURY to simulate soil C and N dynamics, and the Ritchie soil–water balance model. The model was parameterized and calibrated for the soil according to the treatments used in experiment 3, and for the crop (genetic coefficients) according to the treatments used in experiment 1 (Supplementary S1). We then validated the model on data from experiment 2 under the CT and CA treatments.
The results of the simulations were analyzed in terms of the N balance components. The main fluxes were N mineralization, N immobilization, crop N uptake, and N leached throughout the crop cycle. Because urea was incorporated in the soil, we assumed that few losses occurred through volatilization, and N losses by denitrification remained low (but were nevertheless included in the N balance). For crop N uptake, model simulations were compared with observed data using the following listed statistics: root mean square error, least-squares coefficient of determination (R²), and the linear regression (1:1) plot were used as an indicator of whether the models under or overestimated measured crop N uptake.
Results
Grain yield and components, N content, and crop N uptake in contrasted cropping systems
In experiment 2, the results are presented separately for the 2 years due to an interaction with the year. In 2015, there was no interaction between the cropping system and the N application (Table 2). Grain yields were equivalent in CT and CA with a mulch of Stylosanthes but lower in CA with a mulch of maize. Higher yields were associated with more panicles per m² in CA with a mulch of Stylosanthes and more spikelets per panicle in CT. We observed no effect of the cropping system on the crop N uptake at harvest and neither at flowering. However, the effect of the cropping system was significant on the grain and straw N contents, CT having the lowest grain and straw N contents. Yields obtained without N application were very low regardless of the cropping system (0.78 t ha−1 on average). The effect of N application was significant for all the traits, and the AENs were high: 47.1 kg−1 N in CT, 33.5 kg−1 N in CA with a mulch of Stylosanthes, and 28.8 kg−1 N in CA with a mulch of maize.
Table 2. Rice grain yield (t ha−1), grain, and straw N content (%), crop N uptake at harvest and at flowering (kg ha−1), number of panicles per m², number of spikelets per panicle, percentage of filled grain (%), and 1000 grain weight (g) of upland rice in experiment 2 in 2015, under the different cropping systems: conventional tillage (CT), no-tillage with a mulch of maize (CAm), and no-tillage with a mulch of Stylosanthes (CAs); and two levels of inorganic N application: with no inorganic N application (N0) and with an application (N) of 60 N kg ha−1. within treatments, means followed by different letters are significantly different according to LSD (p < 0.05)

In 2016, we observed interactions between the cropping system and the application of N (Table 3). Like in 2015, grain yields were equivalent in CT and CA with a mulch of legume but lower in CA with a mulch of maize. There was a significant effect of the cropping system on all yield components. Higher crop N uptake at harvest was observed in CA with mulch of velvet bean than in CT with N application, although crop N uptakes at flowering stage were equivalent. The effect of N application was not always significant, and AEN was lower than in 2015, except in CA with a mulch of maize, which had a similar AEN in the two seasons: 11.4 kg−1 N in CT, 19.4 kg−1 N in CA with a mulch of stylosanthes, and 29.4 kg−1 N in CA with a mulch of maize.
Table 3. Rice grain yield (t ha−1), grain and straw N content (%), crop N uptake at harvest and at flowering (kg ha−1), number of panicles per m², number of spikelets per panicle, percentage of filled grain (%) and 1000 grain weight (g) of upland rice in experiment 2 in 2016, under the different cropping systems: conventional tillage (CT), no-tillage with a mulch of maize (CAm), and no-tillage with a mulch of velvet bean (CAv); and two levels of inorganic N application: with no inorganic N application (N0) and with an application (N) of 60 N kg ha−1. Within treatments, means followed by different letters are significantly different according to LSD (p < 0.05)

In experiment 3, grain yield and crop N uptakes obtained in 2017, following five growing seasons with the same rotations, were higher in CA with a Stylosanthes mulch than in CT (Table 4). Among yield components, only the number of panicles per m² differed significantly between cropping systems and was significantly higher in CA than in CT.
Table 4. Rice grain yield (t ha−1), grain and straw N content (%), crop N uptake at harvest and at flowering (kg ha−1), number of panicles per m², number of spikelets per panicle, percentage of filled grain (%), and 1000 grain weight (g) of upland rice in experiment 3 in 2017, under the different cropping systems: conventional tillage (CT) and no-tillage with a mulch of Stylosanthes (CAs). Within treatments, means followed by different letters are significantly different according to LSD (p < 0.05)

Evaluation of DSSAT model and N balance
We evaluated the ability of the DSSAT model to simulate the amount of crop N uptake. There was a good agreement between model simulated and observed values for crop N uptake at harvest and at flowering stage for the three experiments (Figure 2a and b). We also found a good correlation between simulated and observed grain yield (Figure 2c), although grain yield was overestimated for experiments 2 and 3. Factors other than N could have limited grain yield in experiments 2 and 3. Improved base dressing in experiment 1 could explain the higher grain yields observed in this experiment. Figure 2d shows measured and simulated amounts of soil inorganic N in the 0- to 80-cm soil layer in experiment 3 in the 2017 season. Accurate simulation of inorganic N in the soil profile during the cropping season was obtained for CT. DSSAT predicted early and late season amounts fairly well, but slightly underpredicted the amounts for CA in the middle of the season. Nevertheless, the results showed a higher amount of soil inorganic N in CA with a legume mulch than in CT during part of the cropping season.
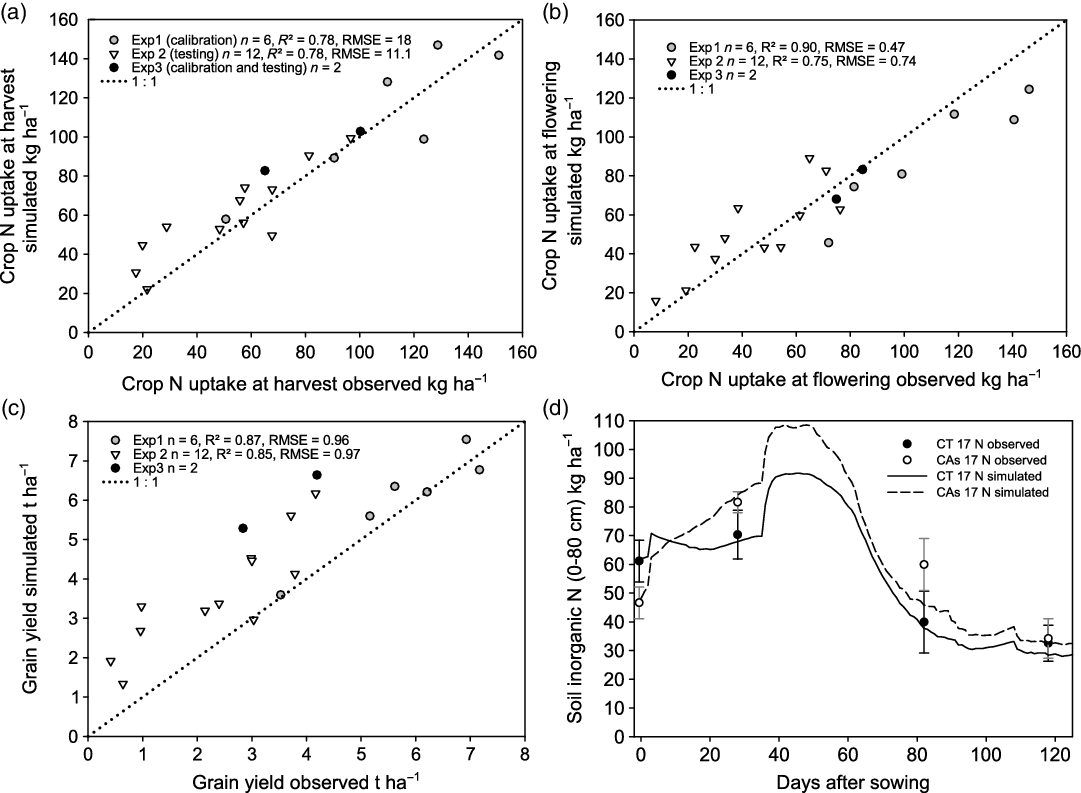
Figure 2. Comparison of observed and simulated crop N uptake at harvest (a), at flowering stage (b), grain yield (c) in the different experiments, and soil inorganic N content (d) in experiment 3. The dotted line is the 1:1 line.
Simplified N balances simulated by the DSSAT model for experiments 2 and 3 are presented in Figure 3. The N available estimated by the model was related to the yield and crop N uptake (Figure 4). The variations of yield and crop N uptake between cropping system and N application can be largely explained by the variations of N available in the soil as simulated by DSSAT. Between the two seasons in experiment 2, the higher level of N losses in 2015 than in 2016 (Figure 3a and b) was mainly due to leaching because of high rainfall in 2015 (see Figure 1). The N supply was higher in CA than in CT in both seasons (Figure 3a and b), but losses through leaching and immobilization were higher in CA (immobilization was particularly high in CA with a mulch of maize). The higher N losses in CA finally resulted in less difference than expected in available N between CT and CA with a legume mulch.

Figure 3. Simplified N balance simulated by the DSSAT model for experiment 2 in 2015 (a), in 2016 (b) and in experiment 3 in 2017 (c), with conventional tillage (CT), no-tillage with a mulch of maize (CAm), no-till with a mulch of Stylosanthes (CAs) or no-till with a mulch of velvet bean (CAv), and two levels of inorganic N application: no inorganic N application (N0) and with an application (N) of 60 N kg ha−1 in 2015 and 2016 or 32 N kg ha−1 in 2017.
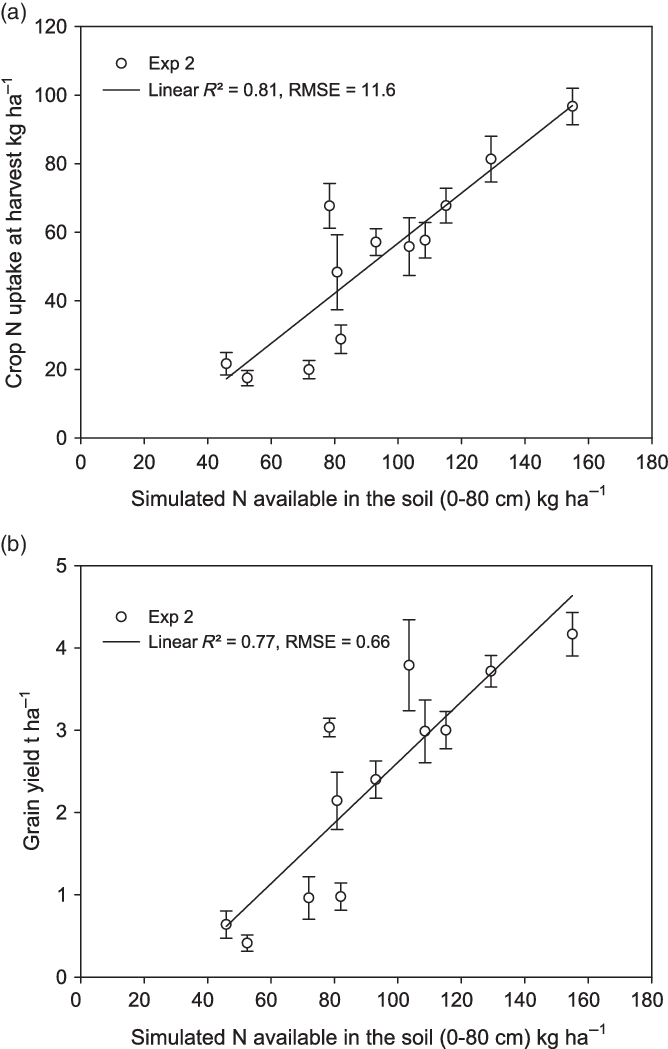
Figure 4. The relationship between observed crop N uptake at harvest and simulated N available in the soil (a) and the relationship between observed grain yield and simulated N available in the soil (b) in experiment 2. The bars represent standard errors.
In experiment 3, a bigger supply of N was observed in CA with a Stylosanthes mulch than in CT (Figure 3c, N input of 213 kg ha-1 in CT, 308 in CA) concomitantly with higher simulated N losses in CA, thus reducing the difference in soil available N between CT and CA (available N (N input – N losses) of 127 kg ha-1 in CT and 153 in CA).
N uptake and utilization efficiencies
Using all the experiments, an overall linear relationship was observed between simulated available N in the soil (0–80 cm) and crop N uptake observed at harvest, with an R² of 0.86 (Figure 5a, y = – 20.1 + 0.79x). The slope of the relationship between crop N uptake and available N is the N uptake efficiency (NUPE) of the upland rice variety NERICA 4. A quadratic relationship was obtained between observed grain yield and crop N uptake at harvest, with an R² of 0.93 (Figure 5b, y = –0.365 + 0.057x –3.82e-5x²). The slope of the relationship between grain yield and crop N uptake is the N utilization efficiency (NUTE) of the upland rice variety NERICA 4.

Figure 5. The relationship between observed crop N uptake at harvest and simulated N available in the soil (a) and the relationship between observed grain yield and crop N uptake at harvest (b) for all experiments.
Discussion
Upland rice yield
In experiment 1, conducted only under CT, the grain yields obtained were high (between 4 and 7 t ha−1, cf. Figure 2c), probably due to the application of an improved base dressing. In experiment 2, upland rice yields were higher or equivalent under CA with a legume mulch than under CT cropping systems, but lower under CA with a mulch of maize. It is recognized that keeping the residues of the previous crop may lead to N immobilization. This may be particularly limiting under low-input management systems when there are no minerals available to balance N immobilization and when large quantities of residues remain on the soil surface (Baldé et al., Reference Baldé, Scopel, Affholder, Corbeels, Da Silva, Xavier and Wery2011). Lower yields in CA with a mulch of maize were associated with a reduction in almost all yield components. Whereas, the differences between CT and CA with a legume mulch cropping systems were less contrasted except in experiment 3. In experiment 3, CA with a mulch of Stylosanthes yielded significantly better than CT, five years after the conversion to CA, as a result of an increased number of panicles per m² and number of spikelets per panicle. The improvement of yield after conversion to CA in combination with legume rotation is a long-term process (Rusinamhodzi et al., Reference Rusinamhodzi, Corbeels, Van Wijk, Rufino, Nyamangara and Giller2011).
Relevance of DSSAT crop growth model in simulating rainfed rice under contrasted cropping systems
DSSAT has already been used to assess and analyze the agronomic performance of CA cropping systems (Corbeels et al., Reference Corbeels, Chirat, Messad and Thierfelder2016; Gerardeaux et al., Reference Gerardeaux, Giner, Ramanantsoanirina and Dusserre2012; Ngwira et al., Reference Ngwira, Aune and Thierfelder2014), and these studies demonstrated that DSSAT can be used to simulate crop responses to CA, in particular by simulating the effects of mulching on the soil water balance. Here, we show that DSSAT is sufficiently robust and adaptable to simulate the soil N balance in contrasting cropping systems and can be used to predict N uptake and yield. In our case, we did not make any changes to the model settings for the different cropping systems, whereas to reproduce observed maize yields under the CT versus CA treatment, Corbeels et al. (Reference Corbeels, Chirat, Messad and Thierfelder2016) had to restrict optimal root development in the model in the CT treatment (due to the existence of a plow pan).
Interpretation of N flux with DSSAT
Leaching was a major N flux. The valorization of the soil N supply by the crop depended on N leaching, which itself was influenced by the rainfall pattern. N losses are likely to be high under the heavy rainfall typical of the tropics. According to the DSSAT N balance, N losses by leaching accounted for between 14 and 53% of the total N losses under CT, between 22 and 51% under CA with mulch. Greater drainage can be expected under CA with mulch than under CT due to the reduction of surface water runoff and soil evaporation rates. The phenomenon of increased deep drainage under CA compared with CT has already been observed in the field and simulated in Brazilian oxisols (Scopel et al., Reference Scopel, Da Silva, Corbeels, Affholder and Maraux2004). Deep drainage involves a risk of nutrient leaching. The large pool of easily decomposable organic compounds from surface residues adds to the risk of nutrient leaching in CA systems.
Legume fallows are expected to supply increased N inputs to the system. In this study, a gain in N available in the soil was obtained with the application of a legume mulch, but the gain depended on the type of legume and on the season (Figure 3). Studies involving the application of 15 N labeled legume residues have shown that between 10 and 30% of the legume N is commonly taken up by the following crop (Crews and Peoples, Reference Crews and Peoples2005). It has also been shown that Stylosanthes fallow can increase rice yield compared to a natural fallow (Becker and Johnson, Reference Becker and Johnson1999; Saito et al., Reference Saito, Linquist, Keobualapha, Phanthaboon, Shiraiwa and Horie2006). These different authors reported that the increase in rice yield was related to the amount of N inputs originating from the legume fallow. In a recently installed experiment on a rice-Stylosanthes crop rotation at the same site as the present study, Zemek et al. (Reference Zemek, Frossard, Scopel and Oberson2018) concluded that, although Stylosanthes can fix significant amounts of N2 and produce high amounts of dry matter, the final N contribution to rice was small (15 N recoveries in rice ranged from 5 to 8% from a Stylosanthes mulch). According to Zemek et al. (Reference Zemek, Frossard, Scopel and Oberson2018), the contribution of the Stylosanthes mulch to the following rice crop was small because its decomposition was incomplete and the N released was mainly present in a form that is not available to plants because the Stylosanthes mulch was placed on top of the soil and also due to its rather high C:N ratio (55).
N uptake
A previous experiment revealed the existence of significant genetic variability for N use efficiency (NUE) and its components (NUPE and NUTE) among a set of 13 varieties representative of the genetic diversity of the tropical japonica group adapted for upland cultivation at mid-altitude in Madagascar, including the variety NERICA 4 (Rakotoson et al., Reference Rakotoson, Dusserre, Letourmy, Ramonta, Cao, Ramanantsoanirina, Roumet, Ahmadi and Raboin2017). The relationship between NUE and agronomic and N-related traits differed from one year to the next, illustrating the plasticity of the contribution of the different agronomic traits to NUE as a function of the contrasted climatic conditions (particularly the rainfall distribution pattern). Here, we were able to estimate NUPE and NUTE for Nerica 4 variety by combining the results of different experiments and modeling (cf. Figure 5).
The cropping system affects crop N uptake and/or N content (Tables 2, 3, and 4). We hypothesize that the observed differences in grain and straw N content are due to differences in crop N uptake dynamics. It has already been shown that tillage has significant effects on the accumulation of aboveground biomass and N uptake in rice, particularly before and after the heading stage (Huang et al., Reference Huang, Zou, Jiang, Xia, Feng, Cheng and Mo2012). In an experiment in which no significant difference in grain yield and total aboveground biomass was observed between CT and no-tillage, Huang et al. (Reference Huang, Zou, Jiang, Xia, Feng, Cheng and Mo2012) showed that N uptake was 27% lower before heading but 73% higher after heading in the no-till system than in CT, indicating that N uptake was delayed in no-till rice. According to these authors, no-till rice roots were subject to an adverse environment in the early growth stage, with significant soil compaction of the 5- to 10-cm soil layer due to the lack of tillage. However, the negative effects of no-tillage on aboveground biomass production before heading were offset by its positive effects on aboveground biomass accumulation after heading. In late growth stages, given the higher rate of N available in the soil due to mineralization of the mulch, crop N uptake was higher under CA than under CT. This led to higher N content at harvest, particularly in the grain, under CA than under CT. Root length density measurements were performed on experiment 2 in both seasons (data not shown). A high variability between repetitions resulted in few significant differences between treatments, but the general tendency showed a greater development in the top-soil in CT and a greater vertical root development in CA. Greater and faster root development at the beginning of the upland rice crop cycle after the soil was plowed and greater vertical root development before the heading stage with no-tillage have already been observed in colder conditions (Dusserre et al., Reference Dusserre, Chopart, Douzet, Rakotoarisoa and Scopel2012).
Conclusion
The results of our different experiments indicate that N uptake by the upland rice crop can be optimized in CA cropping systems through various agronomic lever such as mulch quality (C–N ratio) or the application of mineral N. In these experiments, the performance of CA with a mulch of legume was always equivalent or superior to CT, but all these CA cropping systems were based on a rotation with a cover crop that does not produce edible grains (velvet bean or Stylosanthes). The focus should now be on optimizing rotations that associate maize and legumes especially if they are edible (maize and rice bean, maize and cowpea…), if adoption by smallholders is expected. The objectives would be to determine the best balance between the two crops, the optimum quantity of mulch that should be left over the soil, and the optimal quantity, timing, and splitting for the application of mineral N. Crop models such as DSSAT should be very helpful in that process.
DSSAT provided relevant N balance simulations that help dissect the effects of contrasting cropping systems, that is, the effect of CA versus CT including the effect of restitution versus non-restitution of residues, and the effect of contrasted mulch quality in CA between legume and maize crop residues. In our set of experiments, N losses estimated by the model were higher in CA than in CT in a given season, as a consequence of increased infiltration and leaching. Higher amounts of immobilized N were estimated in CA with mulches than in CT, and in CA with a mulch of maize than in CA with legume mulch. The model also seems to be able to distinguish between different types of legume as estimated N immobilization was higher with Stylosanthes than with velvet bean. Indeed, the challenge is now to evaluate the model in less contrasted experimental conditions to see if it can capture and explain finer variations between cropping systems: CT and CA cropping systems both with legume rotation and restitution of residues, different CA systems comparing the quality of different legume mulches, and so on. Only then will it be possible to use the model as a tool to design and optimize cropping systems.
Supplementary material
To view supplementary material for this article, please visit https://doi.org/10.1017/S0014479720000010
Acknowledgments
The authors would like to thank the Centre National de Recherche Appliquée au Développement Rural field staff in Madagascar for their excellent work. Special thanks to M. Corbeels for his advice on the manuscript. This work was supported jointly by Cariplo and Agropolis Foundations.
Financial support
None.


