


Background
Negative symptoms (e.g. amotivation, flattened affect) and cognitive impairments in individuals with psychotic disorders are strong predictors of poor functional outcome (Albert et al., Reference Albert, Bertelsen, Thorup, Petersen, Jeppesen, Le Quack, Krarup, Jørgensen and Nordentoft2011; Lepage et al., Reference Lepage, Bodnar and Bowie2014), and are less responsive to currently available medications compared to positive symptoms (e.g. hallucinations, delusions). Verbal memory (VM) is one of the most strongly impacted of all cognitive domains in individuals with psychotic disorders (Jordan et al., Reference Jordan, Lutgens, Joober, Lepage, Iyer and Malla2014; Benoit et al., Reference Benoit, Malla, Iyer, Joober, Bherer and Lepage2015; Guimond et al., Reference Guimond, Chakravarty, Bergeron-Gagnon, Patel and Lepage2016), and is linked to persistent negative symptoms (Hovington et al., Reference Hovington, Bodnar, Joober, Malla and Lepage2013). There is some evidence suggesting that VM and negative symptoms, particularly deficits in communication or expressivity, may share common neural substrates. Cohen and Elvevåg (Reference Cohen and Elvevåg2014) have suggested that expressivity is linked to classic language areas in psychiatric disorders, although such a relationship has not been demonstrated in the early stages of psychosis with non-invasive imaging techniques.
Many studies treat VM and negative symptoms as unitary constructs, although these variables are comprised of stable subdomains that are likely to be of clinical relevance; for instance, VM can be broken down into verbal learning and retention, and negative symptoms into amotivation and expressivity, all of which have unique environmental and biological correlates (Malla et al., Reference Malla, Takhar, Norman, Manchanda, Cortese, Haricharan, Verdi and Ahmed2002; Leeson et al., Reference Leeson, Robbins, Franklin, Harrison, Harrison, Ron, Barnes and Joyce2009; Millan et al., Reference Millan, Fone, Steckler and Horan2014). For instance, different facets of VM have been differentially associated to white matter microstructure (typically assessed using metrics such as fractional anisotropy from diffusion-weighted imaging) in healthy older adults, where white matter tracts subserving left fronto-parietal regions are related to verbal working memory, whereas bilateral fronto-temporal white matter is linked to long-term episodic memory function (Charlton et al., Reference Charlton, Barrick, Markus and Morris2013). Both grey and white matter abnormalities have been observed in relation to amotivation symptoms (e.g. avolition, apathy) in enduring schizophrenia patients, particularly decreased cortical thickness and fractional anisotropy underlying left orbital/medial frontal cortex and cingulate cortex (Ohtani et al., Reference Ohtani, Bouix, Hosokawa, Saito, Eckbo, Ballinger, Rausch, Melonakos and Kubicki2014; Mørch-Johnsen et al., Reference Mørch-Johnsen, Nesvåg, Faerden, Haukvik, Jørgensen, Lange, Andreassen, Melle and Agartz2015, Reference Mørch-Johnsen, Agartz and Jensen2018). A recent study has also shown that the integrity of white matter underlying the right hemisphere homologs of these regions is related to affective flattening (Ohtani et al., Reference Ohtani, Bouix, Lyall, Hosokawa, Saito, Melonakos, Westin, Seidman, Goldstein, Mesholam-Gately, Petryshen, Wojcik and Kubicki2015); however, beyond this study, very few have further investigated the structural brain correlates of expressivity deficits (Mørch-Johnsen et al., Reference Mørch-Johnsen, Agartz and Jensen2018), especially in first episode of psychosis (FEP) patients.
Importantly, and of relevance to the current study, longitudinal brain imaging studies of negative symptoms in FEP are scarce, although altered maturational trajectories of cortical thickness and limbic structure have been previously observed in patients with persistent negative symptoms (Makowski et al., Reference Makowski, Bodnar, Malla, Joober and Lepage2016, Reference Makowski, Bodnar, Shenker, Malla, Joober, Chakravarty and Lepage2017). Such longitudinal neuroimaging studies are critical to characterizing the emergence of clinical, cognitive, and neuroanatomical markers that may be amenable to intervention early in the course of the disorder. Existing literature examining progressive brain changes after a FEP, irrespective of symptom profiles, have reported widespread accelerated gray matter loss (Andreasen et al., Reference Andreasen, Nopoulos, Magnotta, Pierson, Ziebell and Ho2011; Gong et al., Reference Gong, Lui and Sweeney2016). Various structural and functional MRI reviews of FEP patients have pinpointed progressive brain changes occurring across frontal and temporal lobes, particularly within the left hemisphere (Radua et al., Reference Radua, Borgwardt, Crescini, Mataix-Cols, Meyer-Lindenberg, McGuire and Fusar-Poli2012; Vita et al., Reference Vita, De Peri, Deste and Sacchetti2012; Dazzan et al., Reference Dazzan, Arango, Fleischacker, Galderisi, Glenthøj, Leucht, Meyer-Lindenberg, Kahn, Rujescu, Sommer, Winter and McGuire2015). Further, evidence suggests that the stability of medial temporal and prefrontal cortices may be essential predictors of symptomatic and functional outcomes after the first episode of schizophrenia (Dazzan et al., Reference Dazzan, Arango, Fleischacker, Galderisi, Glenthøj, Leucht, Meyer-Lindenberg, Kahn, Rujescu, Sommer, Winter and McGuire2015).
White matter abnormalities have also been a key focus of studies of schizophrenia and related disorders, across different disease stages (Kubicki et al., Reference Kubicki, Park, Westin, Nestor, Mulkern, Maier, Niznikiewicz, Connor, Levitt, Frumin, Kikinis, Jolesz, McCarley and Shenton2005; Whitford et al., Reference Whitford, Grieve, Farrow, Gomes, Brennan, Harris, Gordon and Williams2007, Reference Whitford, Ford, Mathalon, Kubicki and Shenton2012; Carletti et al., Reference Carletti, Woolley, Bhattacharyya, Perez-Iglesias, Fusar Poli, Valmaggia, Broome, Bramon, Johns, Giampietro, Williams, Barker and McGuire2012; Lee et al., Reference Lee, Kubicki, Asami, Seidman, Goldstein, Mesholam-Gately, McCarley and Shenton2013; Birur et al., Reference Birur, Kraguljac, Shelton and Lahti2017; Klauser et al., Reference Klauser, Baker, Cropley, Bousman, Fornito, Cocchi, Fullerton, Rasser, Schall, Henskens, Michie, Loughland, Catts, Mowry, Weickert, Shannon Weickert, Carr, Lenroot, Pantelis and Zalesky2017; Kelly et al., Reference Kelly, Jahanshad, Zalesky, Kochunov, Agartz, Alloza, Andreassen, Arango, Banaj, Bouix, Bousman, Brouwer, Bruggemann, Bustillo, Cahn, Calhoun, Cannon, Carr, Catts, Chen, Chen, Chen, Chiapponi, Cho, Ciullo, Corvin, Crespo-Facorro, Cropley, De Rossi, Diaz-Caneja, Dickie, Ehrlich, Fan, Faskowitz, Fatouros-Bergman, Flyckt, Ford, Fouche, Fukunaga, Gill, Glahn, Gollub, Goudzwaard, Guo, Gur, Gur, Gurholt, Hashimoto, Hatton, Henskens, Hibar, Hickie, Hong, Horacek, Howells, Hulshoff Pol, Hyde, Isaev, Jablensky, Jansen, Janssen, Jönsson, Jung, Kahn, Kikinis, Liu, Klauser, Knöchel, Kubicki, Lagopoulos, Langen, Lawrie, Lenroot, Lim, Lopez-Jaramillo, Lyall, Magnotta, Mandl, Mathalon, McCarley, McCarthy-Jones, McDonald, McEwen, McIntosh, Melicher, Mesholam-Gately, Michie, Mowry, Mueller, Newell, O'Donnell, Oertel-Knöchel, Oestreich, Paciga, Pantelis, Pasternak, Pearlson, Pellicano, Pereira, Pineda Zapata, Piras, Potkin, Preda, Rasser, Roalf, Roiz, Roos, Rotenberg, Satterthwaite, Savadjiev, Schall, Scott, Seal, Seidman, Shannon Weickert, Whelan, Shenton, Kwon, Spalletta, Spaniel, Sprooten, Stäblein, Stein, Sundram, Tan, Tan, Tang, Temmingh, Westlye, Tønnesen, Tordesillas-Gutierrez, Doan, Vaidya, van Haren, Vargas, Vecchio, Velakoulis, Voineskos, Voyvodic, Wang, Wan, Wei, Weickert, Whalley, White, Whitford, Wojcik, Xiang, Xie, Yamamori, Yang, Yao, Zhang, Zhao, van Erp, Turner, Thompson and Donohoe2018). Evidence from post-mortem studies and diffusion tensor imaging suggests that white matter abnormalities, particularly within prefrontal regions, are more significantly correlated with negative symptoms compared with positive symptoms (Uranova et al., Reference Uranova, Vikhreva, Rachmanova and Orlovskaya2011; Asami et al., Reference Asami, Hyuk Lee, Bouix, Rathi, Whitford, Niznikiewicz, Nestor, McCarley, Shenton and Kubicki2014). Other neuroimaging studies have obtained proxy measures of myelin to better understand the nature of white matter alterations in psychosis (Andreasen et al., Reference Andreasen, Ehrhardt, Swayze, Tyrrell, Cohen, Ku and Arndt1991; Lang et al., Reference Lang, Yip, MacKay, Thornton, Vila-Rodriguez, MacEwan, Kopala, Smith, Laule, MacRae and Honer2014; Ganzetti et al., Reference Ganzetti, Wenderoth and Mantini2015; Iwatani et al., Reference Iwatani, Ishida, Donishi, Ukai, Shinosaki, Terada and Kaneoke2015). There is certainly a need to shift focus to earlier stages of psychosis, obtaining measures more proximal to a FEP, to better understand the cascade of brain structural alterations that follow.
Although measures of cortical thickness (CT) are often the choice of methodology for investigation of cortical structure in psychiatric disorders from T1-weighted MRI scans, inconsistencies have arisen in a number of studies of longitudinal cortical thickness trajectories in early psychosis, with a handful of studies contesting the evidence of progressive brain change after a FEP (Nesvåg et al., Reference Nesvåg, Bergmann, Rimol, Lange, Haukvik, Hartberg, Fagerberg, Söderman, Jönsson and Agartz2012; Roiz-Santiáñez et al., Reference Roiz-Santiáñez, Ortiz-García de la Foz, Ayesa-Arriola, Tordesillas-Gutiérrez, Jorge, Varela-Gómez, Suárez-Pinilla, Córdova-Palomera, Navasa-Melado and Crespo-Facorro2015; Haukvik et al., Reference Haukvik, Hartberg, Nerland, Jørgensen, Lange, Simonsen, Nesvåg, Dale, Andreassen, Melle and Agartz2016), emphasizing the need for novel approaches to analyze structural data in clinical cohorts. Obtaining a measure of white-gray matter contrast (WGC) from T1-weighted MRI may provide a meaningful marker of myelin content and other biophysical properties that may complement measures of cortical thickness (Salat et al., Reference Salat, Lee, van der Kouwe, Greve, Fischl and Rosas2009; Westlye et al., Reference Westlye, Walhovd, Dale, Espeseth, Reinvang, Raz, Agartz, Greve, Fischl and Fjell2009; Andrews et al., Reference Andrews, Avino, Gudbrandsen, Daly, Marquand, Murphy, Lai, Lombardo, Ruigrok, Williams, Bullmore, Suckling, Baron-Cohen, Craig, Murphy and Ecker2017; Lewis et al., Reference Lewis, Evans and Tohka2018). We have recently shown that WGC captures brain architectural features and putative network-level abnormalities in FEP patients more robustly than measures of cortical thickness (Makowski et al., Reference Makowski, Lewis, Lepage, Malla, Joober, Lepage and Evans2019). Thus, using multiple measures to assess the integrity of the cortical mantle, including a proxy measure of peri-cortical myelin, could provide a better understanding of the neurobiological correlates underlying subdomains of negative symptoms and VM, particularly in FEP patients. This in turn could be paramount in developing more effective treatments in early psychosis, and other disorders that are characterized by similar deficits.
The aims of the current study were to (i) examine the relationship between two negative symptom dimensions (expressivity and amotivation) and deficits in two VM processes (immediate and delayed recall), (ii) relate expressivity and amotivation negative symptom dimensions to changes in CT and WGC across time, and (iii) see how relationships in (ii) interact with VM capacity. We expect expressivity and amotivation to be uniquely correlated with progressive changes in white-gray contrast, and to be moderated by VM abilities. Specifically, we postulate that immediate recall, a measure of verbal learning, will be more strongly correlated with expressivity both at the levels of brain and behavior, given that both constructs have been described as ‘core’ traits in psychosis and less influenced by external factors (Leeson et al., Reference Leeson, Robbins, Franklin, Harrison, Harrison, Ron, Barnes and Joyce2009; Lutgens et al., Reference Lutgens, Lepage, Iyer and Malla2014). On the other hand, we expect delayed recall, a measure of verbal retention, to be more related to amotivation, due to these factors' higher potential to be influenced by the environment.
Methods
Sample
Patients were recruited from the Prevention and Early Intervention Program (PEPP) at the Douglas Institute in Montreal, Canada, and were part of a longitudinal naturalistic outcome study. Details are outlined elsewhere (Iyer et al., Reference Iyer, Jordan, MacDonald, Joober and Malla2015). Inclusion criteria at PEPP include a diagnosis of affective (e.g. bipolar disorder, depression with psychotic features) or non-affective psychosis (e.g. schizophrenia, schizoaffective), an IQ above 70, and limited (<1 month) to no previous exposure to antipsychotic medication. Patients recruited to PEPP (ages 18–35) were invited to take part in a neuroimaging study, comprising three time points (baseline, one/two-year follow-ups) as described in previous work (Makowski et al., Reference Makowski, Bodnar, Malla, Joober and Lepage2016, Reference Makowski, Bodnar, Shenker, Malla, Joober, Chakravarty and Lepage2017). Patients were recruited from February 2003 to February 2014. The first baseline scan took place in May 2004. It should be noted that many of the initial patients recruited for the study did not meet criteria for this neuroimaging investigation, as more than 6 months passed between entry to the PEPP clinic and their baseline scan. The last two-year follow-up scan and clinical assessment for the last patient took place in April 2016.
Non-clinical healthy controls were recruited through advertisements within the same local catchment area. All participants provided written informed consent, and the research protocol was approved by the Douglas Institute human ethics review board. From 150 FEP patients recruited for the study, 88 patients (male, N = 62) were included in analysis. Data from 80 healthy controls were included for the calculation of standardized VM scores, as described below. See online Supplementary Material for more detailed information on the final included sample and demographic/clinical data collection. Also, see online Supplementary Table S1 for a comparison of patients included in the study, compared to those who were excluded.
We opted to include both affective and non-affective psychoses in our sample of FEP patients, as our group has previously shown that clinical diagnoses play a negligible role in findings related to MRI-derived metrics, including cortical thickness (Makowski et al., Reference Makowski, Bodnar, Malla, Joober and Lepage2016, Reference Makowski, Bodnar, Shenker, Malla, Joober, Chakravarty and Lepage2017). Further, our aims are to investigate individual clinical/cognitive profiles, rather than work within a diagnostic framework, which is being recognized as a clear setback in the field of psychiatry (Insel et al., Reference Insel, Cuthbert, Garvey, Heinssen, Pine, Quinn, Sanislow and Wang2010; Owen, Reference Owen2018; Wolfers et al., Reference Wolfers, Doan, Kaufmann, Alnæs, Moberget, Agartz, Buitelaar, Ueland, Melle, Franke, Andreassen, Beckmann, Westlye and Marquand2018). However, we also explored differences in key variables of interest, namely immediate/delayed recall, and amotivation and expressivity deficits, between patients on the schizophrenia spectrum and patients with an affective disorder. No significant differences emerged between groups as can be seen in online Supplementary Table S2.
Negative symptom dimensions and change over time
Negative symptoms were assessed using the Scale for the Assessment of Negative Symptoms (SANS) (Andreasen, Reference Andreasen1984), which has been shown to have good inter-rater reliability (κ = 0.71) at PEPP-Montreal (Jordan et al., Reference Jordan, Veru, Lepage, Joober, Malla and Iyer2018). Item-level scores from the SANS were used to define two principal dimensions of negative symptoms: amotivation and (lack of) expressivity. These dimensions were based on a consistent body of literature reporting a two-factor model of negative symptoms (Malla et al., Reference Malla, Takhar, Norman, Manchanda, Cortese, Haricharan, Verdi and Ahmed2002; Blanchard and Cohen, Reference Blanchard and Cohen2006; Kirkpatrick et al., Reference Kirkpatrick, Fenton, Carpenter and Marder2006; Messinger et al., Reference Messinger, Trémeau, Antonius, Mendelsohn, Prudent, Stanford and Malaspina2011; Jang et al., Reference Jang, Choi, Park, Jaekal, Lee, Cho and Choi2016; Marder and Galderisi, Reference Marder and Galderisi2017). Items were assigned to either the amotivation or expressivity dimension based on a recent confirmatory factor analysis published by our group (Lutgens et al., Reference Lutgens, Iyer, Joober, Schmitz, Lepage, Mustafa and Malla2019). Although other models have been proposed to categorize negative symptoms, for instance, a recent investigation uncovering a five-factor latent structure of negative symptoms in schizophrenia (Strauss et al., Reference Strauss, Nuñez, Ahmed, Barchard, Granholm, Kirkpatrick, Gold and Allen2018), it is important not to dismiss a large breadth of literature that has linked motivation and expressivity dimensions of negative symptoms to functional outcomes in patients. Finally, a two-factor solution minimizes the burden of multiple comparisons and potential false positives for the purposes of our neuroimaging analysis.
Thus, based on Lutgens et al. (Reference Lutgens, Iyer, Joober, Schmitz, Lepage, Mustafa and Malla2019), amotivation in this study represented summed items from ‘Avolition-Apathy’ and ‘Anhedonia-Asociality’ domains, while the expressivity dimension represented summed items from ‘Affective Flattening/Blunting’ and ‘Alogia’ domains, excluding Item 6: ‘Inappropriate Affect’ and Item 10: ‘Poverty of Content of Thought’, given that these items do not effectively map onto the clinical construct of expressivity (Lutgens et al., Reference Lutgens, Iyer, Joober, Schmitz, Lepage, Mustafa and Malla2019). To assess the mean rate of change in symptoms over time, a linear model was fit to each subject's longitudinal amotivation and expressivity symptom data against the participants' age, across all available time points for that participant. A slope was calculated and extracted for each subject to represent a single metric of change over time in symptoms.
Verbal memory performance
VM data were collected from a larger neuropsychological battery database for patients followed at PEPP. Due to a change in neuropsychological testing protocol, VM data were compiled from two different protocols: (1) a pen and paper format administered to patients who took part in the study from 2003 to 2010, using logical memory subtests of the Wechsler Memory Scale-Third Edition (WMS-III) (Wechsler, Reference Wechsler1997); and (2) the CogState Research Battery (Pietrzak et al., Reference Pietrzak, Olver, Norman, Piskulic, Maruff and Snyder2009), administered from September 2010 onwards, using the International Shopping List task. Further details of both testing protocols and tasks have been described before (Benoit et al., Reference Benoit, Malla, Iyer, Joober, Bherer and Lepage2015). Z-Scores were calculated for each neuropsychological test battery separately, using the mean and standard deviation of controls for immediate/delayed recall measures. Previous work from our group (Benoit et al., Reference Benoit, Malla, Iyer, Joober, Bherer and Lepage2015) has shown that participants tested with the CogState Research Battery tended to perform better. Thus, in addition to using standardized scores, the test version was used as a covariate in analyses using VM data. Online Supplementary Table S3 demonstrates there are no significant version or group*version effects on verbal memory performance.
MRI acquisition
Scans were collected at the Montreal Neurological Institute, all on the same 1.5-Tesla Siemens Sonata MRI scanner. Structural T1-weighted volumes were acquired for each participant using a 3D gradient echo pulse sequence with sagittal volume excitation (resolution = 1 mm3, repetition time = 22 ms, echo time = 9.2 ms, flip angle = 30°, 180 1 mm contiguous sagittal slices). The rectangular field of view (FOV) for the images was 256 mm (AP) 204 mm (SI).
MRI post-processing
Cortical thickness
Raw T1-weighted images were submitted to the CIVET pipeline (Version 2.1.0: http://www.bic.mni.mcgill.ca/ServicesSoftware/CIVET) (June et al., Reference June, Singh, Jun, Lerch, Ad-Dab'bagh, MacDonald, Jong, Kim and Evans2005) for extraction of gray and white matter surfaces. Main processing steps include: (1) Registration of T1-weighted images to standardized space (Collins et al., Reference Collins, Neelin, Peters and Evans1994) and correction for non-uniformity artifacts (Sled et al., Reference Sled, Zijdenbos and Evans1998); (2) segmentation of gray, subcortical gray and white matter, and cerebral spinal fluid (Zijdenbos et al., Reference Zijdenbos, Forghani and Evans2002; Tohka et al., Reference Tohka, Zijdenbos and Evans2004); (3) extraction of the white matter surface using a marching-cubes algorithm and extraction of the gray matter surface using the CLASP algorithm (Kim et al., Reference Kim, Singh, Lee, Lerch, Ad-Dab'bagh, MacDonald, Lee, Kim and Evans2005); (4) surface registration to a template for inter-subject correspondence (Lyttelton et al., Reference Lyttelton, Boucher, Robbins and Evans2007); (5) reverse transformation (initially done in step 1) to estimate CT in native space for each subject at 81 924 vertices using the t-laplace metric (Lerch and Evans, Reference Lerch and Evans2005); and (6) smoothing the data in native space with a 20 mm FWHM Gaussian kernel to diminish the impact of noise (Boucher et al., Reference Boucher, Whitesides and Evans2009). CT was estimated using the Laplacian distance between the two surfaces (Jones et al., Reference Jones, Buchbinder and Aharon2000) across 81 924 vertices.
White-gray matter contrast
Measures of WGC were generated as follows, similarly to what is described in Makowski et al. (Reference Makowski, Lewis, Lepage, Malla, Joober, Lepage and Evans2019): (1) additional surfaces were created 1 mm on either side of the surface at the gray-white matter boundary (i.e. +1 mm corresponds to supra-white surface, and −1 mm corresponds to sub-white surface); (2) surface maps of the intensity of the T1-weighted MRI were generated and smoothed; and (3) a ratio was calculated, by dividing the intensity of the −1 mm point by the corresponding +1 mm point, as defined by Lewis et al. (Reference Lewis, Evans and Tohka2018). WGC values ranged from approximately 1.15 to 1.35 where lower values, closer to 1, reflect lower contrast (i.e. reduced gray-white matter distinction) whereas higher values reflect higher contrast (i.e. clearer distinction between gray and white matter). The WGC method is depicted in Fig. 1. More details of imaging methods and quality control procedures are outlined in online Supplementary Material.

Fig. 1. White-gray matter contrast method. Illustration of three key steps in the calculation of WGC, as described in the main manuscript. The method was initially presented in (Lewis et al., Reference Lewis, Evans and Tohka2018) and also applied by our group recently to a cross-sectional FEP cohort (Makowski et al., Reference Makowski, Lewis, Lepage, Malla, Joober, Lepage and Evans2019). The left-hand panel is an example of a T1-weighted image from a participant included in the study, with the gray-white matter boundary and ±1 mm surfaces overlaid, as defined in Step i. Surface maps of the intensity of the T1-weighted MRI were then generated and smoothed with a 20 mm blurring kernel (Step ii). Smoothing is done for both the −1 and +1 mm surfaces before calculation of WGC (Step iii). One example vertex is identified to illustrate the calculation of WGC (Step iii). Note, in some areas the surfaces do not appear to be consistently 1 mm from the gray-white matter boundary; this is because a 2D visualization of the surfaces is depicted here, without taking into consideration the third dimension of the T1-weighted image.
Statistical analyses of behavioral/clinical data
Demographic and clinical variables were analysed with one-way ANOVAs for continuous variables or Kruskal–Wallis H tests for nominal variables. An ANCOVA was used to analyse differences in VM performance at baseline between patients and controls, covarying for test version and years of education. Additional tests to compare the effect of version on results with VM data, as well as exploratory analyses between change in negative symptoms and change in verbal memory scores for a subset of patients with longitudinal data available (N = 49), are in online Supplementary Material. Associations between rates of change in amotivation/expressivity negative symptom domains and immediate/delayed recall in FEP patients were evaluated with Pearson r-correlations, adjusting verbal memory values for age, sex, and test version, and taking into account multiple comparisons with a false discovery rate (FDR) correction (Benjamini and Hochberg, Reference Benjamini and Hochberg1995). Analyses of behavioral and clinical variables were conducted using PASW Statistics 21 (SPSS Inc., 2009, Chicago, IL, USA) and were two-tailed with a critical p value of 0.05. Normality of continuous data was assessed with the Shapiro-Wilk test of normality. Non-parametric tests were used to compare demographic variables between patients and controls that were found not to be normally distributed. Demographic and clinical information was also compared between patients included in this manuscript (N = 88) and patients excluded from the study (N = 47) despite meeting criteria for a FEP, due to the cross-sectional nature of their data and/or failed imaging data after QC.
Surface-based brain analyses
Vertex-wise analysis of WGC and CT were conducted using SurfStat in Matlab (http://www.math.mcgill.ca/keith/surfstat/). As with the negative symptom data and as described in Raznahan et al. (Reference Raznahan, Lerch, Lee, Greenstein, Wallace, Stockman, Clasen, Shaw and Giedd2011), a linear model was fit to each vertex for the WGC and CT data, yielding a single metric for each subject describing the rate of change in years in WGC and CT. To determine which covariates should be used for analyses, the Akaike Information Criterion (Akaike, Reference Akaike1998) was used to determine the best model. AIC values were compared to a ‘baseline’ model that included centered age and sex as covariates, given the well-documented impact of age and sex on neuroanatomy, as well as their influence on the onset and progression of psychosis (Tamnes et al., Reference Tamnes, Østby, Fjell, Westlye, Due-Tønnessen and Walhovd2010; Ochoa et al., Reference Ochoa, Usall, Cobo, Labad and Kulkarni2012; Makowski et al., Reference Makowski, Bodnar, Malla, Joober and Lepage2016, Reference Makowski, Bodnar, Shenker, Malla, Joober, Chakravarty and Lepage2017). Details are included in the online Supplementary Material, including an analysis testing the effect of antipsychotic medication on WGC and CT (online Supplementary Fig. S1) and justification on the exclusion of medication as a covariate.
The following model was used to assess the main effect of change in negative symptoms (η, representing either amotivation or expressivity deficits) on change in Y (representing either WGC or CT), covarying for centered age, sex, and mean σ (reflecting mean WGC or mean CT across the entire cortical surface for each participant):
 $$\eqalign{\Delta Y = &\;{\rm intercept} + \beta _1(\Delta \eta ) + \beta _2\lpar {{\rm Centered}\,{\rm Age}} \rpar \cr & + \beta _3\lpar {{\rm Sex}} \rpar + \beta _4({\rm Mean}(\sigma )) + \varepsilon} $$
Here, β 1 is the slope for the main effect of interest, namely, rate of change (Δ) in negative symptoms per year. Note, β 2 and β 4 reflect measures at baseline. Positive values of the rate of Y change reflect an increase in either WGC and CT per year, whereas positive values in negative symptom reflect an increase (i.e. worsening) in symptoms per year.
The interaction between baseline VM abilities (ν, reflecting immediate recall or delayed recall) and change in negative symptoms over time (η) on rate of change in WGC and CT (ΔY) was tested with the following model:
 $$\eqalign{\Delta Y = &\;{\rm intercept} + \beta _1(\Delta \eta ) + \beta _2(\nu ) \cr & + \beta _3\lpar {{\rm Test}\,{\rm Version}} \rpar + \beta _4\lpar {{\rm Centered}\,{\rm Age}} \rpar \cr & + \beta _5\lpar {{\rm Sex}} \rpar + \beta _6({\rm Mean}(\sigma )) + \beta _7(\Delta \eta {^\ast}\nu ) + \varepsilon} $$
where β 7(Δη*ν) represented the slope for the main predictor of interest; that is, the interaction between change in negative symptoms and baseline verbal memory. Here, β 2, β 3, β 4 and β 6 were measures taken at baseline. For visualization purposes only, patients were divided using a median split into two groups, on the basis of their verbal memory performance: ‘mild to moderate VM deficits’ and ‘high VM deficits’. Specific details of these groups are outlined in the Results section.
Random field theory (RFT) (Worsley et al., Reference Worsley, Taylor, Tomaiuolo and Lerch2004) was used for multiple comparison correction using a stringent p-cluster threshold of p = 0.001. Significant results are also presented with a more liberal cluster threshold of p = 0.01 (p-corrected <0.05), to show the extent of sub-threshold results. For all significant clusters found with the more stringent cluster threshold (p = 0.001), the WGC and CT, or rate of change in WGC and CT, at the peak t-statistic was extracted and adjusted for centered age, sex, and mean (σ), and used to generate scatterplots to visualize results.
Results
The final sample comprised 88 FEP patients, of which 59 patients completed all three scans, and the remainder had two scans. See Table 1 for descriptive statistics and clinical information. Importantly, FEP patients had a median duration of untreated psychosis of ~20 weeks, highlighting the efforts that have been put forth by the PEPP-clinic to minimize patients' pathways to care within our early intervention service (Iyer et al., Reference Iyer, Jordan, MacDonald, Joober and Malla2015; MacDonald et al., Reference MacDonald, Malla, Joober, Shah, Goldberg, Abadi, Doyle and Iyer2018). This also emphasizes that our FEP patients are indeed highly representative of the first-episode time period. Included patients were also compared to 47 patients that were excluded from the current study on variables collected at baseline, and these results can be found in online Supplementary Table S1. In summary, included patients did not differ largely from the excluded patients, except included patients had longer duration of untreated psychosis and untreated illness compared to excluded patients.
Table 1. Demographic and clinical information

CDSS, Calgary Depression Scale for Schizophrenia; CPZ, Chlorpromazine; FEP, First Episode of Psychosis; FUP, Follow-Up; SAPS, Scale for Assessment of Positive Symptoms.
General demographics for whole sample are presented, followed by information corresponding to each scan. All data represented as mean (SD), unless otherwise specified. Square brackets [] include adjusted sample size included in statistical analysis due to missing data points. All antipsychotic totals are presented as cumulative chlorpromazine equivalents in mg (i.e. a composite measure of the total amount of antipsychotic medication prescribed during the entire study), as prescribed by a psychiatrist, and are reported along with a percentage of medication adherence. SAPS totals are presented as mean scores of the sum of item-level scores. Duration of untreated psychosis and illness reflect length of time between onset of psychotic symptoms and onset of other psychiatric symptoms until initiation of antipsychotic medication treatment, respectively. Further details on collection of clinical data can be found in online Supplementary Methods (section ii). Years of education, socioeconomic status, performance and verbal IQ were found to be non-normally distributed; thus, non-parametric tests to compare group means were used.
a Degrees of freedom adjusted, as age did not meet the assumption of equal variance between groups as assessed with Levene's test.
b Covaried by test version. Specifically, IQ was collected with WAIS-III and WASI (more details in online Supplementary Material), and verbal memory was collected with a Pen and Paper neuropsychological test battery, and CogState Research Battery.
c Note, mean and standard deviation of verbal memory in controls does not equate to exactly 0 and 1, respectively, as the norms for verbal memory were calculated before exclusion of a subset of controls for this study due to imaging quality control.
*FEP patients had significantly lower levels of verbal memory performance (immediate/delayed recall), lower performance and verbal IQ, and fewer years of education compared to HC (p < 0.05).
Summary statistics for the rate of change in negative symptoms domains for 88 FEP patients with longitudinal data were as follows: mean ΔAmotivation = −1.80 (s.d. = 4.22, range = −11.72–13.61), mean ΔExpressivity = −1.22 (s.d. = 5.19, range = −19.63–14.66). For amotivation symptoms, five patients had the same level (or absence) of symptoms over time (mean Δ = −0.0038, s.d. = 0.0086), 25 patients had worsening symptoms (mean Δ = 3.12, s.d. = 2.91), and 58 patients improved (mean Δ = −4.08, s.d. = 2.72). For expressivity symptoms, 16 patients had the same level (or absence) of symptoms over time (mean Δ = 0, s.d. = 0), 22 patients had worsening symptoms (mean Δ = 4.64, s.d. = 4.02), and 50 patients improved (mean Δ = −4.18, s.d. = 4.01). See online Supplementary Fig. S2 for the spread of longitudinal amotivation and expressivity negative symptom data.
Relationship between verbal memory and ΔNegative symptoms
Cross-sectional relationships between VM and negative symptoms at baseline are reported in online Supplementary Material, where significant negative associations between baseline expressivity and immediate recall (r = −0.35, q < 0.001) and delayed recall (r = −0.28, q = 0.036) were found; no relationships were found with amotivation. The relationship between VM (i.e. z-scores of immediate and delayed recall) at baseline and ΔNegative symptoms was assessed in 87 patients (degrees of freedom = 82), for which baseline VM and longitudinal negative symptom data were available, using Pearson r correlations, adjusting verbal memory data for age, sex, and test battery. The only significant finding that survived FDR correction for multiple comparisons was a positive relationship between immediate recall at baseline and ΔExpressivity (r = 0.32, q = 0.012). In other words, better VM (i.e. less severe deficits) at baseline was associated with worsening expressivity deficits over time. A trend-like association in the same direction was also found between delayed recall and ΔExpressivity (r = 0.19, p-uncorrected = 0.083). No significant associations were found with either immediate or delayed recall and ΔAmotivation (immediate: r = 0.079, q = 0.476; delayed: r = 0.077, q = 0.486). Finally, we assessed the relationship between change in VM and change in negative symptoms over the first year after a FEP for a subset of patients (N = 49) for which data were available. No significant relationships were found, as reported in online Supplementary Material.
Associations between ΔNegative symptoms and ΔWGC and ΔCT
Worsening of amotivation symptoms was associated with greater increases in WGC over time within the left superior parietal lobule and right dorsal primary motor cortex and paracentral lobule. Overlapping findings were found with respect to ΔExpressivity, with additional peaks in the left dorsal precentral gyrus and right cuneus. With respect to CT, ΔExpressivity was negatively associated with ΔCT (i.e. cortical thinning with worsening symptoms) within left frontal regions. ΔAmotivation was not found to be significantly associated with changes in CT. Results are shown in Fig. 2, along with the brain regions that survived correction for multiple comparisons with a relaxed p-cluster threshold of p = 0.01. Plots were generated for regions that survived correction for multiple comparison with a stringent threshold of p < 0.001.
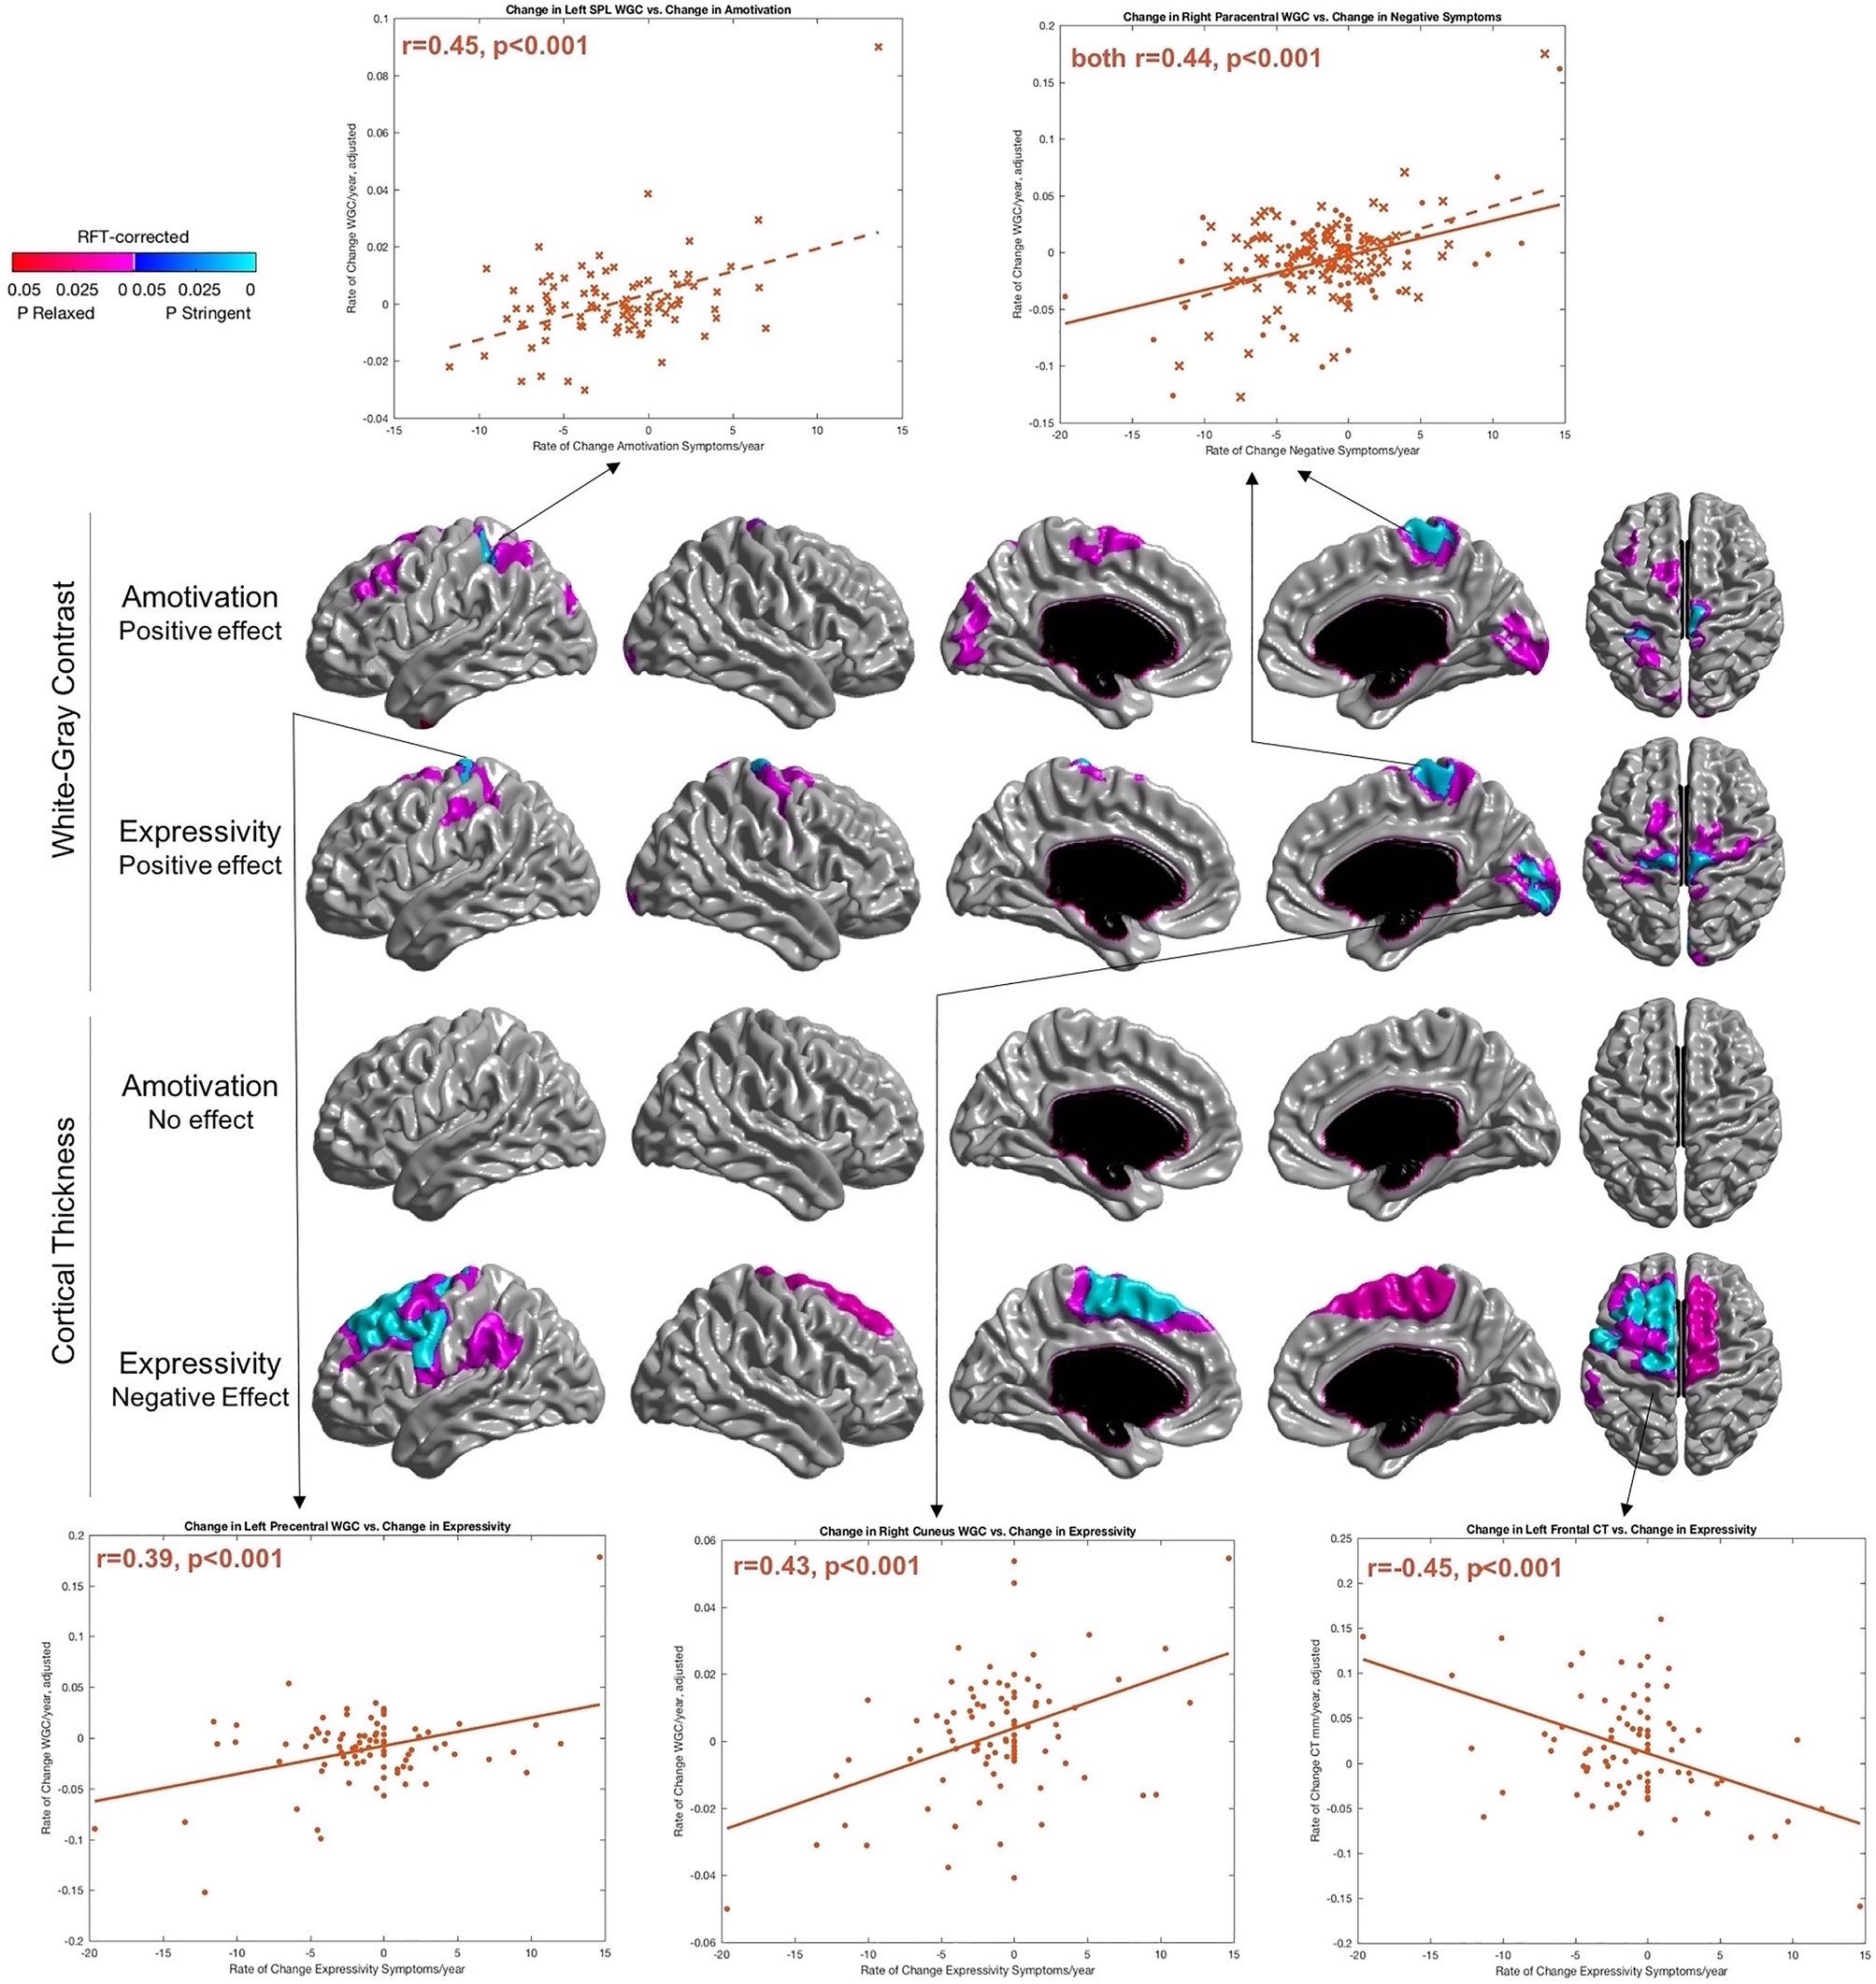
Fig. 2. Change in amotivation and expressivity deficits associated with a change in WGC/CT across time. Results are RFT-corrected, where blue colors represent significant results cluster-thresholded at a ‘stringent’ threshold of p = 0.001, whereas red/pink color represent significant results at a ‘relaxed’ threshold of p = 0.01. Selected regions for scatterplots are those that survived multiple comparisons with the more stringent cluster threshold of p = 0.001. Plots with amotivation are plotted with a dotted line and crosses, whereas expressivity data are plotted with a solid line and circular markers. For overlapping cluster within right paracentral gyrus of the effect of negative symptoms on WGC (top two rows), a common peak was selected where amotivation and expressivity are included on the same plot. SPL, superior parietal lobule. Orientation: Surfaces from left to right in each row: left lateral, right lateral, left medial, right medial, dorsal.
Interaction between verbal memory and ΔExpressivity on ΔWGC and ΔCT
Given that no significant associations were found between verbal memory and ΔAmotivation at the behavioral level, we did not explore this contrast. No significant regions survived the stringent threshold for WGC, however, results with a relaxed threshold are in Fig. 3. For CT, both immediate and delayed recall interacted significantly and uniquely with changes in expressivity. The interaction between immediate recall and ΔExpressivity was significantly associated with changes in thickness along the left hemisphere ventrally, including the left orbital and medial frontal, insular, temporal pole, and middle temporal regions. The interaction term between delayed recall and ΔExpressivity showed significant effects on the right cuneus/primary visual cortex. Results are shown in Fig. 3, along with brain regions that survived correction for multiple comparisons with a relaxed p-cluster threshold of p = 0.01. Plots were generated for regions that survived correction for multiple comparison with a stringent threshold of p < 0.001. Even though no results survived correction for multiple comparisons with WGC with our stringent threshold, we also generated two additional plots with WGC data for right retrosplenial cortex and left central sulcus, to compare the nature of the associations against CT data.

Fig. 3. Interaction between baseline verbal memory and change in Expressivity on WGC and CT. Results are RFT-corrected, where blue colors represent significant results cluster-thresholded at ‘original’ stringent threshold of p = 0.001, whereas red/pink color represent significant results at a ‘relaxed’ threshold of p = 0.01. ‘Immediate’ and ‘Delayed’ labels of left-hand side panel refer to immediate and delayed recall of verbal memory domain, respectively. Inflated brain is presented to better visualize results within cortical folds. Selected regions for scatterplots are those that survived multiple comparisons with the more stringent cluster threshold of p = 0.001 for cortical thickness data. Although nothing survived correction after stringent correction for WGC analyses, peaks within left central sulcus and right retrosplenial cortex were plotted to explore the direction of results with WGC. To better visualize the interaction effect of two continuous variables (rate of change in expressivity and baseline VM), patients were divided based on low/moderate VM deficit (purple) and high VM deficit (yellow). Plots separating patients on the basis of immediate recall are depicted with crosses, and delayed recall with diamonds. Orientation: surfaces from left to right in each row: left lateral, right lateral, left medial, right medial, dorsal (with the exception of the third row, where the last surface is a ventral view).
To better visualize the direction of results, patients were divided into two groups based on their verbal memory performance using a median split, as described in the methods. Specifically, the groups were broken down as follows: ‘mild to moderate VM deficits’ (N = 43; for immediate recall patients had a z-score higher than −1.15; for delayed recall, patients had a z-score higher than −0.91) and ‘high VM deficit’ (N = 44; for immediate recall, patients had a z-score lower than or equal to −1.15; for delayed recall, patients had a z-score lower than or equal to −0.91). Note, one patient had missing verbal memory data at baseline, thus 87 patients were included in this analysis. Visualization of these groups generally revealed that patients with mild to moderate VM deficits (i.e. more preserved VM ability) at baseline drove the positive association between changes in expressivity symptoms and changes in WGC. For CT, patients with mild to moderate VM deficits at baseline predominantly drove the negative association between changes in expressivity and changes in thickness (Fig. 3).
Results were also generated excluding mean (σ) as a covariate; results were largely similar (online Supplementary Fig. S3). To ensure results in the final analysis were specific to verbal memory, a general cognitive index was calculated across five domains (i.e. attention, executive function, speed of processing, working memory, visual memory) and controlled for in analyses, yielding similar results (online Supplementary Fig. S4). Additional methods pertaining to cognitive data can be found in captions of online Supplementary Fig. S4/Table S3.
Discussion/conclusions
These results provide insight into the relationship between surface-based brain metrics and two behavioral domains that contribute strongly to outcome in FEP patients, namely negative symptoms and VM. Two novel findings emerged: (1) rate of change in expressivity and amotivation negative symptoms over the two-year period following a FEP are associated with both overlapping and distinct changes in WGC, and are also associated with changes in left prefrontal regions in relation to CT; and (2) links between baseline VM and change in expressivity deficits are found both at the behavioral and neuroanatomical level, where significant interactions on the rate of change over time in neuroanatomy were uncovered, most pronounced with CT.
We also extend a key finding of cortical thinning of the prefrontal cortex in relation to negative symptoms in psychosis (Galderisi et al., Reference Galderisi, Merlotti and Mucci2015; Walton et al., Reference Walton, Hibar, van Erp, Potkin, Roiz-Santiañez, Crespo-Facorro, Suarez-Pinilla, van Haren, de Zwarte, Kahn, Cahn, Doan, Jørgensen, Gurholt, Agartz, Andreassen, Westlye, Melle, Berg, Morch-Johnsen, Færden, Flyckt, Fatouros-Bergman, Jönsson, Hashimoto, Yamamori, Fukunaga, Jahanshad, De Rossi, Piras, Banaj, Spalletta, Gur, Gur, Wolf, Satterthwaite, Beard, Sommer, Koops, Gruber, Richter, Krämer, Kelly, Donohoe, McDonald, Cannon, Corvin, Gill, Di Giorgio, Bertolino, Lawrie, Nickson, Whalley, Neilson, Calhoun, Thompson, Turner, Ehrlich and Ehrlich2017), a finding that supports long-standing evidence that the frontal lobes are key contributors underlying negative symptom severity (Turetsky et al., Reference Turetsky, Cowell, Gur, Grossman, Shtasel and Gur1995; Wible et al., Reference Wible, Anderson, Shenton, Kricun, Hirayasu, Tanaka, Levitt, O'Donnell, Kikinis, Jolesz and McCarley2001). Importantly, our findings suggest thinning is more specific to changes in expressivity over a one to two year period. However, no associations were uncovered in the prefrontal cortex when examining WGC and negative symptom progression, suggesting these cortical thinning patterns may be due to neuroanatomical changes within more superficial layers. This idea is supported by several studies that cortical thinning of superficial layers is a key biological mechanism underlying altered neuroanatomy of the prefrontal cortex in schizophrenia (Wagstyl et al., Reference Wagstyl, Ronan, Whitaker, Goodyer, Roberts, Crow and Fletcher2016; Lake et al., Reference Lake, Steffler, Rowley, Sehmbi, Minuzzi, Frey and Bock2017). Significant associations still emerged between expressivity deficits and WGC, but within primary sensory and motor regions. Similar patterns were uncovered with amotivation. We have previously shown that WGC of primary sensory and motor regions is related to general psychopathology in FEP patients (Makowski et al., Reference Makowski, Lewis, Lepage, Malla, Joober, Lepage and Evans2019), and maybe related to alterations within the high levels of intracortical myelin that typically characterize these regions (Glasser and Van Essen, Reference Glasser and Van Essen2011). It is possible that the association between contrast changes in primary sensory and motor regions and negative symptom severity is not specific to negative symptoms, but could also be related to general positive symptoms and cognitive deficits more generally. Although there are few studies that have looked at the neural correlates of expressivity and amotivation separately, one of the key regions that have emerged in several investigations is that of the association between avolition and activation of the striatum (Galderisi et al., Reference Galderisi, Merlotti and Mucci2015). Given our conjecture of WGC as a proxy measure of peri-cortical myelin, putatively tapping into integrity of cortico-cortical and cortico-subcortical connections, it is interesting to consider this finding in light of potential aberrancies between cortico-striatal circuitry (Haber, Reference Haber2016).
A key discovery in our behavioral findings was the stronger association between VM specifically with expressivity, as opposed to both negative symptom dimensions. Consistent with previous literature, we uncovered a negative association between VM performance and negative symptoms in psychosis cross-sectionally (Hartmann-Riemer et al., Reference Hartmann-Riemer, Hager, Kirschner, Bischof, Kluge, Seifritz and Kaiser2015). However, when assessing baseline VM performance against the rate of change in symptoms, we identified a relationship that, at first glance, runs counter to intuition. Namely, it was found that patients with better VM at baseline (i.e. a mild level of VM deficits, particularly with immediate recall) had worsening of expressivity symptoms, a relationship that has largely been unexplored longitudinally in psychosis. Our results suggest that having less striking VM deficits at intake does not necessarily protect against progressive changes in expressivity. Other key cognitive factors, such as insight, may also contribute to this relationship. Based on previously identified positive relationships between cognitive insight and VM (Lysaker et al., Reference Lysaker, Carcione, Dimaggio, Johannesen, Nicolo, Procacci and Semerari2005; Lepage et al., Reference Lepage, Buchy, Bodnar, Bertrand, Joober and Malla2008), we can consider that patients with a better ability to recall stored information are also likely to have lower self-certainty and more self-reflectiveness (a profile that characterizes high levels of cognitive insight), which could set the stage for a trajectory of worsening expressivity as the patient internalizes their mental illness. It is also important to note that many of the patients included in this study had an improving course of negative symptoms after the first two years after a FEP, consistent with a previous study (Lutgens et al., Reference Lutgens, Iyer, Joober, Schmitz, Lepage, Mustafa and Malla2019). In this context, several studies have suggested that negative symptoms can improve in the absence of any change in verbal memory performance (Nopoulos et al., Reference Nopoulos, Flashman, Flaum, Arndt and Andreasen1994; Cantor-Graae et al., Reference Cantor-Graae, Warkentin and Nilsson1995; Hoff et al., Reference Hoff, Sakuma, Wieneke, Horon, Kushner and DeLisi1999). In a related vein, we also conducted a supplementary analysis exploring the potential relationship between change in verbal memory and change in negative symptoms over the first year after a FEP, for a subset of patients (N = 49) for which data were available. No significant association was found, consistent with the studies cited above, but it is still possible that more time points would be needed to elucidate such longitudinal relationships. Many studies have suggested that cognition, including verbal memory, is a set of static traits, as suggested by evidence showing the stability of cognitive performance from the clinical high-risk state to transition to psychosis (Green and Harvey, Reference Green and Harvey2014; Carrión et al., Reference Carrión, McLaughlin, Auther, Olsen, Correll and Cornblatt2015). However, future studies are encouraged to further investigate longitudinal cognition-symptom relationships after psychosis onset; a future direction that our group is currently investigating as well.
It is also worth discussing the granularity of results with respect to immediate v. delayed recall in relation to expressivity. It has been shown that immediate recall is highly related to performance on other measures of cognition in schizophrenia (Leeson et al., Reference Leeson, Robbins, Franklin, Harrison, Harrison, Ron, Barnes and Joyce2009). Immediate recall may also have a stronger biological and/or genetic predisposition; deficits in immediate recall predict conversion to psychosis (Lindgren et al., Reference Lindgren, Manninen, Kalska, Mustonen, Laajasalo, Moilanen, Huttunen, Cannon, Therman and Suvisaari2017) and are present in non-affected siblings of schizophrenia twins (Goldberg et al., Reference Goldberg, Torrey, Gold, Ragland, Bigelow and Weinberger1993). Together, this suggests that immediate recall may be a more ‘hard-coded’ feature of psychosis compared to retention of information (i.e. delayed recall), with stronger biological and genetic influences. Further, expressivity has also been recently posited to be a more primary negative symptom domain, and less influenced by environmental factors, such as community resources, compared to amotivation (Lutgens et al., Reference Lutgens, Iyer, Joober, Schmitz, Lepage, Mustafa and Malla2019). Our data present a feasible model whereby expressivity and immediate recall or verbal learning may share common etiology and a potential endophenotype of interest for future studies.
More preserved immediate recall abilities contributed to the relationship between worsening of expressivity deficits and cortical thinning across higher-order language processing areas in ventral frontal areas and middle/inferior temporal gyri of the left hemisphere, which contributes to the semantic encoding of language (Saur et al., Reference Saur, Kreher, Schnell, Kümmerer, Kellmeyer, Vry, Umarova, Musso, Glauche, Abel, Huber, Rijntjes, Hennig and Weiller2008) and for keeping verbal information active in working memory (Smith and Jonides, Reference Smith and Jonides1999). These areas are subserved by white matter tracts such as the uncinate and superior longitudinal fasciculi (Friederici, Reference Friederici2011), which have been shown to be disrupted in schizophrenia patients with predominant negative symptoms (Sigmundsson et al., Reference Sigmundsson, Suckling, Maier, Williams, Bullmore, Greenwood, Fukuda, Ron and Toone2001). With WGC, an interesting relationship also emerged between expressivity deficits and increases in contrast between patients with different levels of immediate recall performance within the retrosplenial cortex bilaterally. Although these results were only significant with a relaxed threshold when correcting for multiple comparisons, the retrosplenial cortex is interesting to consider in this context as it is a region that has been strongly linked to memory function (Vann et al., Reference Vann, Aggleton and Maguire2009), as well as more recently, to the reinforcement of salient behavioral cues (Smith et al., Reference Smith, Barredo and Mizumori2012, Reference Smith, Miller and Vedder2018), which is likely to contribute during immediate learning phases of memory. A previous study has also shown that white matter volume abnormalities exist within the retrosplenial cortex in schizophrenia patients (Mitelman et al., Reference Mitelman, Shihabuddin, Brickman, Hazlett and Buchsbaum2005).
Meanwhile, the interaction between delayed recall and expressivity uncovered regions of the dorsal language processing stream, namely superior parietal lobule, dorsal primary somatomotor and premotor areas, which relates more to language production (Saur et al., Reference Saur, Kreher, Schnell, Kümmerer, Kellmeyer, Vry, Umarova, Musso, Glauche, Abel, Huber, Rijntjes, Hennig and Weiller2008). Disruptions in these cortical regions could plausibly support a mechanistic explanation of the lowered rate of speech production and/or increased psychomotor retardation observed in patients with expressivity deficits (Cohen et al., Reference Cohen, Mitchell and Elvevåg2014; Marder and Galderisi, Reference Marder and Galderisi2017), as well as the necessity for preserved structure/function of the left posterior dorsolateral prefrontal cortex in delayed retrieval (Alexander et al., Reference Alexander, Stuss and Fansabedian2003). Our results also did not change when accounting for a general cognitive index that comprised five cognitive domains. Together, these results suggest that the relationship between expressivity deficits and VM may be more closely linked to speech articulation or language production mechanisms, as opposed to general cognitive abilities.
It is worth noting that WGC and CT are related metrics, but they also tap into different neurobiological properties (Westlye et al., Reference Westlye, Walhovd, Dale, Espeseth, Reinvang, Raz, Agartz, Greve, Fischl and Fjell2009). WGC may take myelination patterns into account more strongly than CT, and may shed light on a compartment of the cortex that may be more amenable to short-term changes (Wenger et al., Reference Wenger, Brozzoli, Lindenberger and Lövdén2017), which in turn may be a more viable biomarker target in FEP patient samples as measured on MRI.
Several limitations should be considered. Our model did not capture patients who had a consistently high or low level of negative symptoms, as well as the distinction between primary and secondary negative symptoms. These individual patterns of negative symptoms have been touched upon by some of our previous work (Makowski et al., Reference Makowski, Bodnar, Malla, Joober and Lepage2016, Reference Makowski, Bodnar, Shenker, Malla, Joober, Chakravarty and Lepage2017), but future investigations are encouraged to parse apart such trajectories in myelin and/or other microstructural compartments. The rates of change in both cortical metrics and negative symptoms should also be interpreted as a proxy measure of negative symptom/cortical change, as subtle non-linear fluctuations over time are not captured by the measures presented in this manuscript. Limitations in accurately and objectively assessing negative symptoms should also be considered, where rater bias may preclude the treatment of amotivation and expressivity as completely independent domains. Automated unbiased assessments of negative symptoms, such as software that has been developed to assess communication deficits and natural language in patients with schizophrenia (Cohen and Elvevåg, Reference Cohen and Elvevåg2014), may provide data with higher construct validity in this respect. It should also be noted that many patients ultimately showed an improvement in negative symptoms; although this improvement has been reported before in the first two years after a FEP (Lutgens et al., Reference Lutgens, Iyer, Joober, Schmitz, Lepage, Mustafa and Malla2019), we cannot rule out that patients with improvement in negative symptoms ultimately comprise a subset of patients that are more motivated to participate in longitudinal studies such as the one described here. With respect to cognitive data, we collected VM from two batteries, although examination of the tests and standardization of our data suggests test version likely did not significantly impact our findings. Our VM data was also limited by the fact that it was largely cross-sectional; as mentioned, future studies would benefit from studying potential temporal changes in such cognitive performance after a FEP. Finally, although our patient sample was largely antipsychotic-naïve at the beginning of the study, many of these patients were prescribed antipsychotic medications. Our exploration of antipsychotic medication on the rate of change in WGC and CT showed no notable effect, however individual medication classes could have differential effects on gray/white matter (Bartzokis et al., Reference Bartzokis, Lu, Stewart, Oluwadara, Lucas, Pantages, Pratt, Sherin, Altshuler, Mintz, Gitlin, Subotnik and Nuechterlein2009; Szeszko et al., Reference Szeszko, Robinson, Ikuta, Peters, Gallego, Kane and Malhotra2014; Abramovic et al., Reference Abramovic, Boks, Vreeker, Bouter, Kruiper, Verkooijen, Van Bergen, Ophoff, Kahn and Van Haren2016).
Although further work is needed to clarify the longitudinal relationships between cognition and negative symptoms, this avenue is promising in understanding domains of psychosis which have largely gone untreated. These findings may also hold implications for other neurological and psychiatric disorders characterized by negative symptom presentation and verbal memory deficits. Given that structural MRI is one of the most commonly used imaging techniques in psychiatric neuroimaging studies, extracting WGC and CT together may be fruitful in the broader search for a valid and easy-to-measure biomarker in psychiatry.
Supplementary material
The supplementary material for this article can be found at https://doi.org/10.1017/S0033291719002071.
Acknowledgements
We would like to thank PEPP-Montreal and Lepage Lab research staff for their efforts in recruitment and clinical data collection. We are also grateful to all patients and families for participating in the study.
Financial support
The study was supported by operating grants from the Canadian Institutes of Health Research (CIHR, 68961, MCT-94189); the Fonds de Recherche du Quebec – Santé (FRSQ); Sackler Foundation; and by grant ANRP-MIRI13-3388 from the Azrieli Neurodevelopmental Research Program in partnership with the Brain Canada Multi-Investigator Research Initiative (to A.C.E.). It also benefited from computational resources provided by Compute Canada (www.computecanada.ca) and Calcul Quebec (www.calculquebec.ca). Salary awards include: Canadian Institutes for Health Research (CIHR; C.M., R.J., M.L., A.C.E.), Fonds de la Recherche en Santé du Québec (FRSQ; C.M., M.L., and R.J.), funding from the Canada First Research Excellence Fund, awarded to McGill University for the Healthy Brains for Healthy Lives Initiative (C.M., A.C.E.), James McGill Professorship (M.L., A.C.E.) and Canada Research Chairs Programme (A.K.M.). The funding organizations had no role in the design and conduct of the study; collection, management, analysis, and interpretation of the data; preparation, review, or approval of the manuscript; and decision to submit the manuscript for publication.
Conflict of interest
A.C.E. has received consulting fees from Biospective. M.L. reports grants from Otsuka Lundbeck Alliance, personal fees from Otsuka Canada, personal fees from Lundbeck Canada, grants and personal fees from Janssen, and personal fees from MedAvante-Prophase, outside the submitted work. R.J. reports receipt of grants, speaker's fees, or honoraria from AstraZeneca, BMS, Janssen, Lundbeck, Otsuka, Pfizer Canada, Shire, and Sunovion and royalties from Henry Stewart Talks. A.M. reports receipt of grants, fees, or honoraria from BMS, Lundbeck, and Otsuka. The authors have no other competing interests to disclose.


