INTRODUCTION
Important mortality outbreaks have been reported in many bivalve species including the flat oyster Ostrea edulis, the mussels Mytilus edulis, Mytilus galloprovincialis, Crassostrea gigas (Grizel et al., Reference Grizel, Comps, Cousserans, Bonami and Vago1974; Villalba et al., Reference Villalba, Mourelle, Carballal and Lopez1993b; Soletchnik et al., Reference Soletchnik, Goulletquer, Geairon and Razet1996; Le Roux et al., Reference Le Roux, Lorenzo, Peyret, Audemard, Figueras, Vivarès, Gouy and Berthe2001; Lopez-Flores et al., Reference López-Flores, de la Herran, Garrido-Ramos, Navas, Ruiz-Rejón and Ruiz-Rejón2004; Novoa et al., Reference Novoa, Posada and Figueras2005). Some authors suggest that mortalities are the result of multiple factors, including elevated temperature, physiological stress, pathogens and pollutants (Goulletquer et al., Reference Goulletquer, Soletchnik, Le Moine, Razet, Geairon and Taillade1998; Samain et al., Reference Samain, Mathieu, Vanderschaeve, Wanke, Neinhuis and Goetghebeur2007).
Ostrea stentina is an endemic oyster species in Tunisia, which is not exploited notably because of its small size. The size of oysters had a mean length of 37.2 mm (range of 32–44 mm) and the total weight varied between 16.51 and 9.57 g. Despite its intense reproductive cycle (Elgharsalli & Aloui, Reference Elgharsalli and Aloui2011) and the lack of fishery pressure, this species appears endangered because of unexplained mortalities occurring in Tunisia since 2007. Very little information is available concerning the health status of O. stentina. It has received no parasitological attention, even though it inhabits waters in which economically significant parasites of O. edulis and M. galloprovincialis including Bonamia ostreae (Pichot et al., 1980), Marteilia refringens (Grizel et al., Reference Grizel, Comps, Cousserans, Bonami and Vago1974) and Marteilia maurini (Comps et al., Reference Comps, Pichot and Pagianni1982) are enzootic (Tiscar et al., Reference Tiscar, Zizzo and Tempesta1991; Virvilis and Angelidis, Reference Virvilis and Angelidis2006; Carrasco et al., Reference Carrasco, Arzul, Chollet, Robert, Joly, Furones and Berthe2008).
A previous study reported the presence of a parasite Bonamia exitiosa in some oysters (Hill et al., Reference Hill, Carnegie, Bejaoui, Elgharsalli, White, Stokes and Burreson2010) with a relatively low prevalence (10.6%). Other histological examinations and molecular analysis of O. stentina performed in 2009 and 2010 revealed the presence of Marteilia refringens DNA in 88% of the oysters (Elgharsalli et al., Reference Elgharsalli, Bejaoui, Salah, Chollet, Joly, Robert, Couraleau and Arzul2013) while B. exitiosa DNA was detected in only 3% of the oysters (unpublished results) suggesting a possible involvement of M. refringens in the mortality of O. stentina. Infection by protozoan parasites causes severe alterations and could affect the reproductive cycle through energy depletion, particularly during the spawning period (Jeffs & Hickman, Reference Jeffs and Hickman2000). Indeed, infections cause a poor condition index with glycogen loss (emaciation), discolouration of the digestive gland, cessation of growth, tissue necrosis and mortalities. Severe infection may cause loss of condition as a consequence of reduced energy acquisition and the parasite may interfere with host feeding and absorption simply by its physical pressure (OIE, 2011). To our knowledge, no published work is available on the biochemical study of the oyster O. stentina. The absence of a healthy population does not allow a comparative study between infected and uninfected oysters and monitoring of biochemical changes. Despite this, it is necessary to determine the effect of the parasite on the physiological state of infected oysters.
A study of the biochemical compositional changes of O. stentina is considered to be necessary so as to document the physiological status of the oyster in Tunisia depending on the presence of the parasite. (1) The biochemical compositional changes of O. stentina were investigated seasonally over a 1-year period, taking into account the effect of the reproductive cycle (sexual maturation) together with the detection of M. refringens through PCR. (2) Energy resources were estimated with respect to changes of lipids and carbohydrates. (3) The use of energy resources were measured by the activity of metabolic pathways, such as pyruvate kinase (PK), citrate synthase (CS) and cytochrome c oxidase (CCO). The result of this work will provide the basic parameters for a dynamic energy model to assess parasitic infection, which can also affect other bivalves, based on shellfish farming.
MATERIALS AND METHODS
Study area
The Stah Jeber port is a semi-enclosed artificial basin, located in the south-eastern Mediterranean Sea, in the Monastir Bay on the east coast of Tunisia (35°45′29″N 10°50′13″E, Figure 1). The mean depth is 3.5 m with a maximum of 5 m and a surface area of about 227.800 m2. A study of physicochemical parameters was carried out. The temperature (°C), dissolved oxygen (mg l−1), pH and salinity in the study area were recorded monthly using a multi-parametric probe (multiline P4 WTW). Oysters, attached to the rocks in the Stah Jeber harbour, were seasonally and randomly collected over the dock at which boats are moored. The mortality rate of O. stentina was a measure of the number of dead oysters in an O. stentina population, scaled to 100 individuals of that population, per sampling date.

Fig. 1. Study site, Monastir port: Monastir Bay, the east coast of Tunisia.
Sample processing
In 2009, specimens of O. stentina were seasonally and randomly collected on 11 February (30 oysters), 26 March (30 oysters), 9 June (30 oysters) and 13 October (13 oysters), designated hereafter as winter, spring, summer and autumn, in the Stah Jeber port from shallow areas at a depth of between 1.5 and 5 m. In the laboratory, oysters were cleaned and all fouling organisms were removed. Each individual oyster was measured including the total length (to the nearest 0.005 mm) using a vernier caliper and the total weight (nearest 0.001 g), wet meat weight (nearest 0.001 g) and dry shell weight (nearest 0.001 g) were determined. After the measurement of biometric parameters the whole oyster tissue was dissected and immediately frozen in liquid nitrogen. Frozen tissues at −20°C from each individual, were suspended with buffer (PBS buffer + Tween 0.1% + EDTA 1 mM) and ground with a polytron homogenizer with a final concentration of 200 mg ml−1 of the homogenate. For analysis, 200 mg of the wet homogenate was suspended with 1 ml of buffer PBS and divided into seven aliquots (200 µl for carbohydrate and CCO analysis, 400 µl for PK, CS and total lipids analysis and 50 µl for DNA analysis).
Biochemical composition
LIPID AND CARBOHYDRATE CONTENT
Lipids were extracted with chloroform: methanol. After centrifugation (3246 g), the precipitate was extracted and the supernatants were washed with chloroform: methanol: water as described by Bligh & Dyer (Reference Bligh and Dyer1959). Total lipids (percentage of total lipids per milligram of oyster dry weight) were determined gravimetrically by evaporation of the solvent in the purified extract on aluminium sheets at 60–80°C. Carbohydrates and protein contents were measured according to the method of Dubois et al. (Reference Dubois, Gilles, Hamilton, Rebers and Smith1956) and Lowry et al. (Reference Lowry, Rosenbrough, Farr and Randall1951), respectively. The results were calibrated against standard curves of glucose. Results were expressed as percentage of carbohydrate per milligram of oyster dry weight.
ENZYMATIC ACTIVITY
The homogenates were centrifuged for 10 min at 1,50,000 g at 4°C, the supernatant was used for enzymatic assays, citrate synthase (CS) and pyruvate kinase (PK). The results of enzymatic activities are expressed in mU mg−1 proteins. Protein concentration in the extracts were determined using the Lowry et al. (Reference Lowry, Rosenbrough, Farr and Randall1951) method. The preparation for citrate synthase was as follows: 100-mM Tris HCL (pH 8), acetyl CoA 0.2 mM, DNTB 0.1 mM and oxaloacetate 500 µM. The reaction was initiated by mixing the supernatant 20 µl with the medium preparation 160 µl in a microplate. Changes in absorbance at 412 nm were monitored using a microplate reader (Bio-Tek Synergy HT, Bio Tek Instruments, USA).
The activity of PK in oyster tissues was determined as described by Greenway & Storey (Reference Greenway and Storey1999). Frozen tissues were prepared at a 1:5 w/v ratio in a buffer composed of 50 mM imidazole-HCL buffer (pH 7.2), 100 mM NaF, 5 mM EDTA, 5 mM EGTA and 15 mM 2-mercaptoethanol. The homogenates were centrifuged for 10 min at 15,000 g at 5°C. The preparation for pyruvate kinase was as follows: 100 mM imidazole –HCL buffer (pH 7.2), 50 mM KCL, 5 mM MgCl2, 10 mM phosphoenolpyruvate, 2 mM ADP, 0.15 mM NADH, 0.2% 2(v/v) retenone-saturated ethanol and 1.2 U ml−1 LDH. The assays were made in duplicate at room temperature and initiated by mixing the enzyme buffer with the 20 µl extract in 250 µl total microplate well volume. Changes in NADH absorbance at 340 nm were monitored using a microplate reader (Bio-Tek Synergy HT, Bio Tek Instrument, USA).
For the CCO activity the homogenates were centrifuged for 1000 g, the supernatant was re-centrifuged for 10 min at 9000 g, the pellets were removed and re-dissolved in the phosphate buffer pH 7.8 containing Tween 0.1% and EDTA 1 mM. The assays were made in duplicate at room temperature by mixing 66 mM reduced cytochrome c in phosphate buffer pH7.8, the reaction was initiated by adding 20 µl of mitochondrial extract. The absorbance was measured by using a microplate reader (Bio-Tek Synergy HT, Bio Tek Instruments, USA) at 550 nm during a period of 10 min.
DNA extraction and PCR-RFLP
DNA was extracted from the individuals of O. stentina collected from the Monastir Bay, by the method of phenol/chloroform extraction and precipitation by ethanol. Negative PCR controls consisting of water were included every 10 tested samples in order to check for any potential contamination. Positive PCR controls consisted of DNA extracted from M. refringens and Bonamia sp. purified cells provided by positive controls. Bonamia sp. was detected by PCR using Bo Boas's primers according to Cochennec et al. (Reference Cochennec, Le Roux, Berthe and Gérard2000). The parasite species was subsequently determined by restriction fragment length polymorphism (RFLP) analysis (Hine et al., Reference Hine, Cochennec-Laureau and Berthe2001; Cochennec-Laureau et al., Reference Cochennec-Laureau, Reece, Berthe and Hine2003) carried out by separate digestions of 10 µl of PCR products with BglI and HaeII (Promega). The resulting fragment patterns were analysed electrophoretically on 2% agarose gel. Marteilia refringens was detected by PCR according to Le Roux et al. (Reference Le Roux, Lorenzo, Peyret, Audemard, Figueras, Vivarès, Gouy and Berthe2001). The parasite type was then determined using the PCR-RFLP approach developed by Le Roux et al. (Reference Le Roux, Lorenzo, Peyret, Audemard, Figueras, Vivarès, Gouy and Berthe2001). Analyses were carried out using the digestion method throughout the night at 37°C using 10 µl of PR4-PR5 PCR products with 0.25 units of HhaI (Promega). The resulting fragment patterns were analysed electrophoretically on 2% agarose gel.
Statistical analyses
Seasonal variation of the metabolic enzymes activity and energetic reserves, depending on the season were analysed by one-way ANOVA and Duncan's multiple range test to assess the significant differences (P < 0.05) between seasons (four levels). Differences were considered significant with a probability (P) value of 0.05 or less. All data are reported as mean ± standard deviation, except where indicated. Fisher's test was used as post-tests to compare the variation of biochemical analyses studied on the sampling dates. The metabolic enzymes activity, energetic reserves, biotic and abiotic parameters according to season were visualized and characterized by a Factorial Correspondence Analysis (FCA), which was conducted in order to establish the temporal clustering of the samples analysed. Pearson correlation coefficient (r) was applied to identify any significant correlation between parameters analysed. All statistical analyses were carried out using XLSTAT Software (version 2015.4.01 Addinsoft™ SARL).
RESULTS
Physicochemical parameters
Seasonal values of the physicochemical parameters (temperature, salinity, dissolved oxygen and pH) measured over the study period are shown in Figure 2. The water temperature showed a typical seasonal variation, increasing from February (18.40°C) to June (30.02°C) and decreasing from June to October (17.10°C). The lowest value of dissolved oxygen was 3.05 mg l−1 observed in June and the highest values were measured in February 2009 (4.9 mg l−1) and October (5.02 mg l−1). The salinity was stable ranging from 36.20‰ in February 2009 to 37.80‰ in June 2009. The pH values were stable in February and March (respectively 8.10 and 8.06). The pH decreased between the March-June period, and during the June–October period, respectively from 7.80 to 7.13.
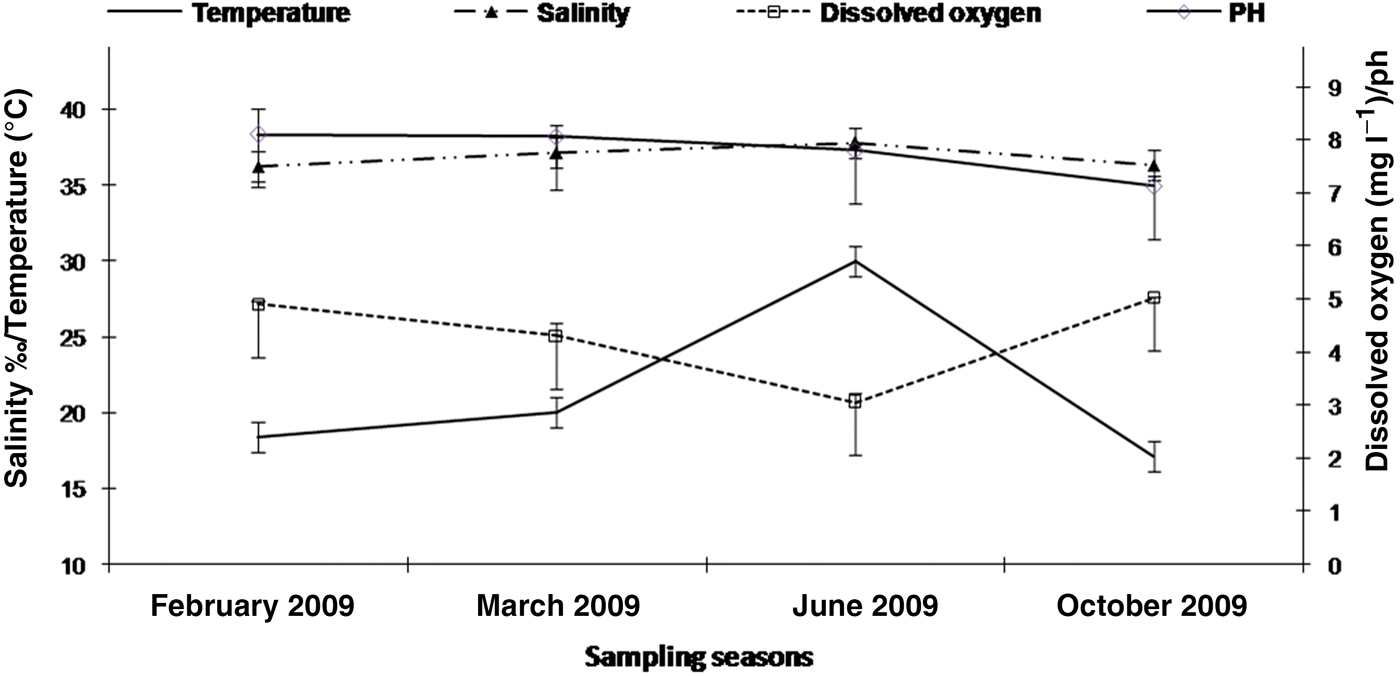
Fig. 2. Seasonal variation of physicochemical parameters (Salinity in ‰; Temperature in °C, Dissolved oxygen in mg l−1 and pH) from February 2009 to September 2009 in Monastir Bay, Tunisia (number of samples for each parameter = 3).
Biometric data
Individual oysters were collected randomly and their morphological characteristics were studied. The averages of these parameters are given in Table 1. Depending on the population density, availability of oysters to the collector and the sampling date, the length parameter of oysters varied between 32.41 ± 0.12 mm and 44.13 ± 1.20 mm and the total weight between 16.51 ± 1.28 g and 9.57 ± 0.10 g. Maximum values were observed in March and minimum values in October except the flesh weight.
Table 1. Mean seasonal variation of length, total weight, shell weight and tissue weight of Ostrea stentina from February 2009 to October 2009 in the Monastir Bay, Tunisia.

PCR detection of Bonamia exitiosa and M. refringens
Following the detection of M. refringens by PCR analysis, we characterized the parasite using a histology examination in order to complete and to confirm our results. Marteilia refringens DNA was detected in 85 of the 103 tested oysters (80.95%) (Table 2). Detection frequency was lower in October (5 + /13 Ind.) and higher in February (30+/30 Ind.) and March (28+/30 Ind.) (Figure 5). All the PCR positive samples showed type O restriction profile after digestion of PCR products with HhaI. Bonamia exitiosa DNA was detected in three of the 103 tested oysters (2.91%) (Table 2). The PCR Bo-Boas positive samples showed B. exitiosa profile after digestion of PCR products with BglI and HaeII. During the study period, the mortality rate ranged between 42 and 87% with the highest level recorded in autumn. The mortality rate increased from June (42%) to October (87%), and decreased to 73% in February (Figure 5).
Table 2. Identification of parasites from DNA extracts of samples of Ostrea stentina collected at different sampling dates in Monastir Bay, Tunisia. Detection of Marteilia refringens and Bonamia sp. by PCR using PR4-PR5, Bo-Boas primer pairs respectively, determination of the parasite species or type by RFLP after digestion by BgI and HaeII.

Biochemical composition
The total lipid content did not show significant variations between the seasons (one-way ANOVA, F = 1.51, P > 0.05) and it varied little between seasons (Figure 3). Total lipids showed maximum values in the summer (13% lipids in dry weight) and lower values in the winter (10.65% lipids in dry weight). Carbohydrate content did not change significantly with the seasons (one-way ANOVA, F = 1.52, P > 0.05). Nevertheless, we observed a trend towards an increase of carbohydrate levels during the March–June period. A decrease in carbohydrates content was observed from 17.05% in dry weight in summer (9 June) to 11.60% in autumn (Figure 3).

Fig. 3. Seasonal variation of lipids (% Lipids mg−1 dry weight) and carbohydrates content (% Carb. mg−1 dry weight) from February 2009 to September 2009 in Monastir Bay, Tunisia. Histograms present mean values. Number of individuals: February, N = 30; March, N = 30; June, N = 30; October, N = 13.
Enzymatic activity
The value for CS was significantly different over time (Table 3) (one-way ANOVA, F = 31.22, P < 0.0001). There was a decrease in the activity of CS from February (23.67 mU mg−1 prot) to October (3.36 mU mg−1 prot) (Figure 4). CCO activities continuously decreased significantly (one-way ANOVA, F = 26.08, P < 0.0001). The level of COO enzyme showed a seasonal variation with a maximum value recorded in winter, 11 February (8.26 mU mg−1 prot) and the lowest value was measured in autumn, 13 October (1.20 mU mg−1 prot) (Figure 4). The PK enzyme activity increased significantly (one-way ANOVA, F = 10.96, P < 0.0001) from February to June and decreased from June to October (Figure 4). The mean level of PK enzyme activity was higher in oysters during the summer period (9 June) with 31 mU mg−1 prot and lower in oysters during the autumn period (13 October) with 14.53 mU mg−1 prot.
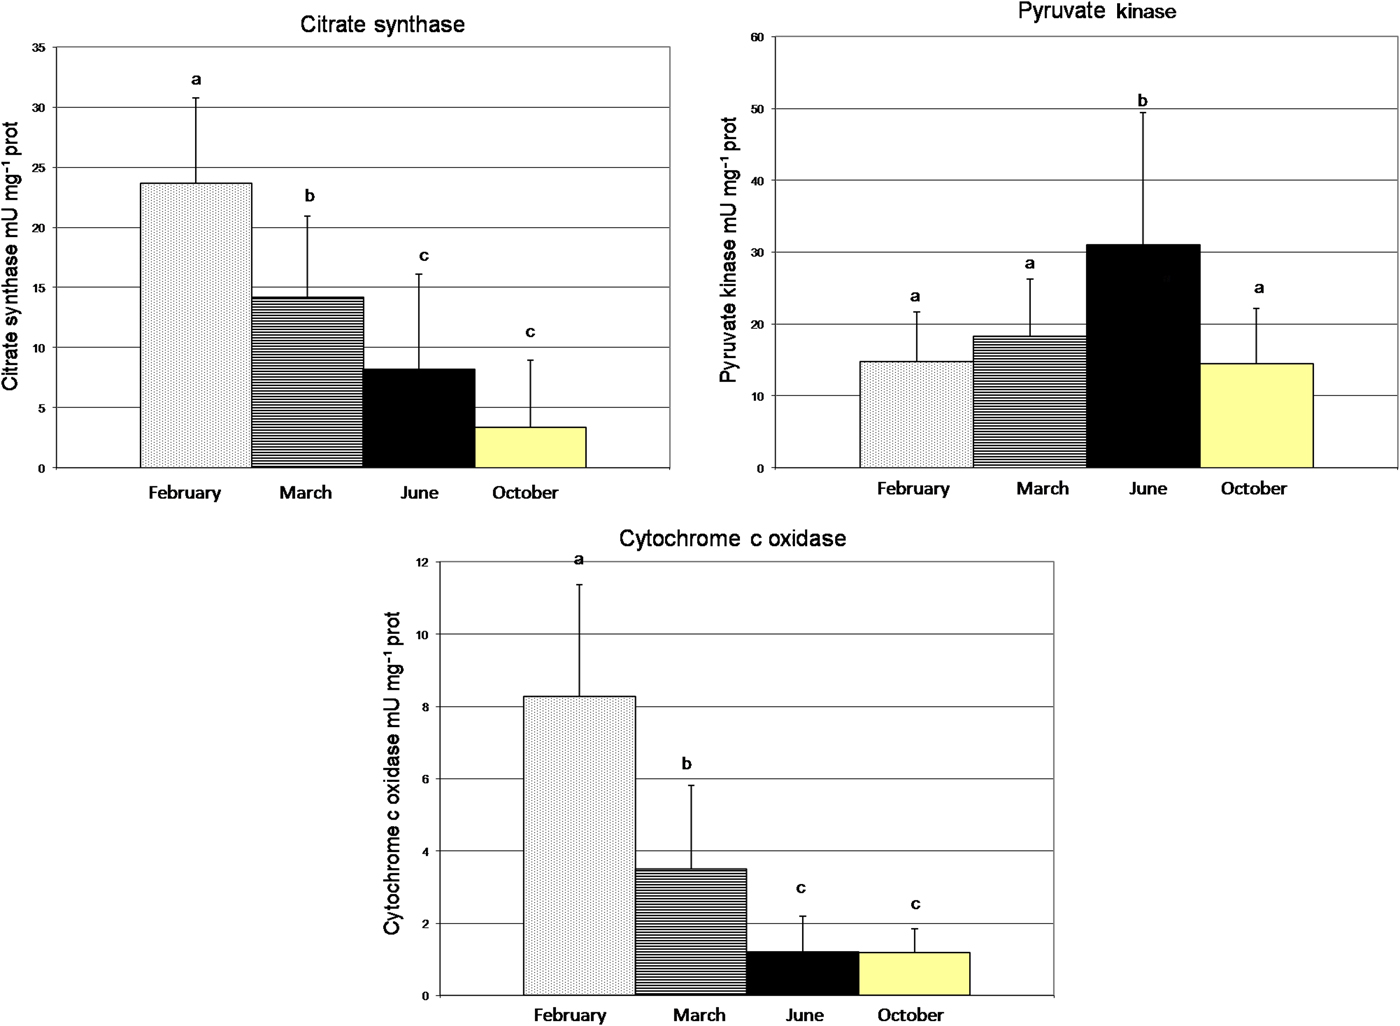
Fig. 4. Seasonal variation of enzyme activity: PK, CS and CCO and temperature, from February 2009 to September 2009, in Monastir Bay, Tunisia. Number of individuals: February, N = 30; March, N = 30; June, N = 30; October, N = 13. Same letters are not significantly different.
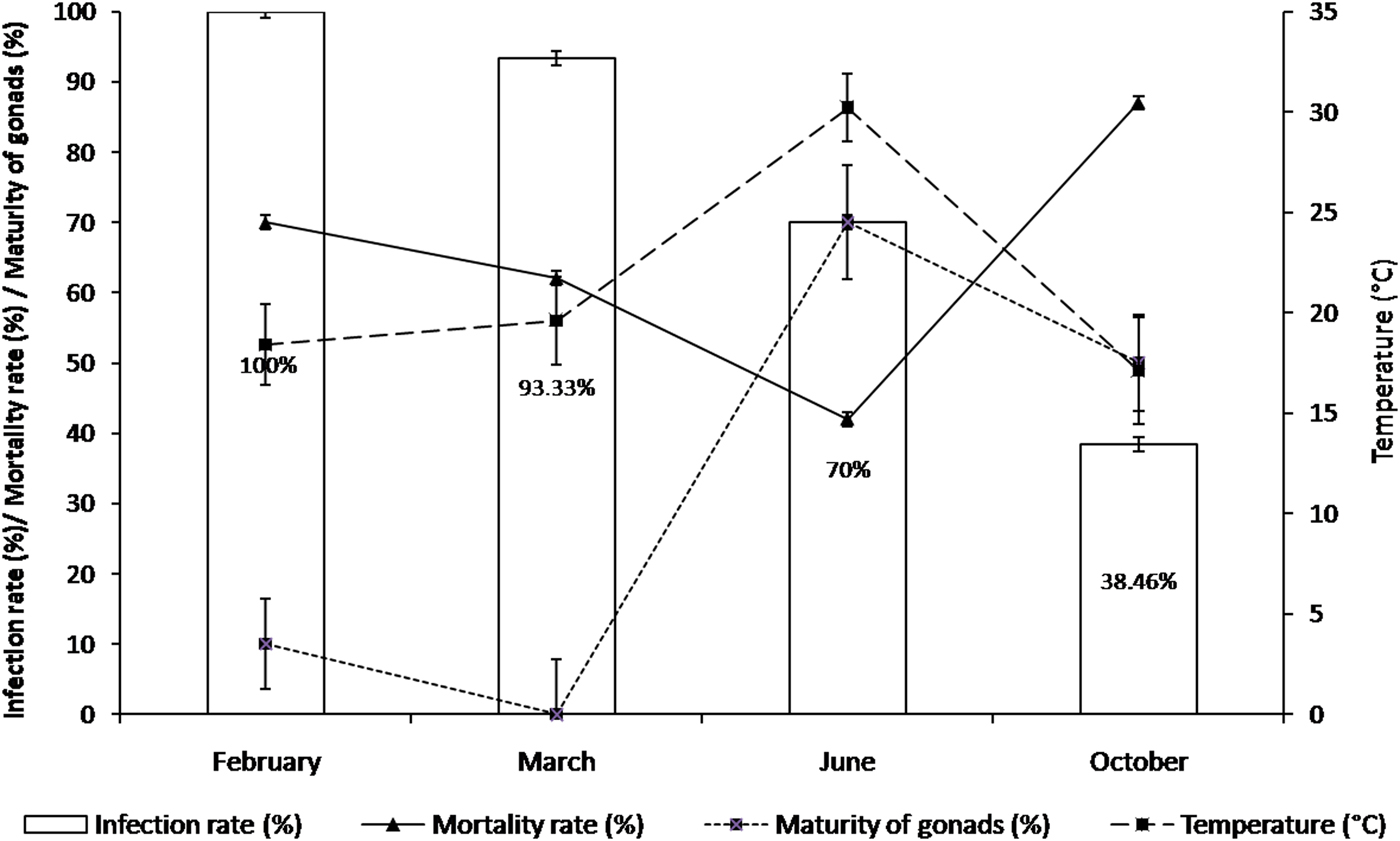
Fig. 5. Mortality rate (%) among oysters infected with Marteilia refringens (Marteilia infection %) during study period, with reference to water temperature (°C) and maturity of gonads (%).
Table 3. Results of one-way ANOVA and Student's t-test for biological data content according to the sampling date. Significance levels: ***(P < 0.0001); ns, non significant; P, probability; F, Fisher test.

Evaluation of the impact of M. refringens on O. stentina
The temporal variation of the metabolic enzyme activity and energy state of oysters is displayed in a FCA plot based on seasonal variation of several factors (biotic and abiotic parameters) acting simultaneously on the species O. stentina, in a two-dimensional graphical space (Figure 6). It reveals that the first axis contributes a value near 66%. The maturity of gonads and PK activity contribute significantly to the formation of the first factor, with respective values of 81.40% and 31%. Axis 1 (65.77%) separates Marteilia infection, maturity of gonads and PK activity from the other parameters. The CS activity and Marteilia infection have significantly higher contributions to the formation of the second factor, with respectively 59.80 and 57.70%. FCA analysis allowed separating maturity of gonads, mortality rate, CS and CCO activity and dissolved oxygen O2 from Marteilia infection, energy reserves (lipids and carbohydrate content), growth rate and temperature seawater. The FCA showed that energy states (lipid and carbohydrate content) and PK activity were related to temperature since they correspond to highest registered values in summer. A high correlation of Pearson coefficient with proportional reaction was noted respectively (r = 0.92, r = 0.60 and r = 0.99). However, a high correlation of Pearson coefficient with inverse reaction was noted between energy reserves (lipids content, r = −0.89; carbohydrate content, r = −0.72) and maturity of gonads when the rise of energy reserves was followed by maturity of gonads during June–October period according to the reproductive cycle of O. stentina. The FCA showed that the growth rate of oysters was positively related to Marteilia infection since the parasite Marteilia refringens infected mature oysters. The Pearson correlation coefficient (between M. refringens infection and growth rate (length, total weight)) was r > 0.9. The FCA analysis demonstrated that contrary to maturity of gonads (Pearson coefficient r = 0.90), the energy reserves (Pearson coefficient r > −0.74) and PK activity (Pearson coefficient r = −0.96; P < 0.001) were negatively related with mortality rate.
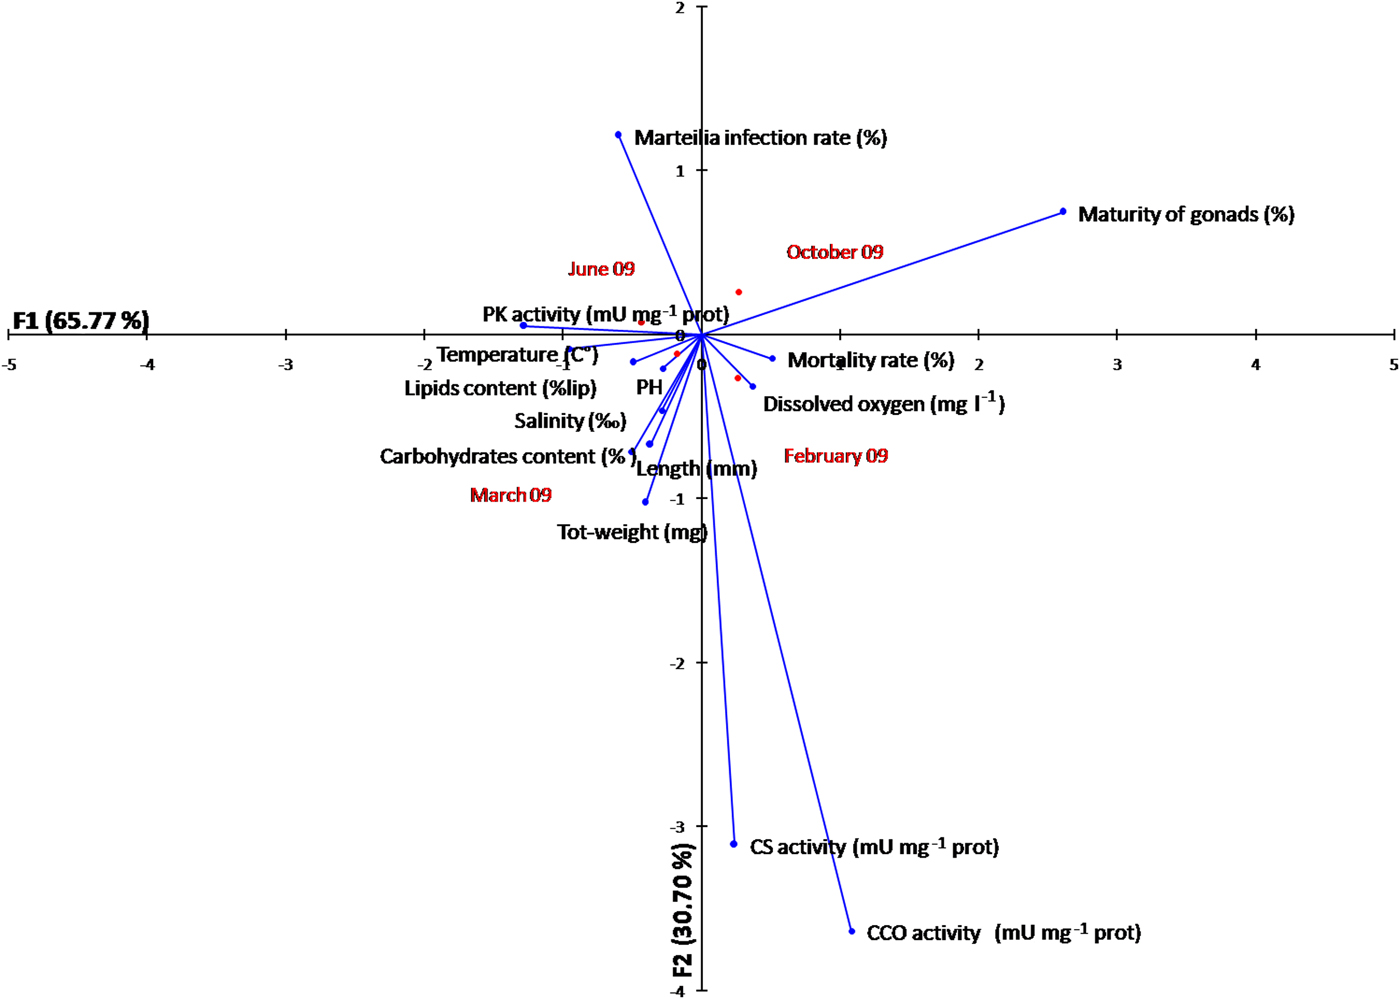
Fig. 6. Plot of the two first components (axes 1 and 2) of a factorial analysis (FCA) conducted based on the temporal metabolic enzymes activity, energy reserves, biotic and abiotic parameters according to season of the oyster Ostrea stentina infected with parasite Marteilia refringens from Monastir Bay, Tunisia.
DISCUSSION
Gonad maturity
The oyster O. stentina showed a successive hermaphroditism with a consecutive rhythmic sexuality on the basis of histological observation (Elgharsalli & Aloui Bejaoui, Reference Elgharsalli and Aloui2011). Reproduction occurs continuously throughout the year with two reproductive cycles for each sex. No resting period was observed. The sexual cycle clearly influences the morphological parameters of the oyster. The Pearson correlation coefficient (between maturity gonads and growth rate) was r > −0.71 thus indicating negative relationships between the maturity gonads and growth rate. Wada et al. (Reference Wada, Iida, Akimoto, Kanai, Toyama and Fujita1995) suggested that factors that affect the gametogenic cycle in bivalves might be the variation in the environment such as food availability, and particularly temperature, which may be the most important element. In the study area, the temperature fluctuated from 17.10°C in October to 30.20°C in June. In general, average temperatures above 17°C are common along the Tunisian coasts (Tlig-Zouari, Reference Tlig-Zouari1993; Aloui-Bejaoui, Reference Aloui-Bejaoui1998; Ben Kheder, Reference Ben Kheder2001).
Biochemical analyses were carried out to evaluate the management of the energy resources in regard to the biochemical changes of lipids and carbohydrates. Lipid proportions in oyster tissues of O. stentina varied within the range 10.65−13% in our study. Measuring the carbohydrate content revealed that it remained stable during the period studied and varied from February (16.60%) to October (11.60%). The metabolic pathways, such as pyruvate kinase (PK), will show the use of the energy resources. The correlation test between PK and lipids content showed a high Pearson coefficient with proportional reaction (r = 0.95, P < 0.001). The PK activity in O. stentina depended on the season. The major peak of PK activity was noted in summer with 33.60 mU mg−1 prot. The level of CCO activity for O. stentina ranged from 8.26 mU mg−1 prot in February to 1.20 mU mg−1 prot in October. The CS activity of O. stentina varied from February (23.67 mU mg−1 prot) to October (3.36 mU mg−1 prot) and remained low compared with the value reported for other oysters.
Biochemical composition
THE TOTAL LIPID CONTENT
Several patterns of temporal variability of lipids in bivalve molluscs, reported in previous studies (Pazos et al., Reference Pazos, Ruiz, Garcia, Abad and Sanchez1996; Li et al., Reference Li, Osada and Mori2000; Dridi et al., Reference Dridi, Romdhane and Elcafsi2007) are the result of several environmental factors acting simultaneously, such as temperature, food availability, plankton composition and physiological factors. The lipid contents of O. stentina remain similar compared with values reported for most other temperate bivalves (Pazos et al., Reference Pazos, Ruiz, Garcia, Abad and Sanchez1996; Almeida et al., Reference Almeida, Machado and Coimbra1997; Kang et al., Reference Kang, Park, Lee, Choi and Lee2000). Lipid proportions in oyster tissues of O. stentina varied between 10.65 and 13% in our study. Values for lipid contents of M. edulis by Zandee et al. (Reference Zandee, Kluytmans, Zurburg and Pieters1980) were 10–11%; Wenne & Polak (Reference Wenne and Polak1989) reported 18% for Macoma baltica. Values for lipid contents of C. gigas by Deslous Paoli & Héral (Reference Deslous-Paoli and Héral1988) were 6–12%, Costil et al. (Reference Costil, Royer, Roport, Soletchnik and Mathieu2005) reported 8–10% and Delaporte et al. (Reference Delaporte, Soudant, Lambert, Moal, Pouvreau and Samain2006) reported 10%. There were peaks in lipid content in summer (June) which increased during gametogenesis and fell during spawning (July–December period). The total lipid reserves decrease in winter suggesting that they may have been mobilized to provide energy as the carbohydrate reserves become depleted (Bayne, Reference Bayne and Bayne1976; Barber & Blake, Reference Barber, Blake and Shumway1991).
CARBOHYDRATES CONTENT
Carbohydrates are recognized as the major energy source in bivalves and the seasonal changes in glycogen levels correlated with seawater temperature, condition and tissue dry weight. Measuring the carbohydrate content revealed that it remained stable during the period studied and varied within the range 16.60–11.60%, from February to October. The carbohydrate content is low compared with the content of C. gigas in natural and controlled conditions (Berthelin et al., Reference Berthelin, Kellner and Mathieu2000; Delaporte et al., Reference Delaporte, Soudant, Lambert, Moal, Pouvreau and Samain2006) such as the carbohydrate content of C. gigas in natural conditions expressed in dry weight of 15–20% (Le Moullac et al., Reference Le Moullac, Bacca, Huvet, Moal, Pouvreau and Van Wormhoudt2007). Accumulation of glycogen reserves in the spring–summer period followed by a fall synchronously with the rise of lipids, which reflects the maturity of the oysters, has been demonstrated by several authors (Maurer & Borel, Reference Maurer and Borel1986; Berthelin et al., Reference Berthelin, Kellner and Mathieu2000). In fact, a high correlation of Pearson coefficient with inverse reaction was noted between energy reserves (lipids content, r = −0.89; carbohydrate content, r = −0.72) and maturity of gonads when the rise of energy reserves was followed by maturity of gonads during June – October period. In general, when the gonad tubules are reduced, the mantle tissue contains numerous storage cells and there is maximal glycogen metabolism and storage capacity (Berthelin et al., Reference Berthelin, Kellner and Mathieu2000). Previously Gabbott & Walker (Reference Gabbott and Walker1971) have shown that glycogen may decrease during the spawning season when pre-stored glycogen is converted into lipid during vitellogenesis. In addition, the decrease of carbohydrate in the oyster tissues may correspond to the metabolization of glycogen during the vitellogenesis process (Berthelin et al., Reference Berthelin, Kellner and Mathieu2000) and muscle needs (Dunphy et al., Reference Dunphy, Wells and Jeffs2006).
Other periods of limited glycogen content have often been associated with mortality events (Mori, Reference Mori1979; Perdue et al., Reference Perdue, Beattie and Chew1981). Mori (Reference Mori1979) considered that low carbohydrate content and high gonad development are combined factors increasing the mortality risk. As reported by Soletchnik et al. (Reference Soletchnik, Faury and Goulletquer2006), mortality was associated with a high reproductive activity (coefficient of Pearson, r = 0.90) when glycogen reserves (coefficient of Pearson, r = −0.74) decreased and reached a low point just before the mortality events. The Pearson correlation coefficient indicate a high correlation inversely proportional between mortality rate and carbohydrate content (Pearson coefficient r = −0.74), lipids content (Pearson coefficient r = −0.94), PK activity (Pearson coefficient r = −0.96, P < 0.001), and temperature (Pearson coefficient r = −0.96, P < 0.001). In fact, mortality increased from 42 to 87%, from June to October, when carbohydrate content declined.
Enzymatic activity
The use of the energy resources can be measured by activity of the metabolic pathways, such as the pyruvate kinase (PK). As in some other invertebrates, such as the oyster Crassostrea virginica (Greenway & Storey, Reference Greenway and Storey2000), the periwinkle littorina littorea (Greenway & Storey, Reference Greenway and Storey2001) and the horse mussel Modiolus modiolus (Greenway & Storey, Reference Greenway and Storey2001), the PK activity in O. stentina depended on the season. The temperature factor may have a seasonal effect on the PK activity by changing the kinetic properties (Le Moullac et al., Reference Le Moullac, Bacca, Huvet, Moal, Pouvreau and Van Wormhoudt2007). In our study, changes in the water temperature were recorded with a maximum of 30.02°C in June 2009 and a minimum of 17.10°C in October 2009. The major peak of PK activity was noted in summer with 33.60 mU mgr−1 prot. As for the PK activity, the PK and temperature correlated significantly with a high Pearson coefficient reaction (r = 0.99, P < 0.001). The CS activity of O. stentina remained low compared with the value reported for Crassostrea gigas: 50 mU mg−1 prot (Gabbott & Walker, Reference Gabbott and Walker1971) and 30 mU mg−1 prot (Dunphy et al., Reference Dunphy, Wells and Jeffs2006). Accordingly, the reduction of CS activity observed in starved C. gigas (Sukhotin et al., Reference Sukhotin, Abele and Pörtner2006) and in starved mussels, Mytilus californianus (Dahlhoff et al., Reference Dahlhoff, Stillman and Menge2002), may be due to energy conservation. The level of CCO activity for O. stentina ranged from 8.26 mU mg−1 prot in February to 1.20 mU mg−1 prot in October. In general, decrease in enzyme activity may be due to environmental stress caused by a high temperature level or M. refringens infection. FCA analysis allowed separating CS and CCO activity from Marteilia. These enzyme activities seem to be opposite to Marteilia infection since they correspond to the lowest values during the high infection of parasite. In fact, the digestive gland, where M. refringens and other Marteilia species occur, is a site of intracellular food digestion and one of the main sites for the storage of metabolic reserves (Serve, Reference Serve and Lowenstein1969). Consequently, Marteilia infection causes a poor condition index with glycogen loss (emaciation) (Robert et al., Reference Robert, Borel, Pichot and Trut1991), discolouration of the digestive gland (Alderman, Reference Alderman1979), tissue necrosis (Comps et al., Reference Comps, Pichot and Deltreil1979), reproduction (Rebert et al., Reference Robert, Borel, Pichot and Trut1991) and mortalities (Berthe et al., Reference Berthe, Le Roux, Adlard and Figueras2004).
Based on our results, the products of glycolysis appear not to be used primarily for energy expenditure of the animal but rather oriented towards storage, gametogenesis or defence cells. Apparently, marteiliosis exacerbates the poor condition of the host. Oysters during reproduction may not have enough energy (lipids and carbohydrates) to defend themselves against M. refringens infection. Sexually mature oysters are therefore most affected by the infection. Furthermore, the drop of enzyme activity may be explained by the lack of nutritional resources due to necrosis of digestive tissues following infection by M. refringens (Comps et al., Reference Comps, Pichot and Deltreil1979) and depression of the energy state and the metabolic enzymes activities seen during our study.
CONCLUSION
Our results provide useful information on the energy state and enzyme activities in an attempt to describe the biochemical composition of O. stentina infected by M. refringens from Monastir Bay. The detection of parasites of the genus Bonamia and M. refringens in O. stentina from Monastir in 2009 with a higher prevalence of M. refringens (87.8%) suggested that M. refringens with other multiple factors could play an important role in the mass mortalities observed in Monastir Bay. The continuity of intense reproductive activity of O. stentina wherein much of the energy is devoted to reproduction led us to conclude that a weak defence system may be perturbed and cause a high parasite infection. Reproduction and the infection by the parasite M. refringens compounds could be involved in the depression of the energy state and the metabolic enzymes activities observed during our study.
ACKNOWLEDGEMENTS
Dr Arnaud Huvet and Jeanne Moal are acknowledged as heads of the Laboratoire de Physiologie des Invertébrés, Centre de Brest IFREMER, for having allowed visit studies in France. We thank Jean Prou and Tristan Renault from Ifremer La Tremblade for their welcome in the Laboratoire de Génétique et Pathologie des Mollusques Marins at Ifremer La Tremblade station.
FINANCIAL SUPPORT
This research was supported by a grant from the Tunisian Ministry of Higher Education, Scientific Research and Technology.