


Introduction
Systemic lupus erythematosus (SLE) and multiple sclerosis (MS) both disrupt the central nervous system (CNS), affecting cognitive ability, emotional stability, and vocational capacity. In MS, there is more evidence of neurodegeneration, particularly within the cerebral gray matter (for a review, see Geurts & Barkhof, Reference Geurts and Barkhof2008). In SLE, the cerebral pathology is heterogeneous and related to changes in white matter that could include areas of demyelination and/or vasculopathy (Bosma, Rood, Zwinderman, Huizinga, & van Buchem, Reference Bosma, Rood, Zwinderman, Huizinga and van Buchem2000; Ellis & Verity, Reference Ellis and Verity1979; Govoni, Castellino, Padovan, Borrelli, & Trotta, Reference Govoni, Castellino, Padovan, Borrelli and Trotta2004; Johnson & Richardson, Reference Johnson and Richardson1968; Kozora, Hanly, Lapteva, & Filley, Reference Kozora, Hanly, Lapteva and Filley2008). In contrast to MS, where primary disruption is limited to the central and peripheral nervous system, any organ system can be disrupted or injured in SLE patients (Vasilesios, Krishnan, & Tsokos, Reference Vasilesios, Krishnan and Tsokos2006). Despite differences in pathophysiology, important commonalities are present between MS and SLE, particularly in the manifestation of cognitive dysfunction. Recently, a review by Benedict, Shucard, Zivadinov, and Shucard (Reference Benedict, Shucard, Zivadinov and Shucard2008) noted similarities in both cerebral pathology and the cognitive profile between MS and SLE.
Demyelination is the defining characteristic of MS (Cercignani et al., Reference Cercignani, Iannucchi, Rocca, Comi, Horsfield and Filippi2000; Kutzelnigg et al., Reference Kutzelnigg, Lucchinetti, Stadelmann, Bruck, Rauschka, Bergmann and Lassmann2005) and impairments in mental processing speed are prevalent (Filley, Heaton, Nelson, Burks, & Franklin, Reference Filley, Heaton, Nelson, Burks and Franklin1989; Parmenter, Shucard, Benedict, & Shucard, Reference Parmenter, Shucard, Benedict and Shucard2006; Parmenter, Shucard, & Shucard, Reference Parmenter, Shucard and Shucard2007; Swirsky-Sacchetti, Field, et al., Reference Swirsky-Sacchetti, Field, Mitchell, Seward, Lublin, Knobler and Gonzalez1992). However, axonal transection (Trapp et al., Reference Trapp, Peterson, Ransohoff, Rudick, Mork and Bo1998) and gray matter atrophy also is observed and in most studies is a more robust determinant of neuropsychological (NP) impairment (Geurts & Barkhof, Reference Geurts and Barkhof2008; Houtchens et al., Reference Houtchens, Benedict, Killiany, Sharma, Jaisani, Singh and Bakshi2007; Pirko, Lucchinetti, Sriram, & Bakshi, Reference Pirko, Lucchinetti, Sriram and Bakshi2007; Rovaris et al., Reference Rovaris, Iannucci, Falautano, Possa, Martinelli, Comi and Filippi2002; Sanfilipo, Benedict, Weinstock-Guttman, & Bakshi, Reference Sanfilipo, Benedict, Weinstock-Guttman and Bakshi2006; Tekok-Kilic et al., Reference Tekok-Kilic, Benedict, Weinstock-Guttman, Dwyer, Carone, Srinivasaraghavan and Zivadinov2007). As in MS, cerebral atrophy is found in SLE (Abreu et al., Reference Abreu, Jakosky, Folgerini, Brenol, Xavier and Kapczinsky2005; Appenzeller et al., Reference Appenzeller, Bonilha, Rio, Min Li, Costallat and Cendes2007; Hachulla et al., Reference Hachulla, Michon-Pasturel, Leys, Pruvo, Queyrel, Masy and Devulder1998; Sibbitt, Sibbitt, & Brooks, Reference Sibbitt, Sibbitt and Brooks1999). White matter involvement and slowed processing speed are also present in SLE (Emmer et al., Reference Emmer, Veer, Steup-Beekman, Huizinga, van der Grond and van Buchem2010; Kozora & Filley, Reference Kozora and Filley2011; Shucard, Lee, Hamlin, & Shucard, Reference Shucard, Lee, Hamlin and Shucard2011; Zhang et al., Reference Zhang, Harrison, Heier, Zimmerman, Ravdin, Lockshin and Ulug2007). Furthermore, gray matter atrophy has also been documented (Appenzeller et al., Reference Appenzeller, Bonilha, Rio, Min Li, Costallat and Cendes2007), and it has been suggested that gray matter is particularly affected in patients with cognitive or neuropsychiatric symptoms (Steens et al., Reference Steens, Admiraal-Behloul, Bosma, Steup-Beekman, Olofsen, Le Cessie and Van Buchem2004).
Measures of neuropsychological function have revealed that MS patients are most impaired on tests emphasizing mental processing speed (Archibald & Fisk, Reference Archibald and Fisk2000; DeLuca, Chelune, Tulsky, Lengenfelder, & Chiaravalloti, Reference DeLuca, Chelune, Tulsky, Lengenfelder and Chiaravalloti2004; Denney, Sworowski, & Lynch, Reference Denney, Sworowski and Lynch2005; Forn, Belenguer, Parcet-Ibars, & Avila, Reference Forn, Belenguer, Parcet-Ibars and Avila2008), working memory (Covey, Zivadinov, Shucard, & Shucard, Reference Covey, Zivadinov, Shucard and Shucard2011; D'Esposito et al., Reference D'Esposito, Onishi, Thompson, Robinson, Armstrong and Grossman1996; Drew, Starkey, & Isler, Reference Drew, Starkey and Isler2009; Lengenfelder et al., Reference Lengenfelder, Bryant, Diamond, Kalmar, Moore and DeLuca2006; Parmenter et al., Reference Parmenter, Shucard and Shucard2007; Rogers & Panegyres, Reference Rogers and Panegyres2007), and episodic memory (Heaton, Reference Heaton1985; Rao, Leo, Bernardin, & Unverzagt, Reference Rao, Leo, Bernardin and Unverzagt1991). To a lesser extent, impairment is also seen on tests of spatial processing (Vleugels et al., Reference Vleugels, Lafosse, van Nunen, Nachtergaele, Ketelaer, Charlier and Vandenbussche2000), expressive language (Beatty, Reference Beatty2002), and executive function (Arnett et al., Reference Arnett, Rao, Grafman, Bernardin, Luchetta, Binder and Lobeck1997; Beatty, Hames, Blanco, Paul, & Wilbanks, Reference Beatty, Hames, Blanco, Paul and Wilbanks1995; Foong et al., Reference Foong, Rozewicz, Quaghebeur, Davie, Kartsounis, Thompson and Ron1997; Roca et al., Reference Roca, Torralva, Meli, Fiol, Calcagno, Carpintiero and Correale2008). In SLE, the prevalence of cognitive impairment ranges widely (Ainala, Loukkola, Peltola, Korpela, & Hietaharju, Reference Ainala, Loukkola, Peltola, Korpela and Hietaharju2001; Denburg, Carbotte, & Denburg, Reference Denburg, Carbotte and Denburg1987, Reference Denburg, Carbotte and Denburg1997; Hanly, Liang, Moore, & Lahita, Reference Hanly, Liang, Moore and Lahita1997), with impairment most prominent in the domains of processing speed (Glanz, Schur, Lew, & Khoshbin, Reference Glanz, Schur, Lew and Khoshbin2005; Loukkola et al., Reference Loukkola, Laine, Ainiala, Peltola, Metsanoja, Auvinen and Hietaharju2003) and working memory (Shucard et al., Reference Shucard, Parrish, Shucard, McCabe, Benedict and Ambrus2004, Reference Shucard, Lee, Hamlin and Shucard2011), verbal memory (Kozora, Arciniegas, et al., Reference Kozora, Arciniegas, Filley, West, Brown, Miller and Zhang2008), and spatial processing or memory (Monastero et al., Reference Monastero, Bettini, Del Zotto, Cottini, Tincani, Balestrieri and Padovani2001). In our review (Benedict et al., Reference Benedict, Shucard, Zivadinov and Shucard2008), we observed that the cognitive profiles are similar but effect sizes are larger in MS than in SLE, with impairment most commonly found on measures of processing speed, working memory, and visual/spatial memory. It has also been shown that NP deficits contribute to work disability in both MS (Amato et al., Reference Amato, Ponziani, Pracucci, Bracco, Siracusa and Amaducci1995; Amato, Ponziani, Siracusa, & Sorbi, Reference Amato, Ponziani, Siracusa and Sorbi2001; Benedict et al., 2005; Morrow et al., Reference Morrow, Drake, Zivadinov, Munschauer, Weinstock-Guttman and Benedict2010; Rao, Leo, Ellington, et al., Reference Rao, Leo, Bernardin and Unverzagt1991) and SLE (Appenzeller, Cendes, & Costallat, Reference Appenzeller, Cendes and Costallat2009; Baker & Pope, Reference Baker and Pope2009; Panopalis, et al., Reference Panopalis, Julian, Yazdany, Gillis, Trupin, Hersh and Yelin2007).
Despite the apparent similarities in cognitive dysfunction in MS and SLE, and impact on vocational outcomes, we are aware of no study that has compared MS and SLE patients on the same neuropsychological battery and examined the relationship between cognition and vocational status. We, therefore, aim to (a) examine NP performance across MS and SLE patients closely matched on demographics and several disease-related variables, and (b) determine if there are differences in how NP performance is related to susceptibility to vocational disability between these two groups. In terms of hypothesis (b) specifically, we tested whether executive and non-executive measures of NP function were significantly related to vocational status and if this relationship was moderated by disease status (SLE or MS). We predicted that MS patients would show more cognitive impairment than SLE patients, and that NP performance would be associated with vocational outcomes in both patient groups.
Methods
Participants
Participants included 47 SLE patients, 47 MS patients, and 44 healthy controls. Before participation, all patients and controls provided written consent as approved by institutional review boards of the University at Buffalo. The groups were matched closely on gender, age, and education (see Table 1). The patient groups were also matched on disease duration, measured as the number of years since diagnosis of SLE or MS, and matched on disease severity using the Expanded Disability Status Scale (EDSS; Kurtzke, Reference Kurtzke1983) for MS and items from the Systemic Lupus Activity Measure (SLAM; Liang, Socher, Larson, & Schur, Reference Liang, Socher, Larson and Schur1989) for SLE. Though equating these two measures is difficult, the distribution of EDSS scores for MS and SLAM derived scores for SLE was very similar in our samples (kurtosis and skew were between 1 and −1 for both distributions), and both groups had relatively low disease severity based on these tests (see below). The major ethnicity was Caucasian (SLE patients n = 42 or 89.4%, African American, n = 3 or 6.4%; Asian, n = 1 or 2.1%; MS Caucasian n = 43 or 91.5%; African American, n = 3 or 6.4%; Asian, n = 1 or 2.1%). The SLE group also included one Hispanic (n = 1 or 2.1%) participant. The majority of the controls were also Caucasian (n = 42 or 95.5%), and included African American participants as well (n = 2 or 4.5%).
Table 1 Group demographics

Note. Values for age, education, and disease duration are mean (standard deviation). SLE = systemic lupus erythematosus; MS = multiple sclerosis; RR = relapsing remitting.
The MS group included 38 relapsing remitting (RR) and 9 secondary progressive patients (SP) (Lublin & Reingold, Reference Lublin and Reingold1996). EDSS scores obtained within six months of NP testing were available for all 47 MS patients. The median score was 2.5 (range, 0–6.0).
The SLE group included 36 patients with neuropsychiatric involvement. According to American College of Rheumatology (ACR) criteria (ACR Ad Hoc Committee on Neuropsychiatric Lupus Nomenclature, 1999), neuropsychiatric SLE is defined by 19 central or peripheral nervous system syndromes, which range from diffuse (e.g., migraine, depression) to overt (e.g., stroke, seizure). Eleven SLE patients did not have any identified neuropsychiatric involvement. Table 2 lists the neuropsychiatric syndromes for each SLE patient, with the exception of cognitive dysfunction. For those patients identified as having a TIA or stroke, the event was mild in all cases, with no permanent observable physical impairment and no focal cognitive damage (e.g., aphasia). Disease severity for SLE patients was calculated as the sum of positive responses on a checklist of current symptoms (e.g., fever, hair loss, joint pain, etc.) derived from the clinical manifestation categories of the SLAM (maximum possible symptom checklist score of 19). Disease severity was obtained for all 47 SLE patients. The median score was 5.00 (range, 0–12.0). None of the controls were on prescription medications, and medications for the SLE and MS patients were carefully documented. Medications being taken by patients included immunomodulatory drugs (SLE, n = 8; MS, n = 32), antianxiety/anticonvulsants (SLE, n = 6; MS, n = 19), antidepressants (SLE, n = 27; MS, n = 19), stimulants (SLE, n = 0; MS, n = 6), memory related medications (SLE, n = 0; MS, n = 2), and steroids (SLE, n = 16; MS, n = 0).
Table 2 History of NPSLE syndromes in SLE patients studied

Measures
The cognitive testing battery administered to controls, SLE patients, and MS patients included measures of expressive language, spatial processing, memory, mental processing speed, verbal and nonverbal memory, and higher executive function. Specific measures used to evaluate these cognitive functions were as follows: Generative word fluency was measured with the Controlled Oral Word Association Test (COWAT; Benton, Sivan, Hamsher, Varney, & Spreen, Reference Benton, Sivan, Hamsher, Varney and Spreen1994). The total number of words generated was obtained for analysis. Auditory/verbal memory was assessed with the California Verbal Learning Test, second edition (CVLT2; Delis, Kramer, Kaplan, & Ober, Reference Delis, Kramer, Kaplan and Ober2000). Five measures were derived: trial 1, trial 5, total learning (trials 1–5), delayed recall, and delayed recognition discriminability (absolute difference in standard deviation units between hits and false-positives during the yes/no recognition; or, the Z score of hits minus the Z score of false-positives). Visual/spatial perception was assessed with the Benton Judgment of Line Orientation Test (JLO; Benton et al., Reference Benton, Sivan, Hamsher, Varney and Spreen1994; Qualls, Bliwise, & Stringer, Reference Qualls, Bliwise and Stringer2000). The dependent measure was total correct responses. Visual/spatial memory was assessed with the Brief Visual-Spatial Memory Test-Revised (BVMTR; Benedict, Reference Benedict1997). Five measures analogous to the CVLT2 were derived as follows: trial 1, trial 3, total learning, delayed recall, and delayed recognition index. Processing speed was assessed using the Rao adaptations (Rao, Reference Rao1991) of the Symbol Digit Modalities Test (SDMT; Smith, Reference Smith1982) oral version and the Paced Serial Addition Test (PASAT; Gronwall, Reference Gronwall1977). The total number of correct responses was recorded for the SDMT. The total number of correct responses was also obtained for the PASAT using both the 3- and 2-sec inter-stimulus interval (ISI) conditions. Higher executive function was measured using the Delis-Kaplan Executive Function System (DKEFS) Sorting Test (Delis, Kaplan, & Kramer, Reference Delis, Kaplan and Kramer2001). Measures derived from this test included the total correct sorts (total number of correct sorts or groupings made) and scoring of the depth of the descriptions of correct groupings (DKEFS Description Score). Depression was assessed using the Beck Depression Inventory Fast Screen (BDI-FS; Beck, Steer, & Brown, Reference Beck, Steer and Brown2000; Benedict, Fishman, McClellan, Bakshi, & Weinstock-Guttman, Reference Benedict, Fishman, McClellan, Bakshi and Weinstock-Guttman2003) and fatigue was quantified using a self-report questionnaire, the Fatigue Severity Scale (FSS; Chipchase, Lincoln, & Radford, Reference Chipchase, Lincoln and Radford2003; Krupp, LaRocca, Muir-Nash, & Steinberg, Reference Krupp, LaRocca, Muir-Nash and Steinberg1989).
Vocational status was assessed from patient reports of their current work activity, before NP testing. Patients reported their working status as one of the following: (1) full time without restrictions, (2) full time with reduced capacity, (3) part time, (4) homemaker, student, or volunteer, (5) unemployed but not disabled, (6) unemployed and disabled subjectively, (7) unemployed and disabled objectively, or (8) retired due to age. From these reports, a binomial, categorical dependent variable was derived for logistic regression analysis (employed vs. unemployed). Patients who were gainfully employed (working full time, 1 and 2 from above) were classified as employed. Patients who were fully unemployed for any reason (5, 6, and 7 from above) were classified as unemployed. Patients who reported themselves as working part time, as a homemaker/student/volunteer, or were retired were excluded from the analyses since they did not fit cleanly into either the employed or unemployed categories. This procedure resulted in the following groups: SLE patients, 16 employed 17 unemployed; MS patients, 19 employed 20 unemployed. For our statistical analyses, SLE and MS patients were combined into a single group, resulting in a total of 35 employed and 37 unemployed patients.
Procedures
SLE patients were recruited from the Systemic Autoimmune Disease center at Buffalo General Hospital and from local rheumatologists for participation in a research study. Diagnosis of SLE was confirmed by a rheumatology specialist. All SLE patients met the American Rheumatism Association revised criteria for SLE (Tan et al., Reference Tan, Cohen, Fries, Massi, McShane and Rothfield1982). MS patients entered the study for one of three reasons: participation in research (n = 30; 63.8%), routine monitoring of cognitive function (n = 13; 27.7%), or referral for evaluation of a specified management problem related to suspected cognitive impairment (n = 4; 8.5%). All MS patients had clinically definite MS (Polman et al., Reference Polman, Reingold, Edan, Filippi, Hartung, Kappos and Wolinsky2005). Control participants were recruited through advertisements in local newspapers. All study participants were screened for general selection criteria. The criteria included history of head trauma, visual problems not corrected by glasses, learning disability, or other medical conditions unrelated to SLE or MS that could affect cognition. Control participants were not included if they had an Axis I psychiatric disorder or were on psychotropic medications or other such medications that could potentially affect cognitive function. The neuropsychological battery was administered to each participant individually by a psychologist, trained assistant, or graduate student under the supervision of a board certified (ABPP-CN) neuropsychologist. The cognitive test battery required between 90 and 120 min.
Statistical Analyses
Our first objective was to examine the NP profiles of the SLE and MS groups. Group differences on categorical variables were examined by χ2 analysis and group effects on continuous variables with analysis of variance. One-way analysis of variance (ANOVA) was used to assess differences between groups for age, education, BDI-FS, FSS, and the previously mentioned NP tests. Tukey Honestly Significant Difference (HSD) post hoc tests were then conducted to probe significant group effects. In short, the NP profiles were determined by univariate ANOVA with criterion for significance and post hoc tests set at p < .01 to control for type 1 error. In addition, univariate analyses of covariance (ANCOVAs) were also conducted in which FSS and BDI-FS were covariates to assess the potential influence of fatigue and depression on NP performance in SLE and MS patients. Effect sizes were reported using partial eta squared (ηp2) for main effects and using Cohen's d (d) for post hoc comparisons.
Our second objective was to examine the association between cognitive ability and vocational status in SLE and MS patients. To test our hypothesis pertaining to this objective, logistic regression models were used with vocational status as the dependent variable (DV). Specifically, we sought to test whether disease status (SLE or MS) moderated the relationship between NP function and vocational outcome. One important issue to consider regarding these analyses was the sample size, which was relatively small. Since there were a relatively high number of NP variables (17 total) with respect to our sample size (35 unemployed and 37 unemployed patients), we reduced our data into two NP composite variables—executive and non-executive function. To create the executive function composite variable, measures from the PASAT, SDMT, and DKEFS were combined. To create the non-executive function composite variable, measures from the JLO, COWAT, CVLT2, and BVMTR were combined. Grouping these variables in this manner is consistent with previous work (Benedict et al., Reference Benedict, Holtzer, Motl, Foley, Kaur, Hojnacki and Weinstock-Guttman2011). To combine these variables, they first had to be converted to a standardized metric that would place all measures on an equal scale. To accomplish this, we computed the percent difference from the control mean at each measure for each patient. The following equation was used to compute these scores:
Where PN is the raw score for a given patient, CM is the control mean score, and PN%Δ is the percent difference from the control mean score for a given patient. These scores were then averaged across NP measures in the executive and non-executive categories to obtain the composite measure scores for each participant. While this method does eliminate the ability to determine relationships between vocational status and particular NP measures that may be more specifically related to vocational outcomes, it also reduces the number of predictors and thereby allows for more straightforward hypotheses and a more reliable model than if all 17 NP tests were separately used.
Once these percent difference measures were derived, we tested the relationship between NP function and vocational status in two blocks. To reduce multicollinearity, executive function, non-executive function, and disease status were all centered around their respective means (for the entire group of patients, SLE and MS included). In block one, only these first-order variables were entered into the model. Interaction terms were then created to assess the role of disease status as a moderator of the relationship between NP function and vocation status. The product of executive function and disease status (exec*ds) and the product of non-executive function and disease status (nonex*ds) were computed. In block two, these interaction terms were added to the model along with the first-order variables. The significance of predictors added within each block, as well as the overall model significance, was evaluated using χ2 analyses. The percentage of variance accounted for in the models was estimated with Cox and Snell pseudo R2. The criterion for a significant relationship between an IV and the DV in the logistic regression models was set at p < .05.
Results
Participant Characteristics
Descriptive variables are presented in Table 1. SLE, MS, and control groups did not differ on age [F(2,137) = 1.43; NS] or education [F(2,137) = 0.93; NS]. χ 2 analysis showed there was no significant difference in the proportion of males and females across groups (χ 2 = 2.48; df = 2; NS), or in the proportion of ethnic backgrounds (χ 2 = 3.14; df = 6; NS). SLE and MS groups also did not differ on disease duration (t = 0.65; NS).
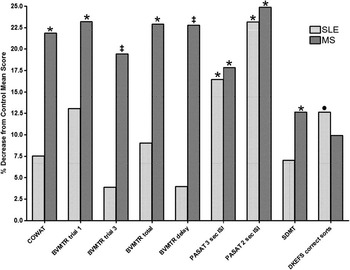
Fig. 1 Difference from controls on neuropsychological measures for SLE and MS patients. The bar graph depicts the percent decrease in score across cognitive domains in SLE (light bars) and MS (dark bars). All statistical analyses were performed using participants’ raw scores, but normalized scores are presented here for ease of reference. Neuropsychological measures are listed on the x-axis, with SLE and MS groups side by side for each measure. Significant differences determined using the raw scores are marked with the following: *, significantly different from Controls’ raw scores, p < .01; ‡, significantly different from Controls’ and SLE patients’ raw scores, p < .01; or •, near significant difference (DKEFS correct sorts) from Controls’ > SLE raw score, p = .012.
Comparison of Neuropsychological Measures, Depression, and Fatigue Across Groups
As can be seen in Table 3A, there were significant group effects for depression and fatigue. As expected, on BDI-FS score, controls reported fewer symptoms than both MS and SLE patients. A significant group difference was also found for FSS, with controls reporting significantly less fatigue than both MS and SLE patients. There were no significant differences between patient groups on BDI-FS and FSS.
Table 3A Psychological and neuropsychological analyses of variance

1Control < MS, p < .001; Control < SLE, p < .001.
2Control < MS, p < .001; Control < SLE, p < .001.
3Control > MS, p < .001; SLE > MS, p = .031.
4Control > MS, p = .008.
5Control > MS, p < .001; SLE > MS, p = .003.
6Control > MS, p < .001; SLE > MS, p = .028.
7Control > MS, p < .001; SLE > MS, p < .001.
8Control > MS, p = .003; Control > SLE, p = .006.
9Control > MS, p < .001; Control > SLE, p < .001.
10Control > MS, p = .009.
11Control > MS, p = .057; Control > SLE, p = .012.
BDI-FS = Beck Depression Inventory – Fast Screen; FSS = Fatigue Severity Scale; JLO = Benton Judgment of Line Orientation Test; COWAT = Controlled Oral Word Association Test; CVLT2 = California Verbal Learning Test, 2nd Edition; BVMTR = Brief Visual-Spatial Memory Test—Revised; PASAT = Paced Auditory Serial Addition Test; SDMT = Symbol Digit Modalities Test; DKEFS = Delis-Kaplan Executive Function System; Values for all measures are in Mean (Standard Deviation, or SD); Systemic Lupus Erythematosus (SLE), N = 47; Multiple Sclerosis (MS) N = 47; Control N = 44.
One-way ANOVAs were also used to assess differences between groups on NP performance. Please refer to Table 3A for the main effects and a summary of the post hoc findings (see also Figure 1). In general, MS patients performed more poorly than controls on verbal fluency (COWAT), visual/spatial memory (BVMTR trial 1, trial 3, total, and delayed recall), and processing speed and working memory (SDMT, PASAT 2 and 3 sec ISI). MS patients also showed a trend toward poorer performance than controls for CVLT2 trial 5 (p = .062; d = .463), BVMTR discrimination (p = .039; d = .412), DKEFS correct sorts (p = .057; d = .468), and DKEFS sort descriptions (p = .034; d = .522). SLE patients were not impaired as broadly, but did underperform compared to controls on measures of processing speed and working memory (PASAT 2 and 3 sec ISI). SLE patients also exhibited a very near significant trend in poorer performance, compared to controls, on tests of executive function (DKEFS correct sorts, see Table 3A). Additionally, SLE patients trended toward poorer performance than controls for the CVLT2 trial 1 (p = .088; d = .468) and DKEFS sort descriptions (p = .071; d = .458).
To determine whether fatigue and depression may have impacted performance on NP tests, ANCOVAs were performed with FSS and BDI-FS as covariates (see Table 3B). BDI-FS was a significant covariate (p < .01) for CVLT2 delay (and very near significant for discrimination), BVMTR trial 1 and total score, and SDMT. FSS was a significant covariate during the PASAT (both 3 and 2 second ISI). With BDI-FS and FSS as covariates, significant group effects (p < .01) were obtained only for BVMTR trial 3 and delay measures (which were impaired in MS but not in SLE, seen in Table 3A and above analyses). COWAT, BVMTR total, and to a lesser extent, CVLT2 trial 1 also approached significance. To summarize, deficits in visual-spatial memory were still found in MS patients even when controlling for subjective fatigue and depression. These results suggest that fatigue and depression in our patient sample may influence performance on certain NP tests.
Table 3B Neuropsychological analyses of covariance

Note. Bold and italicized font indicates a significant effect at p < .01. Italicized-only font indicates an effect that is nearly significant at p < .01.
Vocational Outcome Measures in SLE and MS Patients
Logistic regression models were used to determine the relationship between cognitive function and vocational status in SLE and MS patients (see Table 4). Specifically, we tested whether disease status (SLE or MS), executive function, and non-executive function were related to vocational status, and then whether disease status moderated the relationship between vocational status and NP composite variables. We therefore used two blocks in our analyses. In the first block, disease status, executive function, and non-executive function were added as IVs in the model, with vocational status (employed = 35, unemployed = 37) as the DV. These variables accounted for an estimated 19.4% of the variance, and the model was significant (χ 2 = 15.526; p = .001). Executive function was the only significant predictor in the model (Wald = 4.129; p = .042). In the second block, interaction variables were added along with the first-order variables to test the effects of moderation. Disease status was the moderator being tested, and, therefore, the interaction terms were the product of disease status and either NP composite variable (exec*ds, nonexec*ds). The first-order and interaction terms accounted for an estimated 23.6% of the variance in the model. The model was still significant (χ 2 = 19.341; p = .002), but the interaction terms in this block did not significantly improve the model (χ 2 = 3.815; p = .148). In this block, none of the predictors were significantly associated with vocation status at p < .05. Executive function (Wald = 3.313; p = .069) and the nonex*ds interaction term (Wald = 3.358; p = .067) trended toward significance.
Table 4 Logistic regression models of vocational outcome

Discussion
The present study compared cognitive performance across MS and SLE patients closely matched on demographic variables, and as closely as possible, disease severity. We also examined how cognitive performance was related to vocational status in these patients. Results indicated that MS patients were more severely impaired than their SLE counterparts, particularly in the domain of visual-spatial memory. However, SLE and MS patients both exhibited deficits in working memory and processing speed, as measured by the PASAT. With respect to the relationship between cognition and vocational status, executive function significantly predicted vocational outcomes in SLE and MS patients.
As noted previously, neuropsychological assessment revealed a more severely impaired cognitive profile in MS patients compared to SLE. Only MS patients were defective compared to controls on tests of generative verbal fluency and visual-spatial memory. Greater cognitive impairment in MS versus SLE was noted in a previous review by our group (Benedict et al., Reference Benedict, Shucard, Zivadinov and Shucard2008). That review concluded that neuropsychological impairment in MS patients is associated with a greater effect size compared to SLE patients across multiple cognitive domains. Recent MS research has highlighted neurodegenerative processes that may be responsible for this dysfunction, which includes gray matter atrophy (Amato et al., Reference Amato, Bartolozzi, Zipoli, Portaccio, Mortilla, Guidi and De Stefano2004; Benedict et al., Reference Benedict, Bruce, Dwyer, Weinstock-Guttman, Tjoa, Tavazzi and Zivadinov2007; Comi et al., Reference Comi, Filippi, Martinelli, Sirabian, Visciani, Campi and Canal1993; Piras et al., Reference Piras, Magnano, Canu, Paulus, Satta, Soddu and Aiello2003; Rovaris et al., Reference Rovaris, Iannucci, Falautano, Possa, Martinelli, Comi and Filippi2002; Swirsky-Sacchetti, Mitchell, et al., Reference Swirsky-Sacchetti, Mitchell, Seward, Gonzales, Lublin, Knobler and Field1992). Recently, we found that white matter atrophy was related to information processing speed and “neural efficiency,” whereas more global atrophy was related to correct responses in MS during a working memory task (Covey et al., Reference Covey, Zivadinov, Shucard and Shucard2011). Previous research has found that the relationship between brain structural abnormalities and cognition is less clear in SLE, especially in the absence of focal vascular injury (Appenzeller, Vasconcelos Faria, Min Li, Costallat, & Cendes, Reference Appenzeller, Vasconcelos Faria, Min Li, Costallat and Cendes2008; Belmont, Abramson, & Lie, Reference Belmont, Abramson and Lie1996). Short of stroke, gray matter involvement, lesion burden, and widespread damage are more subtle in SLE than in MS (Rovaris et al., Reference Rovaris, Viti, Ciboddo, Gerevini, Capra, Iannucci and Filippi2000). Studies such as these support the notion that neurodegeneration may be less pronounced in SLE than in MS, which could account for our findings of greater cognitive impairment in MS compared to SLE.
In the present study, we found PASAT performance to be the most sensitive measure of cognitive impairment in SLE. Poorer performance on the DKEFS was also found in SLE patients (as exhibited by a very near significant trend on DKEFS correct sorts). In previous studies in our laboratory, working memory and processing speed deficits were present in SLE patients using the PASAT (Shucard et al., Reference Shucard, Parrish, Shucard, McCabe, Benedict and Ambrus2004) and more recently using a visual n-back task (Shucard et al., Reference Shucard, Lee, Hamlin and Shucard2011). The findings with the visual n-back task were quite similar to those we found for MS using the same task (see Parmenter, Shucard, Benedict, & Shucard, Reference Parmenter, Shucard, Benedict and Shucard2006; Parmenter et al., Reference Parmenter, Shucard and Shucard2007, for example). Other researchers have found PASAT performance in patients with SLE to be associated with callosal atrophy (Lin, Tench, Morgan, & Constantinescu, 2008) and alterations in frontal-parietal activity (Fitzgibbon et al., Reference Fitzgibbon, Fairhall, Kirk, Kalev-Zylinska, Pui, Dalbeth and McQueen2008; Otte et al., Reference Otte, Weiner, Peter, Mueller-Brand, Goetz, Moser and Nitzsche1997). The presence of frontal and parietal abnormalities in SLE may be an important clue as to why we have found selective impairment of working memory, processing speed, and executive functions in our SLE group. Also, we and others have suggested that white matter damage is the primary disturbance associated with disruption in working memory and processing speed in SLE (Benedict et al., Reference Benedict, Shucard, Zivadinov and Shucard2008; Kozora & Filley, Reference Kozora and Filley2011; Leritz, Brandt, Minor, Reis-Jensen, & Petri, Reference Leritz, Brandt, Minor, Reis-Jensen and Petri2000; Shucard et al., Reference Shucard, Lee, Hamlin and Shucard2011), which is consistent with the possibility that the present study's findings reflect a more subtle underlying pathology in SLE compared to MS patients.
The present study has also identified an important caveat with respect to the profile of NP impairment in these two patient groups. The use of BDI-FS and FSS measures as covariates in the ANCOVA analyses provided evidence that impairments in NP performance may have been at least in part driven by fatigue and/or depression. For a more specific example, in the ANCOVA analyses, PASAT no longer revealed a significant group effect when FSS was a significant covariate, indicating that PASAT performance deficits in SLE and MS patients may have been in part due to fatigue. However, significant group effects were still obtained for BVMTR measures. Our ANOVA and post hoc analyses had determined this test was one of the tests in which only MS patients (and not SLE patients) showed poorer performance compared to controls (a somewhat similar finding was obtained for the COWAT, although this test only approached significance during the ANCOVA). This finding indicates that even when taking into account the effects of fatigue and depression, some cognitive functions remain impaired in MS patients.
Another important finding in the present study was that NP performance was predictive of vocational outcomes in both SLE and MS patient groups. This finding is in line with previous research that has reported that NP deficits contribute to vocational disability in both MS (Amato et al., Reference Amato, Ponziani, Pracucci, Bracco, Siracusa and Amaducci1995, Reference Amato, Ponziani, Siracusa and Sorbi2001; Benedict et al., Reference Benedict, Wahlig, Bakshi, Fishman, Munschauer, Zivadinov and Weinstock-Guttman2005; Morrow et al., Reference Morrow, Drake, Zivadinov, Munschauer, Weinstock-Guttman and Benedict2010; Rao, Leo, Ellington, et al., Reference Rao, Leo, Ellington, Nauertz, Bernardin and Unveragt1991) and SLE (Appenzeller et al., Reference Appenzeller, Cendes and Costallat2009; Baker & Pope, Reference Baker and Pope2009; Panopalis et al., Reference Panopalis, Julian, Yazdany, Gillis, Trupin, Hersh and Yelin2007). Specifically, we tested the relationship between composite measures of NP function and vocational status, and whether disease status moderated this relationship. We found (1) that our composite measure of executive function significantly predicted vocational status in our patient sample (SLE and MS), (2) that disease status did not appear to significantly moderate the relationship between executive function and vocational outcomes, and (3) that any moderating effects did not significantly improve our model. These findings suggest that not only are executive functions a common point of impairment in SLE and MS patients (as noted above with PASAT performance), but that this common impairment predicts employment status similarly in both diseases. These results do need to be interpreted with caution, however. We derived composite measures of executive and non-executive function to have a more reliable model with fewer degrees of freedom, which was important when considering our relatively small sample size. This procedure reduces our ability to know for sure which specific measures of executive function may be the most sensitive for predicting vocational outcomes. Further work with a larger sample size that allows for the inclusion of multiple NP measures is in order. Still, these results do provide a broad perspective about the types of cognitive impairments that contribute to vocational outcomes in both diseases, and that there are similarities in the relationships between cognitive impairment and employment status in SLE and MS.
There are several limitations to this study. Our sample was somewhat limited in size, which in part was the reason for the use of composite measures of cognitive function in our regression analyses, as described above. It is also possible that the manner in which patients were recruited may have influenced the results, since, unlike the SLE patients, not all of the MS patients were recruited for research purposes (63.8% of MS patients were research participants). Further work is needed to better understand the distinction between MS sub-types and SLE patients with or without neuropsychiatric involvement. In the present study, the majority of MS patients were relapsing-remitting (80.9%), but secondary progressive patients were also included. The majority of SLE patients had diffuse neuropsychiatric involvement (76.6%). Also, the combination of neuropsychology, imaging, and measures of vocational ability in these patient groups will provide needed information about the relationship between cerebral pathology, cognitive function, and quality of life.
Despite the noted shortcomings, the present study was able to elucidate several important similarities between SLE and MS. First, although MS patients showed greater overall impairment across cognitive domains, working memory dysfunction was found to be similar between these two patient groups. Second, although fatigue and depression may help account for poor NP performance on several tests in both SLE and MS patients, they do not seem to account for all of the variance in performance on tests of visual-spatial functioning. Furthermore, executive functioning was found to be an important predictor of vocational outcome for both groups. These similarities are intriguing because SLE and MS are two different diseases with different pathophysiologies. By equating these groups on demographic and disease-related variables, we have revealed differences as well as similarities in cognitive functioning between these diseases. The present study extends and brings together findings from disparate literatures that have examined these two diseases separately.
Acknowledgements
This work was supported in part by National Institutes of Health Grant NS049111 awarded to J Shucard Ph.D. and National Multiple Sclerosis Society Grant R64060A3 to R Benedict Ph.D. There were no conflicts of interest.


