


INTRODUCTION
Adoration for light skin tones and aversion to dark complexions are widely prevalent in Indian society. At the same time, skin tone has not been a source of political identity. Together these factors should make it difficult for darker-skinned candidates to get into elected office. And yet, a substantial number of the elected members of India's legislative bodies are dark-skinned.Footnote 1 For example, 28.5% of those Indian Members of Parliament elected in 2014 and 25% of those Members of the Delhi State Legislative Assembly elected in 2013 possess a dark complexion.Footnote 2 In this paper, we present findings that suggest that the electoral success of darker-skinned Indian politicians derives from the fact that there is weak support for colorism—the preference for those with fairer skin—among India's electorate as a whole. This appears to reflect heterogeneity of preferences across subgroups of our sample: among poor and Dalit respondents, darker-skinned candidates are treated similarly to light-complexioned candidates and preferred to those with an intermediate, medium-brown skin tone.
It is well established that voters make decisions during elections based upon limited information. Without comprehensive knowledge of their choices, voters rely on information shortcuts to arrive at their decisions. Candidate appearance is one such important shortcut. The broader political science literature suggests that candidate appearance affects candidate electability (Ballew and Todorov Reference Ballew and Todorov2007; Bergren, Jordahl, and Poutvaara Reference Bergren, Jordahl and Poutvaara2010; Efrain and Patterson Reference Efran and Patterson1974; King and Leigh Reference King and Andrew2009; Lawson et al. Reference Lawson, Lenz, Baker and Myers2010). Voters pay attention to candidate pictures in deciding whom to vote for in elections (Rosenberg et al. Reference Rosenberg, Bohan, McCafferty and Harris1986) and they rely on the race, ethnicity, and age of a candidate to draw inferences about that candidate's prospects for success (Banducci et al. Reference Banducci, Karp, Thrasher and Rallings2008). Biases triggered by appearance are strong; voters rely on them even in instances when they are provided with information on candidate issue positions (Budesheim and DePaola Reference Budesheim and DePaola1994). Skin complexion is a significant attribute of candidate appearance. Research on electoral consequences of skin color from the United States and Brazil points to the prevalence of colorism; voters prefer lighter-skinned candidates over darker ones (Aguilar et al. Reference Aguilar, Cunow, Desposato and Barone2015; Maddox and Gray Reference Maddox and Gray2002; Terkildsen Reference Terkildsen1993; Weaver Reference Weaver2012). The theory of descriptive representation challenges this universal preference for lighter candidates. It argues that voters are drawn to candidates with whom they share common identifiable characteristics, which can include skin color. As a result, not everyone will prefer the lighter skin shade (Barreto Reference Barreto2010; Leigh and Susilo Reference Leigh and Susilo2009; Pitkin Reference Pitkin1978).
In India, voters’ preferences for candidates are influenced by a variety of cues, including caste, socioeconomic status, religion, party affiliation, family background, and candidates’ constituency service. Yet, despite the substantial literature on electoral behavior, the mobilization of marginalized groups, and social discrimination in Indian politics, we were unable to locate a single study that explored the electoral consequences of skin color. Whether and how skin color informs voter preferences for candidates in a non-racial, but still color-conscious society remains to be determined.
We use a survey experiment to examine voter preferences regarding candidate skin color in Delhi, the national capital of India, where skin tone is not a strict identity marker. Each of our 599 respondentsFootnote 3 was shown a variant of a photograph of a hypothetical candidate who was “thinking of running for office in [their] district.” The candidate's skin tone was manipulated in advance to be either fair, wheatish, or dark. Each respondent was randomly assigned one of these three skin color treatments. Respondents were then asked whether they would vote for the candidate.
We find a mild preference for fair candidates among our full sample of respondents. Between the two politically mobilized categories of respondents who are from darker-skinned groups, Dalits and the poor, there is a stronger support for dark candidates than that found among other subsets of respondents.Footnote 4 Indeed, among Dalits and the poor, dark candidates are preferred to wheatish candidates.Footnote 5 In sharp contrast, those respondents who are neither poor nor Dalit prefer the fair candidate to the dark candidate. Our findings therefore indicate a weak presence of colorism in electoral politics in Delhi. They also suggest that even when voters are not directly mobilized on the basis of skin color, complexion can emerge as an identity marker for other political identities. Even though dark skin tone is not a strict marker of class or caste identity, the latter are still politicized identities that are recognized through state policies and mobilized by political parties. This political mobilization may enable the poor and Dalits to use skin tone as an identity cue for our dark candidate. But, absent such political mobilization, our findings indicate that dark skin tone holds little beneficial sway among voters; even dark-complexioned voters are more likely to support a fair candidate than a dark one.Footnote 6
The paper proceeds as follows. Our “Theory and Hypotheses” section reviews the theory and generates the hypotheses we will test. Our “Study Design” section details the design of our study, while in our “Data Analysis” section we present the results. Finally, in our “Discussion and Implications” section we discuss those results and their implications.
THEORY AND HYPOTHESES
We draw our hypotheses from two distinct literatures, one on colorism and the other on descriptive representation, and we discuss them serially below. We also discuss a possible refinement to the theory of descriptive representation—that it operates with greater force amongst politically mobilized social groups.
Colorism
The theory of colorism suggests a relationship between voter preferences and candidate skin color. It argues that individuals face discrimination based on their phenotypes, regardless of their racial and ethnic identity. Research suggests that dark skin color is stigmatized the world over. In implicit association tests, it is linked with negative words, while fair skin color is linked with positive ones (Nosek et al. Reference Nosek, Smyth, Hansen, Devos, Linder and Ranganath2007). Dark skin color has also been shown to trigger negative stereotypes (Maddox and Gray Reference Maddox and Gray2002), to be responsible for convicts receiving longer prison sentences (Eberhardt et al. Reference Eberhardt, Goff, Purdie and Davies2004), and for evoking less sympathy in others (Dixon and Maddox Reference Dixon and Maddox2005; Iyengar and Hahn Reference Iyengar and Hahn2007). Researchers find that, as compared with their lighter-skinned counterparts, darker-skinned blacks have less income and education (Hersch Reference Hersch2006; Hochschild and Weaver Reference Hochschild and Weaver2007). The same gap shows up in wages: while it is insignificant between whites and lighter-skinned blacks, it is substantial between darker and lighter-skinned blacks (Goldsmith et al. Reference Goldsmith, Hamilton and Darity2007; Kreisman and Rangel Reference Kreisman and Rangel2015). This bias against dark skin color and in favor of lighter complexion also drives voter behavior, with voters preferring lighter-skinned candidates to darker ones (Hunter Reference Hunter2007; Maddox and Gray Reference Maddox and Gray2002; Weaver Reference Weaver2012). In the United States, for example, while skin color is a weak predictor of who runs for office, black politicians with lighter skin tone are more likely to be elected (Hochschild and Weaver Reference Hochschild and Weaver2007).
Though Indian society is not divided into racial groups—in contrast to the United States and parts of Europe and Latin America—social stratification is prevalent along caste and socioeconomic status lines. There is also substantial anecdotal evidence that suggests that Indians care about skin color.Footnote 7 Fair skin color is regarded as an asset in the job and marriage markets (Bhattacharya Reference Bhattacharya2012). Indians develop a common sense around skin color early in life. In children's books and comics, for example, the poor and needy have come to be depicted as dark-skinned, while fair skin color has come to be associated with nobility and wealth (Parameswaran and Cardoza Reference Parameswaran and Cardoza2009a). Today, popular stereotypes correlate caste and socioeconomic status with skin color.Footnote 8 Skin tone is also emphasized in matrimonial advertisements for both men and women (Jha and Adelman Reference Jha and Adelman2009; Vaid Reference Vaid and Glenn2009). All major cosmetics conglomerates in India sell fairness or skin lightening creams for both sexes (Parameswaran and Cardoza Reference Parameswaran and Cardoza2009b; Shevde Reference Shevde2008) and 61% of the Indian skincare market is made up of such treatments, with annual sales exceeding 550 million dollars in 2014.Footnote 9
The stigma against dark skin is rooted in a number of beliefs. There is the theorized Aryan invasion in 1500 BCE that is thought to have involved Eurasian tribes in the defeat of indigenous, darker-skinned Dravidians, driving them deeper into peninsular India and subjugating them by declaring them to be lower castes (Chanda Reference Chanda1926; Gordon Reference Gordon1996; Wheeler Reference Wheeler1953).Footnote 10 Another popular historical explanation suggests that in order to institutionalize racist practices and draw clear distinctions between the rulers and the ruled, attempts were also made during the colonial period to show that the darker-skinned natives had descended from a different race that was slower, less intelligent, and, therefore, inferior to the white European race. The thrust of this argument is that 250 years of colonial experience associated fair skin color with power, and that the preference for fair skin tone in Indian society seven decades after the departure of the British is the lingering legacy of this historical period (Nadeem Reference Nadeem2014; Malhotra and Singh Reference Malhotra and Singh2015).Footnote 11 Meanwhile, it has also been argued that growth in the number of skin fairness products and the advertising around them fuels a desire for fairness and entrenches latent biases against darker skin (Nadeem Reference Nadeem2014).
Skin-color-based social biases notwithstanding, skin tone has not been a source of political mobilization in India. Moreover, the Indian state does not recognize skin color-related discrimination and has not made any specific laws to prevent or punish prejudiced behavior in this context.
With the above in mind, but no India-specific literature on skin tone in electoral politics, we use the extensive literature on colorism in other countries to formulate the following initial hypothesis regarding the electoral consequences of candidate skin tone.
Hypothesis 1: Irrespective of their caste, income category, gender, literacy, and skin complexion, voters are more willing to vote for a fair candidate than for a wheatish or dark candidate; voters are also more willing to vote for a wheatish candidate than for a dark candidate.
Descriptive Representation
The theory of descriptive representation suggests different preferences regarding candidate skin color. It holds that voters belonging to a particular group want to be represented by those who outwardly resemble them (Barreto Reference Barreto2010; Chandra Reference Chandra2004; Graves and Lee Reference Graves and Lee2000; Leigh and Susilo Reference Leigh and Susilo2009; Pitkin Reference Pitkin1978; Sigelman and Sigelman Reference Sigelman and Sigelman1982; Stokes-Brown Reference Stokes-Brown2006; Tate Reference Tate2003). According to this literature, as long as candidate appearance allows voters to identify with a candidate, voters will pay attention to it. Caste and socioeconomic status are stereotypically linked with skin color in India. Our data suggest that these stereotypes are not unfounded (see Table 3).
Descriptive representation and colorism have overlapping predictions for color preference among some voters, but diverging predictions among others. Voters who are fair-skinned or from upper caste or higher socioeconomic status backgrounds should prefer lighter-skinned candidates under either colorism or descriptive representation. Since under descriptive representation dark-skinned voters should prefer dark candidates and since dark complexion can signal lower caste or socioeconomic status, we should expect voters from darker groups to be relatively supportive of the dark candidate.
With the above predictions of descriptive representation theory in mind, we formulate a second, alternative, hypothesis regarding the electoral consequences of candidate skin tone.
Hypothesis 2: Support for dark candidates relative to non-dark candidates is stronger among dark-complexioned, Dalit, and poor voters than among other voters.
It is, of course, possible that respondents who are dark-complexioned, Dalit, or poor may have preferences that are influenced by both colorism and descriptive representation. This will likely result in these groups becoming an aggregate, preferring both fair and dark candidates to wheatish ones.
Political Mobilization Matters
The voting preferences of respondents from darker groups may be driven by a desire for descriptive representation, but they have not been politically mobilized on the basis of skin color. That said, two groups—Dalits and the poor—have been mobilized by political parties on the basis of their membership in these distinct identity categories.Footnote 12 The politicization and mobilization of lower caste and lower income identities has been assisted by state policies. The Indian state records the castes of Dalits during the census. It also provides a range of affirmative action policies for Dalit uplift, including quotas in public sector jobs and public schools. Similarly, through classification of citizens into the “Below Poverty Line” category and through public programs created to assist the poor, state policies have recognized class identity.
Though skin color may not be an explicit marker of caste or socioeconomic status, it can still act as an implicit cue. In the worlds they inhabit, Dalits and poor voters are often surrounded by people who are darker in skin tone than those who surround their relatively more advantaged counterparts, those from higher caste and/or socioeconomic status backgrounds. Their local party workers and political intermediaries, who are usually from their localities, are more likely to have darker skin as well. In addition, both groups have witnessed the rise of lower caste politicians and those from poorer backgrounds who are, on average, darker in skin tone than those from the upper castes or from higher socioeconomic status backgrounds. In other words, voters from Dalit and/or poor backgrounds are more likely to have been politically mobilized by individuals with darker skin tones.
In contrast, dark skin tone has neither been recognized by the state nor been a basis for political mobilization. While dark skin color on its own is a source of stigma in India, it does not define an exclusive collective identity.Footnote 13 A desire for descriptive representation, for example, drives black voters in the United States to respond to racial cues when choosing representatives. At the same time, they also prefer lighter-skinned black candidates to darker ones since skin tone, unlike race, is not a politically salient identity in U.S. politics (Weaver Reference Weaver2012).Footnote 14 In other words, skin tone as a shared attribute will not matter to a voter if it is empty of political meaning. If, however, skin color is a visible marker of a politically mobilized identity, like race, ethnicity, or class, voters will respond to it. This then suggests that we should expect candidate color preferences for Dalit and poor voters to diverge from those of dark voters, with the former more likely to express a desire for descriptive representation than the latter.
With the above consideration of the manner in which political mobilization interacts with descriptive representation in mind, we formulate the following third alternative hypothesis regarding the electoral consequences of candidate skin tone.
Hypothesis 3: Support for dark candidates relative to non-dark candidates is stronger among Dalit and poor voters than among dark voters who are neither Dalit nor poor.
STUDY DESIGN
Parliamentary and state assembly elections in India are low-information exercises (Chandra Reference Chandra2004). As a result, candidate posters and images are strong cueing instruments.Footnote 15 In India, voters find out about candidate appearance through campaign rallies and meetings, as well as through election materials, including billboards, posters, pamphlets, badges, television appearances, and newspaper ads. In fact, for a substantial portion of the electorate, those who are still unable to read, candidate appearance may hold even greater importance in terms of informing voting preferences. We test these colorism, descriptive representation, and mobilization hypotheses using a survey experiment.
We chose to proceed with a survey experiment to mitigate biases in the estimated effect of candidate skin-tone preferences on electoral choices associated with reverse causation and incidental association.Footnote 16 Such techniques have become commonplace in political science because of their ability to reveal causal effects, their ease of implementation, and the fact that they avoid many of the pitfalls of cross-sectional data (Gaines, Kuklinski, and Quirk Reference Gaines, Kuklinski and Quirk2006). We also chose a survey experiment because such an approach would allow us to avoid social desirability bias, which often arises when sensitive topics like race, ethnicity, or religion are involved.Footnote 17 Though skin color bias is non-racial in India, individuals might seek to hide their skin color biases if asked directly about them.
We conducted this survey experiment in DelhiFootnote 18 in the lead up to the 2013 state assembly elections.Footnote 19 To create our sample of respondents, we first randomly selected three polling stations from South Delhi, a relatively affluent area, and three from East Delhi, a relatively poor area. Next, we randomly selected 120 individuals from the electoral roll for each polling station. Sampling in this manner allowed us to capture a random distribution of the population across the six polling stations.Footnote 20
To manipulate candidate skin color we used a file photograph of an Indian manFootnote 21 who had a wheatish complexion. We then used software to create a fair and dark version of this same photograph, as seen below (Figure 1).
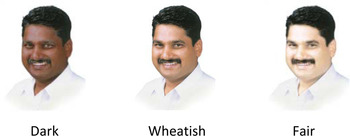
Figure 1. Experimental manipulation of candidate skin color
We used all three of these photographs in conjunction with our survey, first randomly sampling the electorate from the Delhi electoral rolls, as described above, and then ensuring that the particular photograph each respondent saw was randomly assigned, with one-third of the respondents from each constituency being assigned to each photograph. For each polling station, we used six interviewersFootnote 22 and each interviewer randomly received a list of 20 voters,Footnote 23 with each polling station being assigned two lists for each treatment photograph.
During survey administration, interviewers asked respondents to look at a photograph of an individual who was “thinking about running for office in [their] district.” Interviewers told respondents that the individual in the photograph had not chosen a party affiliation yet, something that is common in India. Interviewers then read each respondent this statement purportedly from the candidate: “Corruption is damaging everything in our society. I promise honesty and transparency while serving you.”Footnote 24 Our survey did not reveal the candidate's caste, either directly or more indirectly through the candidate's last name. Then, after respondents had seen the potential candidate's photograph and been presented his statement, interviewers asked respondents if they would vote for this individual. Our survey also asked for each respondent’s basic demographic information, including caste/subcaste, income, age, and educational background. During the survey, our interviewers discreetly categorized the skin color of each respondent as “fair,” “wheatish,” or “dark,” the very same categories that most Indians routinely use to identify skin color.Footnote 25
DATA ANALYSIS
We use regression analysis to measure skin color preference. Our dependent variable is an indicator that the respondent would support the candidate he or she was shown.Footnote 26 Regression analysis permits us to control for respondent characteristics that were not balanced perfectly across treatment groups. Appendix Table A1 shows some statistically significant imbalances in respondent characteristics across treatment groups. To the extent that any of these characteristics induce greater support for candidates in general, failing to control for these imbalanced characteristics would bias estimates of the relative treatment effects.Footnote 27
We run logit regressions of two forms. First, to test for color preferences within any given sample, we run:
 $$Z = {{\rm \beta} _0} + {{\rm \beta} _{FC}}FC + {{\rm \beta} _{DC}}DC + {\bf \gamma} ^{\prime}{\bf x} + e;$$
where Z is the latent propensity to vote for the candidate, and e is the logistically distributed error. FC and DC are dummy variables indicating that the respondent was shown a fair or a dark candidate respectively (the wheatish candidate is the excluded category), and x is a vector of respondent characteristics. These characteristics include dummies capturing the respondent's caste (Other Backward Castes are the excluded category), class (middle class is the excluded category), complexion (wheatish is the excluded category), sex, and literacy status, as well as age. When β FC is positive and statistically significant, this indicates a preference for a fair over a wheatish candidate.Footnote 28 Similarly, β DC < 0 indicates a preference for a wheatish over a dark candidate. A preference for fair over dark candidates is indicated by β FC − β DC > 0, which we test post-estimation using the delta method. Colorism (Hypothesis 1) predicts three statistically significant pairwise comparisons β FC > 0, β DC < 0, and β FC − β DC > 0 in any given subgroup of respondents.
Our descriptive representation and mobilization hypotheses concern differences in preferences across subgroups of respondents. We examine them by running regressions with interactions of the form:
 $$Z = {{\rm \beta} _0} + \left( {{{\rm \beta} _{FC}} + {{\rm \delta} _{FC}}{\,\ast\,}{D_G}} \right)FC + \left( {{{\rm \beta} _{DC}} + {{\rm \delta} _{DC}}{\,\ast\,}{D_G}} \right)DC + {\bf \gamma} ^{\prime}{\bf x} + e;$$
where D G is a dummy variable indicating that the respondent belongs to some group (G) hypothesized to have different color preferences. When this group consists of voters who are Dalit, poor, or dark skinned, descriptive representation (Hypothesis 2) predicts that δ DC > 0 and δ FCR − δ DCR < 0: respondents belonging to darker groups have stronger preferences for (or weaker biases against) dark relative to wheatish or fair candidates respectively, than do respondents who do not belong to darker groups. Similarly, mobilization (Hypothesis 3) predicts that δ DC > 0 and δ FCR − δ DCR < 0 when this group consists of voters who are Dalit or of voters who are poor.
Table 1 presents the coefficients from three regressions estimated on the full sample. The first is the baseline model (Specification 1), which tests for colorism in the aggregate. The second and third are interaction models (Specification 2) which we introduce to test the descriptive representation and mobilization hypotheses. In addition to testing the significance of the differences between groups in color preference of respondents using these interaction models, we also examine the significance of color preferences within groups by running the baseline model on subsamples of respondents from particular groups. To reveal the magnitude of color preference, we present not just the logit coefficients, but also the marginal effects of candidate skin tone. Specifically, Table 2 presents the differences in the probabilities that a respondent with average characteristics for the subgroup would vote for candidates of different skin colors (columns 3–5). To provide a sense of the relative electoral advantage conferred by these marginal effects, Table 2 also provides the fraction of respondents in each subgroup willing to support whichever candidate they were shown (column 2). The marginal effects in the top row of Table 2 are calculated post-estimation from regression 1 in Table 1. The remaining marginal effects in Table 2 come from analogous regressions run on subsamples of respondents, whose coefficients are not displayed in the interest of brevity.
Table 1. Logit regression estimates (full sample)

Note: Dependent variable is the respondent's willingness to vote for the candidate. ***p < .01, **p < .05, *p < .1. First regression follows Specification (1). Second and third regressions follow Specification (2).
Table 2. Differences in approval rates by candidate skin tone pairs (marginal effects)
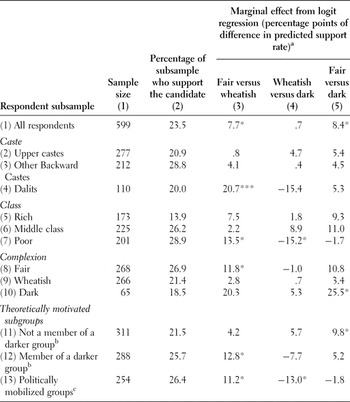
Note: Dependent variable is the respondent's willingness to vote for the candidate. ***p < .01, **p < .05, *p < .1.
a The marginal effects in each row are calculated following a logit regression of Specification (1), but using the indicated subsample. Where the subsample all belongs to one caste, class, or complexion group, the unidentifiable dummy variables are dropped.
b A respondent is a member of a darker group if they are Dalit, poor, or dark-skinned.
c A respondent is a member of a politically mobilized group if they are Dalit or poor.
Our full sample, baseline regression (Table 1, first regression) indicates a marginally significant preference for fair over wheatish candidates in the sample as a whole (β FC > 0), but no preference between wheatish and dark candidates. There is also a marginally significant preference (not shown) for fair over dark candidates (β FC − β DC > 0). These coefficients translate into substantial marginal effects, with fair candidates enjoying roughly an 8 percentage-point higher support rate than wheatish or dark candidates (Table 2, top row, columns 3 and 5). Given that 23.5% of the candidates in the full sample are supported (Table 2, top row, column 1), this indicates that support for the fair candidate is roughly one-third higher than support for the other candidates. This suggests, consistent with colorism (Hypothesis 1), that fair skin tone can be a major electoral advantage. This preference for fair candidates appears to be fairly ubiquitous, though not always statistically significant: at a point estimate, the fair candidate is preferred to the dark candidate in every subsample save for among the poor, and to the wheatish candidate in every subsample (Table 2, rows 2–10).
Nevertheless, the results are not fully consistent with strict colorism (Hypothesis 1). Specifically, contrary to the predictions of colorism, there is no significant preference for wheatish over dark candidates in the full sample (Table 1, regression 1; Table 2, row 1) or in any subsample (Table 2, rows 2–10). Interestingly, this is at variance with the significant evidence of preference for wheatish over dark skin tone in other social contexts such as marriage.
The marginal effects in rows 2–10 of Table 2 suggest that this exception to colorism occurs because preferences for wheatish over dark candidates are heterogeneous across social groups, and where they are significant, actually favor the dark candidate. For example, among Dalit and poor respondents the dark candidate receives support rates over 15 percentage points higher than the wheatish candidate.Footnote 29 Given overall support rates in these two groups of 20% and 28.9%, this implies that wheatish complexion carries a substantial penalty in these two groups. Conversely, upper caste and middle class respondents display statistically insignificant, but noticeable preferences for wheatish over dark candidates.
The results so far establish a fairly ubiquitous preference for fair candidates, but heterogeneous rankings of the wheatish over the dark candidate across social groups. This motivates us to more carefully examine differences in color preferences between respondent groups to see whether they are consistent with expectations if descriptive representation (Hypothesis 2) and mobilization (Hypothesis 3) are important. As we argued earlier, descriptive representation could influence skin color preference amongst Dalit and poor voters, if these groups are darker skinned. Table 3 confirms that they are. It shows that, in the first-order stochastic dominance sense, Dalit respondents are darker than non-Dalit respondents, and poor respondents are darker than non-poor respondents. Thus, in addition to dark respondents, we consider poor and Dalit respondents to be members of “darker groups.”
Table 3. The darker groups
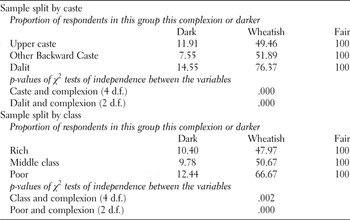
Note: Analysis of the distribution of caste, class, and complexion in the full sample of 599 respondents.
To see whether descriptive representation can help to make sense of respondents’ preference orderings, the second regression in Table 1 tests the significance of differences in color preference between respondents who are poor, Dalit, or dark-skinned, and those who are neither. While none of these differences in color preference are statistically significant, rows 11 and 12 of Table 2 suggest differences in color preference between respondents who do and do not belong to those darker groups. The results among respondents who do not belong to this darker group are all consistent (at a point estimate) with strict colorism, with the fair candidate significantly preferred to the dark one. Conversely, those in the darker groups prefer the fair to the wheatish candidate, but (at a point estimate) prefer the dark over the wheatish candidate. These results are consistent with darker groups preferring descriptive representation. Together with the statistical insignificance of differences in color preference between groups, this suggests some, muted role for descriptive representation.
Finally, we cut the data in two ways to see whether the effects of descriptive representation on color preferences are limited to politically mobilized categories (Hypothesis 3). This could account for the mixed evidence on Hypothesis 2. First, in the final row of Table 2, we look at color preference among the politically mobilized (poor or Dalit) respondents and find significant preferences for the fair and dark candidates over the wheatish candidate. Second, the third regression in Table 1 uses an interaction model that allows treatment effects to vary depending upon whether the respondent is Dalit, poor, or dark (or some combination of the three). This allows us to test for color preferences in the eight non-overlapping sub-samples provided in Table 4.Footnote 30 We note, from the interaction term coefficients in Table 1, that the Dalit respondents have significantly stronger preferences for the fair and dark candidates over the wheatish candidate than do otherwise identical but non-Dalit respondents. Similarly, using the delta method and these same coefficients, we find that poor respondents have significantly (p = .090) less preference for fair over dark candidates than non-poor candidates (δ FCR − δ DCR = −0.107 − 0.745 < 0). Thus, preference for dark candidates is stronger amongst respondents belonging to the politically mobilized groups—Dalits and the poor. In contrast, being dark, if anything, reduces preference for dark over fair or wheatish candidates (δ FCR − δ DCR > 0, but is insignificant).
Table 4. Color preference within well-defined subgroups

Note: Dependent variable is the respondent's willingness to vote for the candidate. ***p < .01, **p < .05, *p < .1. Differences in latent propensity (Z) are calculated post-estimation from the third regression in Table 1, which uses Specification (2).
Table 4 provides post-estimation tests of color preferences within our eight sub-samples based on this same regression. For analytical simplicity, it presents preferences using combinations of coefficients, rather than marginal effects. The table provides further indications that color preferences depend significantly on whether the respondent is Dalit and/or poor. Specifically, preference for the fair over the dark candidate is limited to respondents who are neither Dalit nor poor. Even dark respondents who are not Dalit or poor prefer the fair to the dark candidate. Dalit respondents prefer the fair to the wheatish candidate, regardless of whether they are poor or dark. The only group to discriminate between the wheatish and dark candidates is those who are both Dalit and poor (but not dark). This group prefers the dark candidate to the wheatish one. All of the above suggest that absent mobilization on the basis of skin color, being dark is not enough to produce the impulse for descriptive representation and overcome colorism.Footnote 31 There is therefore support for Hypothesis 2 only among the politically mobilized categories, which confirms Hypothesis 3.
DISCUSSION AND IMPLICATIONS
Our survey experiment shows that evidence for colorism, a general preference for fairer skin over darker skin, is weak in electoral politics in India. This is despite fair skin tone being venerated and dark complexion stigmatized in many aspects of private and public life, including marriage, religion, cinema, and television.
We find that there is weak support for colorism in electoral politics in India not because people do not discriminate based upon skin tone in electoral contexts, but because skin color preferences are heterogeneous. To be sure, there is substantial support for candidates of fair skin tone across all subsets within our sample. But this expected preference is matched, at least among some groups, by relatively strong support for candidates with dark complexion. This unexpected support for dark-skinned candidates comes from groups that have been marginalized within Indian society, namely Dalits and the poor. When we look at individuals who fit into both of these categories, Dalits who are poor themselves, we find this effect to be particularly pronounced. Indeed, among this subset of our sample, dark skin tone is preferred to wheatish skin color in electoral contexts. Our findings have important implications.
But first, what accounts for the seemingly bimodal support pattern we see among Dalits and the poor? While our main hypothesis, driven by colorism, predicts a preference for fair skin tone over both wheatish and dark complexions, our two alternative hypotheses, both motivated by descriptive representation theory, do allow for heterogeneity of skin color preferences. Even within a subgroup like the poor, colorism might drive some individuals to choose a fair candidate, while others who have been mobilized along class lines might see dark skin tone as a class cue and support a dark candidate. The latter behavior could reflect respondents’ desire to have their economic needs represented by someone who they perceive to be similar to them. Taken together, our results suggest that the impulse to prefer fair skin tone can coexist with a desire to seek descriptive representation from a candidate with dark skin color.
Our work suggests that political mobilization can be important in the process of making skin color politically salient. Among darker groups, only those that have been politically mobilized express similar support for dark and fair candidates. Individuals with dark complexion alone, an identity that has not been politically mobilized in India, express preferences that are consistent with colorism. It is most interesting that Dalits and the poor appear to treat dark skin color as an implicit marker for caste and socioeconomic status even though these groups are not mobilized through the use of overt skin-color-based appeals. This behavior is explicable, however, as our data also indicate that members of these groups are darker, on average, than their counterparts from higher caste and socioeconomic backgrounds. Thus, if they desire descriptive representation and have little means by which to determine which candidate is most “like them” then expressing a preference for dark skin color is one way to proceed.
This desire for descriptive representation among Dalits and the poor is likely rooted in both their recognition by the state and their mobilization by political parties as Dalits and as poor citizens. Skin color then becomes salient for these groups because it is connected to their politically mobilized identities. Dark complexioned voters who share the same skin color with the dark candidate, by contrast, show little support for him. Their inability to identify with the dark candidate is rooted in the fact that skin color on its own does not constitute a political identity; it is neither recognized by the state, nor mobilized by political parties, despite the discrimination that many dark-complexioned individuals face in India on a regular basis.
It follows from the heterogeneity of preferences described above, that fair candidates enjoy a skin-color-related advantage, while dark skin tone is not a disadvantage for a candidate running in a constituency that has either a large Dalit or poor population. Both in Delhi and in India, Dalits and the poor form a substantial portion of the electorate. In a democratic context where numbers matter and where the poor turn out to vote, support for dark candidates among the poor is not a trivial finding. It suggests that dark skinned candidates can get elected to office despite the evidence of colorism we find among certain subsets of the population. Our analysis of the Delhi state legislature and national parliament confirms that there are a substantial number of dark-complexioned candidates in elected office in India.
This descriptive development is not purely symbolic. We believe it also has a substantive implication. We think that the election of dark politicians to office associates dark skin color with power and prestige, and as a result, gradually, it may reduce the longstanding stigma associated with dark skin tone. Social science research has begun to point to similar political-office-related effects for Dalits, another group trapped in a historically stigmatized identity (Chauchard Reference Chauchard2014; Hardtmann Reference Hardtmann2009).
Finally, we note that this is an exploratory study, the first of its kind in India. Our goal was to probe the degree to which candidate skin color influences voter choices in a non-racial society. Our results therefore highlight important questions for future research. In particular, we note the substantial overlap between caste, socioeconomic status, and skin color categories. Future studies will require larger samples to determine more conclusively which of these collinear factors drive voter preferences. We are also left wondering whether the bias against Dalit candidates that numerous scholars have highlighted is driven by caste alone, or whether the fact that Dalits, on average, have darker skin color than upper caste individuals also contributes to it. Finally, we wonder about the degree to which our results travel. Does the bias in favor of fair skin manifest similarly or differently in rural and urban areas, in North and South India, and for male and female candidates? We are currently gathering data that should allow us to address some of these questions in future publications.
Acknowledgments
For helpful feedback we want to thank Pradeep Chhibber, Heather Stoll, Jane Menon, Stephen Weatherford, Mark Buntaine, Jennifer Bussell, Paige Digeser, John Woolley, Kate Bruhn, Prem Ahuja, Rahul Verma, Adnan Naseemullah, Geoff Allen, Rhoanne Esteban, Hareem Khan, members of the Research Focus Group on Identity at UC Santa Barbara and the South Asia Workshop at UC Berkeley, and three anonymous reviewers. Sharon Ostermann, Ayesha Malik, Hamza Mannan, and Cindy Liang provided valuable research assistance.
APPENDIX
Table A1. Are respondent characteristics balanced across treatments?


