


Introduction
Fasciolosis is a prevalent parasitic and foodborne zoonotic disease infecting several mammalian species, particularly grazing animals, worldwide. At least 90 million people are at risk of infection, and between 2.4 and 17 million individuals are believed to be infected (Keiser and Utzinger, Reference Keiser and Utzinger2009; Cwiklinski et al., Reference Cwiklinski2016). Fasciola hepatica resurgence has been linked to climate change affecting the prevalence, intensity and spatial distribution of the liver fluke, and influencing the free-living larval stages and population dynamics of the snails that are its intermediate hosts (Villa-Mancera et al., Reference Villa-Mancera2015; Charlier et al., Reference Charlier2016). Economic losses due to fasciolosis are estimated to amount to > 3 billion US dollars annually (Spithill et al., Reference Spithill1999; Cwiklinski et al., Reference Cwiklinski2016). Infected animals show reduced milk production, weight gain and fertility, as well as liver condemnation at slaughter (Torgerson and Claxton, Reference Torgerson and Claxton1999; Kaplan, Reference Kaplan2001; Schweizer et al., Reference Schweizer2005; Sanchez-Vazquez and Lewis, Reference Sanchez-Vazquez and Lewis2013).
It is important to diagnose the infection rapidly, early and accurately when studying the epidemiology, surveillance and control of the disease. Detection of F. hepatica-specific antibodies by enzyme-linked immunosorbent assay (ELISA) in bulk tank milk (BTM) samples is the most sensitive and inexpensive method of monitoring and establishing infection status in dairy herd health management programmes (Sekiya et al., Reference Sekiya, Zintl and Doherty2013; Charlier et al., Reference Charlier2014). BTM ELISA at the herd level has detected high prevalences in the UK (53.3 and 75.7%), Austria (58.1–61.3%), and Germany (50.5%) (Pritchard et al., Reference Pritchard2005; McCann et al., Reference McCann, Baylis and Williams2010b; Duscher et al., Reference Duscher2011; Kuerpick et al., Reference Kuerpick2012). Studies in Belgium (Bennema et al., Reference Bennema2009, Reference Bennema2011) report overall herd-level prevalences of 37.3% and 39.3%. In Sweden, infected dairy herd prevalence was 7.6% on organic farms, compared with 6.7% in conventional herds (Höglund et al., Reference Höglund2010).
Studies using geographical information systems (GIS) and remote sensing technologies, often combined with spatial statistics, have been useful for infection risk mapping and predictive modelling of F. hepatica worldwide (reviewed by Charlier et al., Reference Charlier2014). However, no previous studies have been performed on BTM sample prevalence and risk factors of liver fluke infection in dairy herds in Mexico. This study evaluated parasite prevalence and spatial distribution in Mexican dairy herds by detecting anti-F. hepatica IgG1 antibodies in BTM samples, and determined the importance of climatic, environmental and management factors in the spatial distribution of significant F. hepatica infections.
Materials and methods
Study area
The study was conducted in three Mexican states: Puebla (eastern-central Mexico, 33,919 km2), Hidalgo (eastern-central Mexico, 20,987 km2) and Veracruz (eastern Mexico, 71,826 km2) (fig. 1). Mexico's climate is diverse, and the temperature and rainfall vary greatly throughout the country. States belong to different climate groups, predominantly tropical wet (Puebla, Veracruz, Hidalgo), tropical wet-and-dry (Puebla, Veracruz), temperate with dry winters (Puebla, Hidalgo), and semi-arid (Puebla, Hidalgo). The climate is dominated by the summer rainy season from June to September/October, with a mean annual temperature range of 16–23°C and an annual precipitation range of 800–1,500 mm.
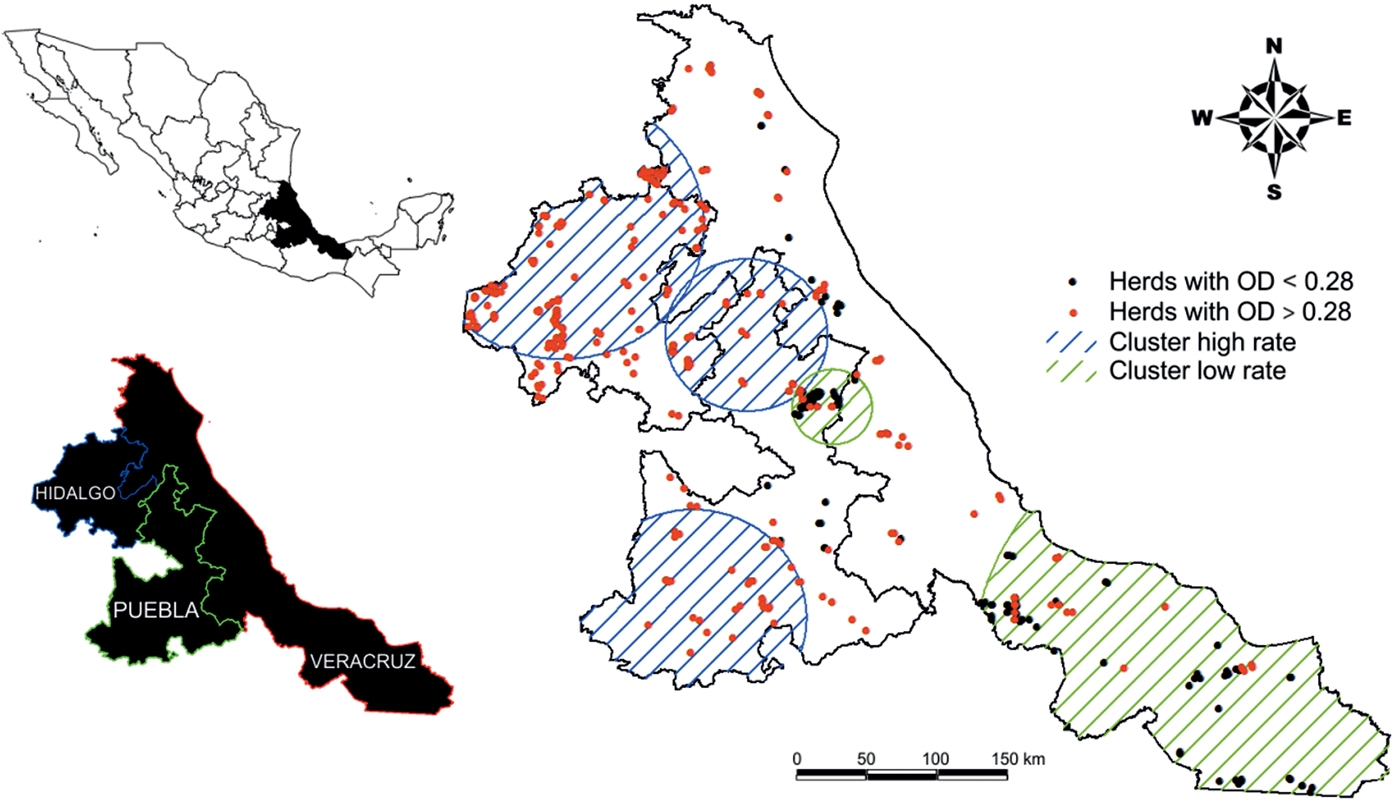
Fig. 1. Distribution of BTM ELISA for Fasciola hepatica-positive (red dots) and negative (black dots) dairy herds, and location of significant spatial clusters of high and low infection prevalence (ODR > 0.28) on Mexican milk farms detected using scan statistics implemented in SatScan.
Milk samples and management
Farms were selected by convenience based on willingness of owners to participate. A total of 717 BTM samples were collected from Hidalgo (n = 336), Puebla (n = 154) and Veracruz (n = 227) and transported to the laboratory of Agricultural Biotechnology and Molecular Biology, Meritorious Autonomous University of Puebla. All milk samples obtained between 1 January 2015 and 30 April 2015 were centrifuged at 2000 g for 15 minutes at 4°C, the fat was skimmed off, and the supernatant was stored at −20°C until analysis. All participating dairy producers completed a questionnaire that was part of a previous study developed by our group (Villa-Mancera et al., Reference Villa-Mancera2018), which included specific questions about general farm management, grazing and possible risk factors that might influence the level of parasite exposure. Milk production data from the participating herds were unavailable for this study.
Remotely sensed climatic data
Rainfall data were extracted from the 3B43 monthly precipitation product of the Tropical Rainfall Measuring Mission satellite (http://disc2.gesdisc.eosdis.nasa.gov) with a spatial resolution of 0.25° × 0.25°. Remotely sensed climatic data were recorded as monthly means for 12 months before the day of milk collection for each examined farm. Each farm's latitude and longitude were identified using a global positioning system (GPS, Garmin eTrex Vista), and their geographical positions were plotted using ArcGIS 10.1 (ESRI, Redlands, CA, USA). The farm's elevation data were obtained from the Digital Elevation Model Shuttle Radar Topography Mission (SRTM) dataset for Mexico with a resolution of 1 km (http://srtm.csi.cgiar.org/). The remotely sensed datasets used in the analyses were obtained from the Moderate Resolution Imaging Spectroradiometer (MODIS) sensor aboard the Terra satellite (https://lpdaac.usgs.gov/), products MOD11C3 and MOD13C2.005, with 0.05° spatial resolution for the land surface temperature (LST), and a monthly average normalized difference vegetation index (NDVI). LST data were used as a proxy for day and night temperatures, and NDVI was used as a proxy for soil moisture (Sandholt et al., Reference Sandholt, Rasmussen and Andersen2002).
Positive and negative controls to validate BTM IgG1 ELISA
Both positive and negative BTM samples were analysed using an ELISA kit (DRG International Inc, USA) according to the manufacturer's protocol to detect antibodies against excretion/secretion (E/S) parasitic products. Presence of Fasciola hepatica eggs in the faecal samples was determined using the sedimentation technique.
Adult F. hepatica E/S products
Mature adult flukes were removed from the bile ducts of infected cattle livers at the local abattoir and incubated for 16 h at 37°C in RPMI-1640 supplemented with penicillin (100 IU/ml) and streptomycin (100 μg/ml). The supernatant was removed and centrifuged at 14,000 g for 30 minutes at 4°C. E/S products were collected and concentrated through 10 kDa cut-off membrane Amicon Ultra-15 centrifugal filter tubes (Millipore, USA) and stored at −80°C until use.
Anti-F. hepatica IgG1 antibody detection in BTM samples by ELISA
ELISA was performed as previously reported (Villa-Mancera et al., Reference Villa-Mancera2016) with minor modifications and optimized by checkerboard titration to determine the optimal concentrations of antigen, milk dilution and antiglobulin enzyme conjugate. Microtiter plate wells (Costar, Corning, NY, USA) were coated with 10 μg/ml of E/S product in 100 μl of phosphate-buffered saline (PBS) overnight at 4°C. After four washes with PBS-Tween 20, the excess binding sites were blocked for 1 h at 37°C with 200 μl containing 1% bovine serum albumin (BSA). Positive and negative controls and milk samples (100 μl) were tested undiluted in PBS and incubated at 37°C for 1 h. Horseradish peroxidase-conjugated sheep anti-bovine IgG1 isotype (1 : 5000, Abcam, cat. no. ab112754; USA) was used as the secondary antibody at a 1 : 5000 dilution in PBS–BSA 1% for 1 h at room temperature. Following incubation, plates were washed five times with PBS-T. The reaction was developed by adding 100 μl per well of TMB substrate (Sigma, USA). The enzyme–substrate reaction was stopped by adding 50 μl of 2 N H2SO4. Absorbance values were measured at 450 nm using an ELISA reader (Biotek ELx800). All BTM samples, negative and positive controls were tested in triplicate on each plate. The antibody levels were expressed as an optical density ratio (ODR) using the following formula: (OD test sample)/(OD positive control) × 100. The cut-off value for positive infection status in ELISA tests evaluated by the receiver operating characteristic (ROC) curve was defined at 0.28. The diagnostic sensitivity and specificity of the milk ELISA were 97.5% and 99.8%, respectively (Fletcher et al., Reference Fletcher, Fletcher and Fletcher2012).
Spatial cluster analysis
The spatial scan statistic implemented in the software program SaTScan (version 9.4.4, www.satscan.org) uses a circular window of variable radius that moves across the map to represent potential geographical infection clusters. The scan statistic is based on the likelihood ratio test for which the window with the maximum likelihood is the most likely cluster (Kulldorff and Nagarwalla, Reference Kulldorff and Nagarwalla1995). Positive samples were considered as infected cases, and negative samples served as controls. Clusters were detected using the Bernoulli probability model (purely spatial) using the maximum cluster size of 50% of the total parasite infection population (Kulldorff and Nagarwalla, Reference Kulldorff and Nagarwalla1995; Kulldorff et al., Reference Kulldorff1997). Clusters are assessed by comparing the observed number of positive samples to the expected number of positive samples under the hypothesis of random distribution in space (Kulldorff et al., Reference Kulldorff1997). Cluster significance was tested using the Monte Carlo hypothesis (999 simulations).
Statistical analysis
Logistic regression was used to determine the extent to which the management and/or climatic/environmental variables influenced the prevalence of F. hepatica infection estimates. Risk factors were treated as independent variables and parasite infection as the dependent variable. Three models were built from a dataset containing the data from all states, by forward stepwise selection method regression with a nominal significance level of α = 0.05 and 0.10 for the entry and removal of a variable, respectively. The first model included only climatic/environmental variables, the second model contained management variables, and the third model included both management and climatic/environmental variables. Odds ratios were reported with 95% CI. Goodness of fit was evaluated with Akaike's information criterion (AIC) and McFadden pseudo-R square. Statistical analysis was performed using the IBM SPSS 20 software package (SPSS Inc., Chicago, USA) for Windows.
Risk map construction
The risk map was constructed based on the model with the most useful statistical information (model 3). Geostatistical kriging interpolates the spatial correlation between the measured values of a spatial random variable to estimate a value for an unsampled location. A spatially continuous risk map was produced using the ordinary kriging function in the ArcGIS 10.1 Spatial Analyst toolbox (ESRI, Redlands, CA, USA) to define the epidemiological risk factors of fasciolosis.
Results
Fasciola hepatica infection prevalence and spatial distribution
BTM samples were collected from 717 herds. All samples were analysed for anti-F. hepatica IgG1 antibodies. The overall prevalence of fasciolosis in the three Mexican states was 62.76% (450/717). The highest prevalence was detected in 292 of 336 samples (Hidalgo, 86.90%), and the lowest prevalence was observed in 91 of 227 samples (Veracruz, 40.09%). A summary of anti-F. hepatica ODR values from the BTM samples is presented in table 1. A state map illustrating the spatial distribution of the Mexican cattle herds and the F. hepatica-positive (red dots) and negative (black dots) herds is shown in fig. 1.
Table 1. Prevalence of F. hepatica infection in cattle herds in Mexico, by BTM IgG1 ELISA (n = 717).
BTM, bulk tank milk; ODR, optical density ratio; CI, confidence interval
Spatial cluster analysis
The circular scan statistic revealed five significant (P = 0.001) clusters for F. hepatica (fig. 1). Cluster 1 (positive), a large, high-infection cluster in Hidalgo, contained 149 herds with a higher relative risk of 1.89. Cluster 2 (positive), located in a large area of Puebla, contained 31 herds with a higher relative risk of 1.64. Cluster 3 (positive), situated in north Puebla, east Hidalgo and central Veracruz, contained 147 herds with a lower relative risk of 1.34. Cluster 4 (negative), located in southern Veracruz, contained 25 herds with a lower relative risk of 0.24. Cluster 5 (negative), situated in north-east Puebla and central Veracruz, contained 10 herds with a lower relative risk of 0.16.
Logistic regression models
All statistical analysis results and risk factors as determined by BTM ELISA are presented in table 2. After screening all variables, in the climatic/environmental model (model 1) the variables for rainfall, elevation and NDVI were significant risk factors. Rainfall, LST, day and NDVI were negatively associated with F. hepatica infection. The risk factors included in the management model (model 2) were grass in diet, contact with other herds, herd size, parasite control use and farmers’ education level. When management and climatic/environmental factors were tested together (model 3), only two climatic/environmental variables, rainfall and elevation, were significant positive predictors. Five variables were associated with management characteristics: proportion of grazed grass in the diet, contact with other herds, herd size, parasite control use and education level. The final value of McFadden pseudo-R square in model 3 was 0.853, indicating a very good fit (AIC = 419.911; P < 0.001).
Table 2. Multivariate logistic regression (LR) models of climatic, environmental and management factors associated with presence/absence of F. hepatica infection measured by bulk tank milk IgG1.
LST, land surface temperature; NDVI, normalized difference vegetation index.
*Wald: 2.883; AIC: 648.909; McFadden 0.660.
** Wald: 0.021; AIC: 525.121; McFadden 0.432.
*** Wald: 3.728; AIC: 419.911; McFadden 0.853.
Prediction model development for F. hepatica distribution
The ODR coefficients for the BTM samples were used to produce a disease risk map based on model 3 (fig. 2). Large areas of high infection risk (17.63% to > 49.75%) were predicted for north Veracruz and Hidalgo. Low-risk areas with predicted infection risks < 1% were primarily located in central Puebla and Veracruz.
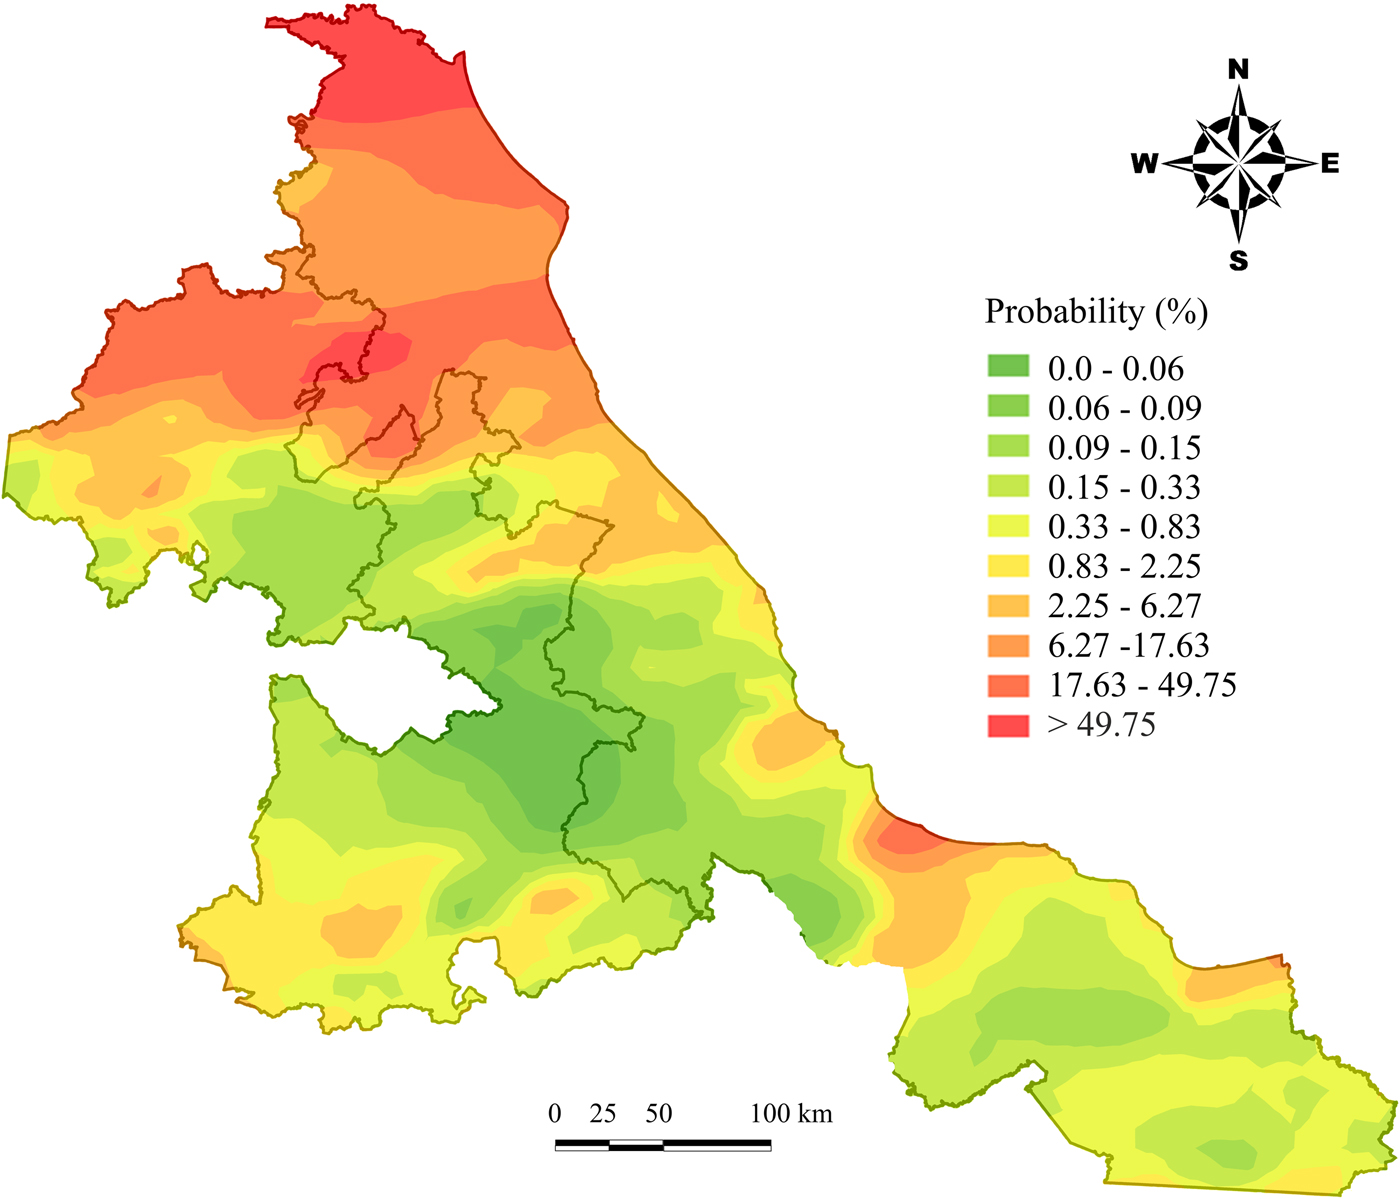
Fig. 2. Fasciola hepatica probability map (based on model 3) prepared by the kriging spatial interpolation method in Mexican cattle herds.
Discussion
This study was the first to investigate F. hepatica prevalence and spatial distribution in dairy cattle herds in Mexico using BTM ELISA, while simultaneously providing information on geographical and epidemiological risk factors for the parasitosis.
The overall estimated prevalence of F. hepatica in Mexican dairy herds in the states of Hidalgo, Veracruz and Puebla was 62.76%. High prevalence rates in cattle have been reported in north-west Mexico using indirect ELISA and sedimentation tests (24.4% and 11.4%) (Munguía-Xóchihua et al., Reference Munguía-Xóchihua2007). Additionally, several European studies indicated a wide prevalence range (6.7–75.7%) using BTM ELISA (Sekiya et al., Reference Sekiya, Zintl and Doherty2013). After identifying several clusters, we found an association between the high relative risk in Hidalgo (1.89) and Puebla (1.64) and a high prevalence (86.90% and 43.51%, respectively) of parasite infection.
Natural infection with F. hepatica metacercariae induced development of a strong, non-protective Th2 cell-like response to produce higher levels of IgG1 than IgG2 (Dalton et al., Reference Dalton2013). In this trial, the diagnostic sensitivity and specificity of fluke E/S products recognized by anti-F. hepatica IgG1 antibodies in a milk ELISA were 97.5% and 99.8%, respectively. The reported sensitivity and specificity values for detecting anti-F. hepatica total IgG in BTM samples are 90% and 100% (Salimi-Bejestani et al., Reference Salimi-Bejestani2005).
To determine risk factors associated with F. hepatica infection, logistic regression was used to examine different variables for statistically significant associations with BTM ODR to predict the parasite's spatial distribution. The final model of the multivariate analysis included seven predictors: rainfall, elevation, proportion of grazed grass in the diet, contact with other herds, herd size, parasite control use and farmer education level (table 2). More management variables were significantly associated with BTM F. hepatica antibodies. Bennema et al. (Reference Bennema2011) proposed four specific factors, only two of which were significant predictors in our study (proportion of grazed grass in the diet, and herd size).
Factors including rainfall and elevation were the most significant for fasciolosis risk. Bennema et al. (Reference Bennema2011) reported that annual rainfall is a positive predictor of infection in Belgium, and McCann et al. (Reference McCann, Baylis and Williams2010a, Reference McCann, Baylis and Williamsb) found the same for dairy herds in England and Wales. An analysis by Qin et al. (Reference Qin2016) similarly reported that temperature, rainfall and elevation were associated with F. hepatica infestation in China. Climate conditions impact the development and distribution of the parasite's intermediate molluscan and free-living stages. In Mexico, Lymnaea humilis and Lymnaea bulimoides snails appear during or immediately after rainfall peaks (Cruz-Mendoza et al., Reference Cruz-Mendoza2011). In contrast to what is generally accepted (McCann et al., Reference McCann, Baylis and Williams2010b; Fox et al., Reference Fox2011), temperature was not a significant predictor in this study. This observation is consistent with previous reports, in which no significant differences were found between prevalence and ambient temperatures in Brazil (Dutra et al., Reference Dutra2010). Kantzoura et al. (Reference Kantzoura2011) found NDVI was the most significant environmental factor; however, in this study, NDVI was removed from the final model. In Belgium, soil type and elevation were not relevant predictors of F. hepatica (Bennema et al., Reference Bennema2011). Few studies have reported a significant relationship between elevation and parasite infection risk (Dutra et al., Reference Dutra2010; Martins et al., Reference Martins2012). Likewise, active infections of F. gigantica in cattle are common in lower altitude settings, but this prevalence decreases as the elevation increases (Howell et al., Reference Howell2012). Furthermore, survival of the intermediate host may be associated with adverse factors such as high rates of moisture evaporation from the soil, low temperatures and more mountainous terrain with fewer fresh water bodies (Mas-Coma et al., Reference Mas-Coma, Funatsu and Bargues2001).
Based on our results, herd size and the proportion of grazed grass in the diet were statistically significant risk factors for parasite exposure. Consistent with our results, Bennema et al. (Reference Bennema2011), who found that the proportion of grazed grass is directly linked to metacercariae exposure, also observed that a medium-sized herd has more risk of infection than a larger herd. Additionally, large herds were more likely to receive flukicides than small and medium-sized herds (Munita et al., Reference Munita2016). In Greece, anthelmintic treatment and farmer education level were positively associated with infection risk (Kantzoura et al., Reference Kantzoura2011), and our results were consistent with that report. Moreover, the issues of parasite control programmes, biological factors that influence control recommendations, diagnosis of F. hepatica infections, effective control assessment, use of ineffective anthelmintics, resistance status, nutrition, plant extracts, rotational resting and grazing depend on local or regional problems. Thus, there is a need for advisory services and technical consulting to promote new strategies and technologies, as well as to ensure on-farm availability of information and training materials adapted to farmers’ educational levels (Kenyon et al., Reference Kenyon2017).
The 5th Assessment Report of the Intergovernmental Panel on Climate Change predicted that the global mean surface temperature change for the period 2016–2035 relative to 1986–2005 will probably range from 0.3°C to 0.7°C (Pachauri et al., Reference Pachauri2014). There is likely to be more land with increased heavy precipitation events than those with decreased events. These changes directly affect the development and mortality of both the free-living stages and intermediate hosts as well as altering farm management practices. Additionally, global climate change may alter the epidemiology, seasonality and geographical distribution of F. hepatica infections (Charlier et al., Reference Charlier2014).
In conclusion, this study indicated that F. hepatica prevalence was high on dairy cattle farms in Mexico. The spatial distribution map revealed three high-risk clusters, located in west and north Puebla and Hidalgo. This study demonstrated that management factors play major roles in F. hepatica prevalence in cattle herds. A spatially continuous risk map was developed based on the associations of infection presence measured by IgG1 ELISA with these management variables, which may be useful for providing possible control strategies and preventive measures in Mexican cattle herds.
Acknowledgements
The authors are grateful to Jesús Valle Juárez for providing excellent technical assistance. This study was supported by Benemérita Universidad Autónoma de Puebla (VIEP-VIMA-NAT-18-I).
Conflict of interest
None.
Ethical standards
This study was approved by the Animal Care and Ethics Committee of Meritorious Autonomous University of Puebla and all procedures complied with National Legislation Pertaining to Animal Health Research.


