Introduction
The placenta is a vital organ which regulates fetal growth and development in utero. Placental growth deficits lead to inadequate weight gain in the fetus, resulting in intrauterine growth restriction (IUGR) or small for gestational age (SGA) babies. IUGR denotes a pathological process, where the fetus fails to achieve its biologically determined growth potential and is truly growth restricted.Reference Figueras and Gratacós 1 On the other hand, SGA denotes the lower end of normal growth range without any obvious pathology and is usually associated with mostly normal perinatal outcomes.Reference Figueras and Gratacós 1 Babies with IUGR and/or SGA are known to have an increased predisposition to metabolic disorders in adult life [fetal origins of adult diseases (FOAD)], as originally proposed by Barker et al.Reference Barker 2
Adequate placental development as an absolute prerequisite for fetal growth is demonstrated by the significant correlation observed between placental and fetal weights for IUGR as well as SGA babies. However, variation in birth weights for a given placental weight is also well recognised. Placental surface area could potentially be an additional variable in such situations. The surface area of the placenta determines the nutrient transport and oxygen diffusion which is critical for normal fetal development.Reference Sankaran and Kyle 3 The placental surface area in turn depends on the shape of the placenta. Traditionally, the shape of the chorionic plate is described as ‘round’ with the cord inserted in the centre. Nonetheless, several non-conformities to this idealised shape and paracentric cord insertions have been documented.Reference Pathak, Hook and Hackett 4
IUGR and SGA are closely related, although the underlying pathogenetic mechanisms are believed to be different. The clinical severity of postnatal complications is greater in IUGR. While placental insufficiency with demonstrable histopathological changes, is the major causative factor for IUGR (80–90% cases)Reference Tamblyn and Morris 5 the role of placental insufficiency in the causation of SGA is not clear. Placental insufficiency has not been cited as a major or minor risk factor for SGA in the recently updated Royal College of Obstetricians and Gynaecologist guidelines. 6 In addition, light microscopic histopathological examination of the placenta from a SGA baby may or may not reveal significant pathology. It is therefore reasonable to examine gross placental features such as shape and cord insertion in SGA v. AGA babies, to understand their contribution if any to these outcomes.
Studies on FOAD have established the presence of a relationship between low birth weight and chronic diseases of adulthood.Reference De Boo and Harding 7 This relationship is related to birth weight per se, and not restricted to low birth weight in the setting of complicated pregnancies. Therefore we reasoned that low birth weight encountered in the setting of clinically uncomplicated pregnancies might be secondary to alterations in the placental shape and cord insertion. We therefore intended to evaluate the effect of these morphological alterations on the placental efficiency and birth weight within a group of uncomplicated pregnancies. The present study was undertaken to examine the relationship between placental parameters and birth weight, with the following objectives: (1) to ascertain the effect of placental shape and eccentricity of cord insertion on placental efficiency and birth weight in uncomplicated pregnancies. (2) To assess the effect of these alterations in clinically distinct groups of SGA and AGA babies.
Material and methods
Placentae in this retrospective study were collected from uncomplicated singleton pregnancies. The pregnant women were recruited in the first trimester into the birth cohort of St. John’s Research Institute and the Departments of Obstetrics and Gynaecology, and Pathology, St. John’s Medical College and Hospital, Bangalore, India and were followed up until delivery. The birth cohort as described previously,Reference Dwarkanath, Barzilay and Thomas 8 has recruited pregnant women to study the maternal determinants on fetal growth and placental histomorphology. Women with the following conditions were excluded: multiple pregnancies, other co-morbidities(e.g. diabetes mellitus, hypertension, heart disease, thyroid disease and epilepsy), and a positive test for hepatitis B surface antigen, HIV or syphilis. Routine antenatal tests were carried out to exclude obstetric complications indicating placental pathology such as preeclampsia or IUGR. Women who had SGA birth outcome were not excluded as these pregnancies did not have any obstetric complications or placental pathology as indicated by antenatal investigations. The study has been approved by the Institutional Ethics Committee (Ref no. 202/12) and informed written consent was obtained from all patients for examination of the placenta.
Upon delivery, the placentae were fixed in 10% neutral buffered formalin and anonymised on receipt in the Department of Pathology for histopathological examination. After 24 h of fixation, the morphological characteristics of the placentae were examined according to standard protocols.Reference Baergen 9 , Reference Kaplan, Lowell and Salafia 10 As routine practice high-resolution images of the placentae were recorded and archived. Digital photographs of the placenta of both the maternal surface and chorionic plate were taken using Canon EOS 600D (Lens-EF-S 18-135 IS) camera, at optimal optical resolution, and included a physical scale for calibration. The umbilical cord (UC) was trimmed at the insertion and extra placental membranes at the chorionic plate margin. All adherent blood clots from the maternal surface were removed and the placenta was weighed on an electronic scale.
The UC insertions were classified into the following categories: (a) central, when insertion was in the actual centre, (b) eccentric, when the insertion was away from the centre but >1 cm away from the placental margin, (c) marginal, when the insertion was <1 cm from the placental margin, (d) velamentous, when the insertion was into the membranes, (e) furcate, when the UC bifurcated before insertion. The effect of marginal/velamentous insertions on pregnancy outcome is well documented and centrally inserted cord is an ideal situation with good functional efficiency. Since the purpose of the study was to observe the effect of deviation of cord insertion from the centre on the pregnancy outcome, these insertion types were not considered for analysis. The digital images of the chorionic plate were analysed using Image J software (version1.48) downloaded from http://rsb.info.nih.gov/ij/. The calibration was done by measuring two points separated by a known distance on the ruler, which was converted to pixels by the software, and the subsequent measurements of the image in pixels were automatically converted into length in centimetres by the software. Calibration was repeated for each placenta before obtaining the set of measurements.
The following measurements were recorded from the digital images: (1) the longest diameter of the placenta along the X axis (A, placental length/major axis); (2) the longest diameter along the Y axis (B, placental breadth/minor axis). The placental length (major axis) and breadth (minor axis) were measured along the greatest/longest dimension in the respective axes. Though these axes are perpendicular to each other, the minor axis is not always at the midpoint of the major axis. These measurements on digital images were carried out to recapitulate the measurements done during morphological examination of the placenta as detailed in Amsterdam placental workshop group consensus statement.Reference Khong, Mooney and Ariel 11 (3) The longest measurement along the X axis passing through the UC insertion (C); (4) The longest measurement along the Y axis passing through the UC insertion (D). As a result C and D were perpendicular to each other, as were A and B. (5) The shortest distance from the UC insertion to placental margin along the X axis (e); (6) the shortest distance from the UC insertion to placental margin along the Y axis (d). The measurements are shown in the online Supplementary Figure S1.
The following parameters were derived from the above measurements:
1. The distance from the UC insertion to the other placental margin along the X axis,
 $$a\,{\equals}\,\left( {{\raise0.7ex\hbox{$1$} \!\mathord{\left/ {\vphantom {1 2}}\right.\kern-\nulldelimiterspace}\!\lower0.7ex\hbox{$2$}}C\,{\minus}\,e} \right)$$
.
$$a\,{\equals}\,\left( {{\raise0.7ex\hbox{$1$} \!\mathord{\left/ {\vphantom {1 2}}\right.\kern-\nulldelimiterspace}\!\lower0.7ex\hbox{$2$}}C\,{\minus}\,e} \right)$$
.2. The distance from the UC insertion to the other placental margin along the Y axis,
$$b\,{\equals}\,\left( {{\raise0.7ex\hbox{$1$} \!\mathord{\left/ {\vphantom {1 2}}\right.\kern-\nulldelimiterspace}\!\lower0.7ex\hbox{$2$}}D\,{\minus}\,d} \right)$$
.3. Distance of cord insertion from the centre (dc): measure of displacement of the cord (point of actual cord insertion) from the theoretical centre of the placenta. This distance is calculated by the relationship
$${\rm dc}^{2} \,{\equals}\,\left( {a^{2} {\plus}b^{2} } \right)$$
or
$${\rm dc}\,{\equals}\,\sqrt {a^{2} {\plus}b^{2} } .$$
4. The cord centrality index (CCI): measure of the extent of deviation of UC insertion from the actual centre of the placenta. The value ranges from 0 to 1. The closer the value is to 0, the more central is the insertion of the cord.
CCI=distance of UC insertion from the centre/half of longest diameter of the placenta.
5. Placental eccentricity index (EI): measure of the shape of placenta. It is defined as the deviation of the placental shape from the ideal ‘round’ placenta. It was considered to be reflected by the variations in the measurements of minor and major axis. The value ranges between 0 and 1. The closer the value is to 0, the more round is the placenta.


 $${\rm EI}\,{\equals}\,\sqrt {1{\minus}\left\{ {{{{\rm minor}\,{\rm axis}} \over {{\rm major}\,{\rm axis}}}} \right\}^{\!2} } $$
The EI, area and perimeter were calculated using Cleave books eclipse calculator 2004. 12
The above measurements are based on the methods described by Pathak et al.Reference Pathak, Hook and Hackett 4
The placental efficiency (β), a measure of the functional efficiency of the placenta is a more appropriate way of assessing the placental function rather than the placental weight or birth weight alone. It was measured in two different ways:
1. Beta factor (β), which is a measure of placental functional efficiency as proposed by Salafia et al.Reference Salafia, Misra and Yampolsky 13 , Reference Salafia and Yampolsky 14
It was calculated according to the formula:
 $$\beta \,{\equals}\,{{\log \,{\rm PW}} \over {\log \,{\rm BW}}}$$
2. The other method was the conventional calculation of placental efficiency by calculating the fetoplacental ratio [FPR corrected (FPRc)], where FW indicates fetal weight.
 $${\rm FPRc}\,{\equals}\,\left( {{{{\rm FW}} \over {{\rm PW}}}} \right)^{{0.75}} $$
β Factor and FPRc are inversely related since the former is a ratio of placental weight to birth weight, whereas the latter is the inverse of it. The correlation between various placental indices placental efficiency and other maternal factors was examined.
Clinical details such as birth weight, gender of the baby, gestational age at delivery, maternal age and mode of delivery were collected from the patient’s medical records. The neonates were classified as SGA or AGA according to the WHO 1995 standards, based on gestational age, birth weight and fetal gender. 15 The placental weight and fetal weight were used to calculate the placental fetal weight ratio.
Statistical analysis was performed using SPSS version 18.0 (PASW Statistics, 18.0; SPSS Inc., Chicago, IL, USA). Continuous data are presented as mean (s.d.) and categorical data as n (%). The normal distribution of data was examined using Q-Q plots. The association between birth outcome measures and placental measures were examined using Pearson’s/Spearman’s rank correlation coefficient as appropriate and performed within AGA and SGA group. Correlation coefficients were considered statistically significant if Bonferroni adjusted P value (multiple testing between placental measures) was less than 0.05. Birth weight was compared between the first and third tertiles of EI within AGA and SGA sub-groups using independent sample t-test.
Results
Characterisation of the cohort
Optimal digital images and complete clinical details were available for 160 placentae. UC insertion was central in 14, eccentric in 136 and marginal in 10 cases. Velamentous and furcate insertions were not encountered. Since the central cord insertion and marginal insertions have a CCI of 0 and 1, respectively, these were excluded from further analysis. Therefore 136 placentae were available for correlation studies. The profile of the pregnancies are summarised in Table 1. The clinical assessment during the pregnancy and delivery revealed no obstetric complications ensuring that the study group comprised only uncomplicated pregnancies. However, there were significant variations in the gross placental characteristics. The various derived measures of placenta and the birth outcomes are shown in Table 2.
Table 1 Clinical profiles of the South Indian women enrolled in the placenta cohort (n=136)

Table 2 Placental characteristics in the cohort (comprehensive) and individual small for gestational age (SGA) and appropriate for gestational age (AGA) groups
M, male; F, female; FPR, fetoplacental ratio.
Correlation between placental efficiency and measured parameters
As expected placental weight had a positive correlation with placental length, breadth, thickness, area and perimeter. Birth weight in addition to placental weight and gestational age, also correlated with the placental measures of length, breadth, area and perimeter. Placental efficiency measured as beta and FPRc showed negative correlation with each other (P<0.01), as one is an inverse of the other. Area and perimeter had positive correlation with beta and negative correlation with FPRc (P<0.01).
Eccentric placentae have lesser surface area
The EI calculated as mentioned above ranged from 0.056 to 0.853 with a mean (s.d.) of 0.482 (±0.157) and had a normal distribution (Fig. 1a). The EI showed a significant negative correlation with area (Pearson’s correlation coefficient=−0.374, P<0.0001), perimeter (Pearson’s correlation coefficient=−0.358, P<0.0001) and placental breadth (Pearson’s correlation coefficient=−0.402, P<0.0001). These results imply that higher placental eccentricity is associated with lower placental breadth and area (Fig. 1b and 1c). The EI however showed no significant correlation with birth weight, placental weight or placental efficiency (β or FPRc). The other derived placental measure CCI, ranged from 0.108 to 0.908 with a mean (s.d.) of 0.483 (±0.166). However CCI did not correlate with the birth weight, placental weight or placental efficiency (results not shown). The EI and CCI did not show any correlation (Fig. 1d).
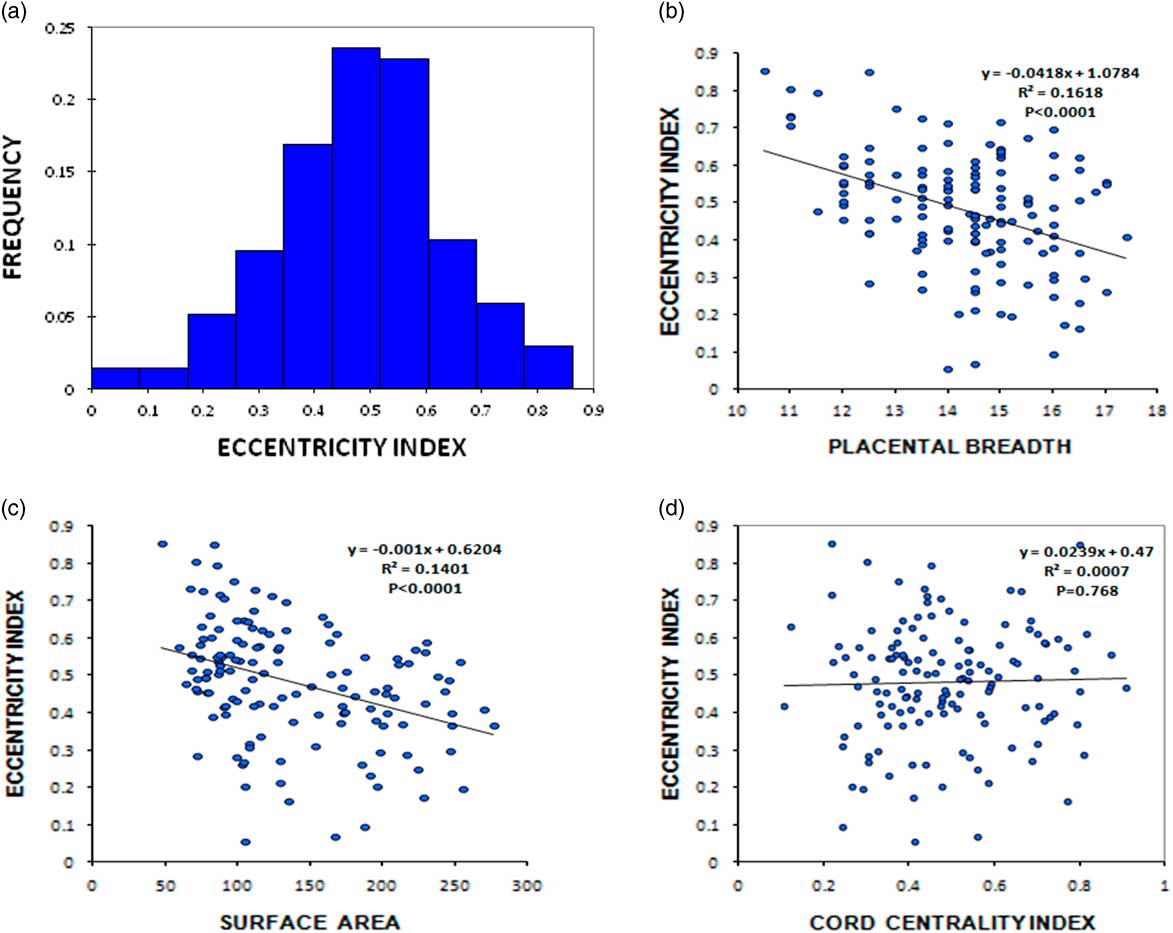
Fig. 1 (a) Frequency histogram of placental eccentricity index. Scatter diagram showing correlation of eccentricity index with breadth (b), surface area of the placenta (c) and cord centrality index (d).
Eccentric placentae have an influence on birth weight in the SGA group
To understand the effect of shape alteration on birth outcome, the cohort was further sub-grouped into SGA and AGA based upon gestational age, birth weight and fetal gender. There were 32 SGA and 104 AGA babies. The mean birth weight, placental weight and other placental characteristics in these groups are shown in Table 2. EI was negatively correlated with birth weight only in the SGA group (Pearson’s correlation coefficient=−0.436, P=0.013), and such a relationship was not observed in the AGA group (Pearson’s correlation coefficient=−0.147, P=0.136).
The SGA group was further stratified based on the tertiles of EI. The ranges of the tertiles were as follows; first tertile ⩽0.4030 (n=11), second tertile=0.4031–0.5520 (n=11) and third tertile ⩾0.5521 (n=10). Comparing the mean birth weight of the babies with EI in the first v. the third tertiles using independent sample t-test, a significant difference (P=0.027) was observed with those in the first tertile weighing higher (2647±144) compared with the third tertile (2406±297) (Fig. 2a). This difference was also tested in the AGA group which had 35 placentae with EI in the first tertile and 34 placentae with EI in the third tertile. There was no significant difference (P=0.277) in mean birth weight between the two sub-groups in AGA (3151±374 v. 3047±406) (Fig. 2b). The CCI was not different between SGA and AGA outcomes.
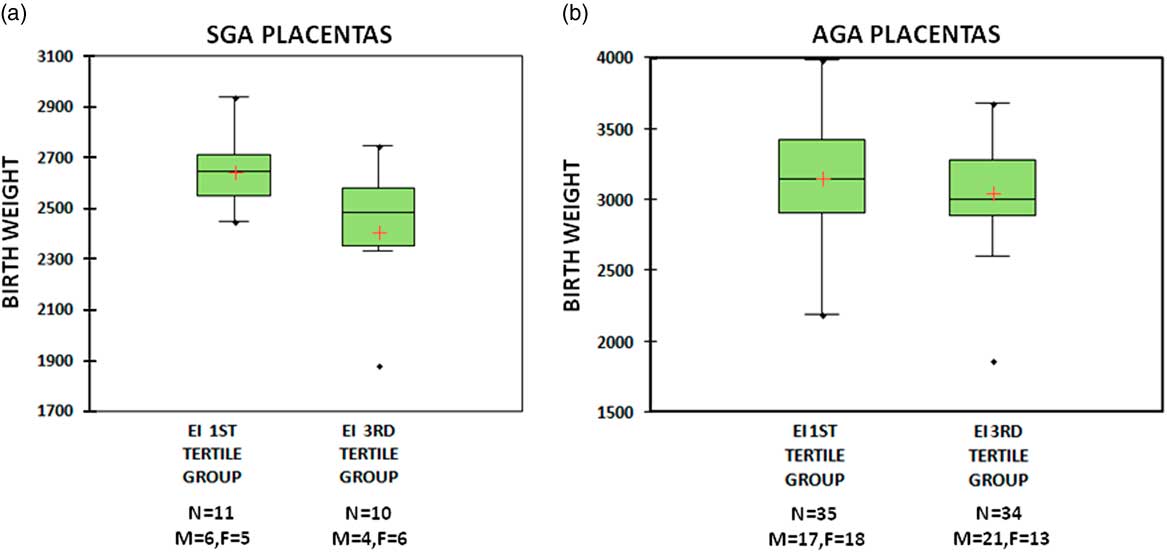
Fig. 2 Box- and whiskers-plot of birth weight in small for gestational age (SGA) (a) and appropriate for gestational age (AGA) (b) groups. Plot A shows higher mean birth weight in eccentricity index (EI) first tertile group compared with EI third tertile group in SGA babies. Plot B shows no difference in birth weight between EI first tertile and third tertile groups in AGA.
Discussion
Although the proximate causes of alteration in the efficiency of placental function might lie within genetic, epigenetic and environmental factors, it’s manifestations might be inferred by a simple measurement of gross anatomical attributes of the placenta.Reference Salafia, Zhang and Charles 16 , Reference Yampolsky, Salafia and Shlakhter 17 Yampolsky et al. demonstrated that irregular placental outline indicates suboptimal arborisation of the placental vascular tree, which accounts for low birth weight in non-round placentae in their Collaborative perinatal project.Reference Yampolsky, Salafia and Shlakhter 17 The same group of investigators, in a later study, concluded that the long-standing uteroplacental and fetoplacental vascular abnormalities influence the development of placental shape resulting in irregular shapes, thereby reducing its efficiency and affecting birth weight.Reference Salafia, Yampolsky and Misra 18
The importance of aberrations of placental shape were further highlighted when wide variation in birth weight was noted with placentae of similar weights.Reference Salafia, Zhang and Charles 16 , Reference Yampolsky, Salafia and Shlakhter 17 This was attributed to the altered placental efficiency when placental shape was abnormal, despite having an adequate mass. Placental shape variations are commonly observed even in uncomplicated pregnancies. Pathak et al. reported a mean placental eccentricity of 0.49, which is similar to our observation. They found no significant difference in EI between the reference group and compromised pregnancies which included SGA babies.Reference Pathak, Hook and Hackett 4
The mass of fetal tissue produced per unit mass of placental tissue defines the efficiency of placental functioning. Conventionally, placental efficiency is calculated as the ratio of birth weight to placental weight and is considered as a better reflection of placental function, rather than birth weight or placental weight in isolation. Although the study could not establish direct correlation between placental shape and efficiency, we have demonstrated that eccentric placentae have reduced surface area, implying that they are associated with a decreased placental efficiency.
As per Alwasel et al. placental breadth is associated with bigger body size at birth.Reference Alwasel, Abotalib and Aljarallah 19 Breadth also showed significant positive correlation with area, perimeter, placental efficiency (beta) and gestational age. The positive correlation of breadth with placental efficiency indicates that a ‘round’ placenta, where breadth approaches length results in better efficiency. Since the possible range of minor axis (breadth) is determined by the major axis, we propose EI as a better placental measure than breadth alone, since it takes into consideration both the placental axes.
The CCI did not correlate with any birth outcomes or placental efficiency. This finding is in concordance with Pathak et al. study on 861 unselected singleton pregnancies, where they found paracentral insertions as the most common mode of insertion (64%), with a mean CCI of 0.36.Reference Pathak, Hook and Hackett 4 In another study reported from India, Reddy et al. based on ultrasonic observations and considering both central and eccentric insertions as normal concluded that 75% of placentae have normal insertions.Reference Reddy, Geetha and Nim 20 Similar observations have been made in other ultrasound based studies.Reference Di Salvo, Benson and Laing 21 – Reference Collins, Collins and Collins 24
Yampolksy et al. related non-centrality of cord insertion to placental efficiency, supporting the idea that placentae with displacement of the cord from the actual centre have poorer development of chorionic vasculature and therefore reduced efficiency. But in their study non-central cord insertions did not correlate with placental shape.Reference Yampolsky, Salafia and Shlakhter 25 We also did not find any correlation of CCI with the eccentric shape of the placenta in our study. However, we have not traced the chorionic tree vasculature or microvasculature of the placenta to observe its relation to cord insertion.
We have demonstrated the importance of simple morphometric characteristics of placenta in the study of SGA babies. Although non-round shape and paracentral insertions are more common occurrences even in uncompromised pregnancies, the effect of shape aberration is reflected as low birth weight only within the SGA group. This may suggest the existence of a compensatory mechanism in AGA babies which overcomes the effect of these shape aberrations to produce normal birth weight. Moreover, with the advent of 3D placental sonography, the placental parameters measured on ultrasound during second trimester were moderately predictive of SGA.Reference Quant, Sammel and Parry 26 We propose that the measure of placental eccentricity can act as additional prognostic parameter to antenatally predict an SGA outcome.
The study has a few limitations. The study did not establish a direct relationship between EI and placental efficiency, although the reduction in surface area associated with EI suggests a link between the two. Since there were fewer SGA placentae than AGA, increasing the numbers in the SGA group may lead to more conclusive results. Second, the findings have to be validated in a larger cohort to establish the clinical utility of these observations. As a follow-up of these investigations it might be interesting to explore the mechanisms that compensate for eccentric shape in AGA babies.
Acknowledgements
The authors thank the pregnant mothers who participated in the study and the histopathology technician Ms. Mahalakshmi, who collected the data required for the study and helped with the histopath investigations. The authors also thank Dr Gururaj Arumugakani, Consultant Immunologist, Leeds Teaching Hospitals NHS Trust, Leeds, United Kingdom, for his help in English language editing.
Financial Support
Department of Biotechnology Grant No: BT/01/CEIB/12/111/06.
Conflicts of Interest
None.
Ethical Standards
The authors assert that all procedures contributing to this work comply with the ethical standards. The study has been approved by the Institutional Ethics Committee (Ref no. 202/12) and informed written consent was obtained from all patients for placental examination.
Supplementary material
To view supplementary material for this article, please visit https://doi.org/10.1017/S2040174417001076