


Introduction
Radiation therapy remains a vital modality in the management of breast cancer patients. A relatively good prognosis is shown in early-detected breast cancer patients.Reference Magee, Coyle and Kirby 1 The need for accuracy and precision in targeting the desired volumes is imperative as it not only improves success in the treatment, but also the normal tissue will be spared. Many factors have been investigated that can affect the accuracy of the treatment delivery in breast cancer patients. Various researchers reported random or inter-fraction set-up errors of magnitude between 1·7 and 5·8 mm and systematic errors between 1·0 and 14·4 mm.Reference Baroni, Garibaldi and Scabini 2 , Reference Truong, Berthelet and Patenaude 3
There has been an increase in the reports of radiotherapy-induced cardiovascular disease in the past 10 years.Reference Darby, Ewertz and McGale 4 In breast cancer, this increase was stimulated by expert reports on radiation-induced myocardial infarction, coronary revascularisation or death from ischemic heart disease. Darby et al.Reference Darby, Ewertz and McGale 4 suggest that the magnitude of the risk after any given dose to the heart is uncertain. A population-based case–control study on 2168 women who underwent radiotherapy for breast cancer between 1958 and 2001 in Sweden and Denmark revealed mean doses to the whole heart of 4·9 Gy (ranging 0·03–27·72). Several studies have suggested that exposures at this level can cause ischemic heart disease.Reference Lu Ming, Cash and Chen 5 – Reference Schultz-Hector and Trott 7 In addition to cardiac complications, radiation-induced pneumonitis, which is one of the most significant complications, has been reported in breast cancer studies manifesting within the period of 1–8 months after radiotherapy.Reference Muren, Maurstad and Halfslund 8
Recent studies have made an effort to estimate the pulmonary and cardiac complication risks involved in the radiation treatment of breast cancer. Long-term follow-up data and two-dimensional radiographic parameters such as the central lung distance (CLD) and the maximum heart distances (MHD) were used to estimate the probability of complications after radiotherapy.Reference Muren, Maurstad and Halfslund 8 – Reference Burman, Kutcher and Emami 10 However, there are controversial reports on the correlation between these radiographic parameters and the published complication probabilities.Reference Baroni, Garibaldi and Scabini 2 , Reference Gargliadi, Lax and Soderstroom 6 , Reference Schultz-Hector and Trott 7
With the development of computerised tomography (CT)-based planning methods, there has been an improvement in dose coverage and the ability to calculate relevant dose distributions in the organs at risk (OAR).Reference Muren, Maurstad and Halfslund 8 The dose–volume histograms (DVHs) generated in CT-based plans can allow clinicians to use normal tissue complication probability (NTCP) modelsReference Gagliardi, Bjohle and Ottolenghi 9 , Reference Burman, Kutcher and Emami 10 to estimate the risk of complications in the normal organs. The heart and lungs are among the organs that have been most successfully described by NTCP models that are widely available today. Many authors have used these NTCP models and parameterisations to determine the risk of complications that can arise from different breast cancer treatment techniques.Reference Gargliadi, Lax and Soderstroom 6 , Reference Van der Laan, Van't Veld and Bijl 11 – Reference Bentzen, Constine and Deasy 13 Quantec reviews have been helpful as they reported several aspects that must be considered when applying NTCP models and dose–volume constraints to clinical planning.Reference Van der Laan, Van't Veld and Bijl 11 The aim of this study was to determine the impact of patient set-up errors on the probability of pulmonary and cardiac complications in the irradiation of left-sided breast cancer.
Materials and methods
Patient selection and treatment planning
This investigation was carried out using CT data planned using a CMS XiO Version 4·6 (CMS Inc., St Louis, MO, USA) treatment planning system. Twelve left-sided female breast cancer patients treated between January 2011 and January 2012 were selected. All treatment plans had CT series that were composed of 2·5 mm slices based on the institution breast CT simulation protocol. A GE Light speed (GE Medical Systems, USA) CT scanner was used. During CT scanning, the radiation oncologist determined the extent of the breast parenchyma, on the superior aspect, inferior and the lateral aspect. The planning volumes were determined by radio-opaque wires that were used to follow the radiation oncologist's markings on the patients’ skin.
The tangential breast plans (no supraclavicular field) were optimised by the use of wedges and/or field-in-field (FIF) segments. Appropriate beam weights were applied; 6 MV and/or 18 MV photon energy was used depending on the breast separation. Multi-leaf collimators (MLCs) were used to shape the radiation fields to spare the lungs and the heart. The maximum allowed CLD was 3 cm. The maximum amount of the heart allowed in the radiation field was 1·5 cm. The total prescribed treatment dose was 50 Gy delivered in 25 fractions.
Delineation of OAR
The whole heart and the ipsilateral lung were outlined in all patients. The contoured heart volume included the myocardium (heart muscle) and the interior chambers (the left and right atrium and the ventricles). The pulmonary trunk, ascending aorta and the superior vena cava were not included in the heart volume contoured. The entire OAR volumes were contoured first by the medical dosimetrist and then evaluated by the radiation oncologist. All the plans selected for this study were contoured by the same dosimetrist and the same radiation oncologist.
Calculation of the pulmonary and cardiac NTCP
Using the Lyman–Kutcher–Burman (LKB) model, we were able to input the NTCP parameters to calculate the pulmonary and cardiac NTCPs. The schematic diagram for the NTCP calculations is shown in Figure 1. The first objective was to generate dose volume data (DVH) for the heart and ipsilateral lung before introducing error shifts on the treatment plans. This is the first step in the NTCP calculation flow chart as outlined by Kwa et al.Reference Kwa, Theuws and Wagenaar 14 We had to determine the DVH parameters that would be compared with the ones calculated after simulating the set-up errors. The lung DVH parameters for both the heart and lungs were taken from the Quantec reviews.Reference Gagliardi, Constine and Moiseenko 15 , Reference Marks, Bentzen and Deasy 17 With regard to the heart, for each patient, the partial volume of the heart receiving more than 25 Gy, V 25 (cm3) and the mean heart dose were obtained. The DVH parameters for the lung recorded include the V 20 (cm3) and the mean lung dose.
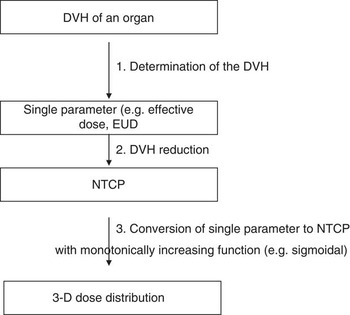
Figure 1 Schematic view of the NTCP calculation (adopted from Kwa et al.Reference Semenenko and Li 20 ). Abbreviation: NTCP, normal tissue complication probabilities.
After recording the baseline NTCPs on the original isocentre, the planning isocentre was shifted in the magnitude of 3, 5 and 10 mm in three independent directions (x, y and z) to simulate set-up errors in a method similarly used by Hector et al.Reference Hector, Webb and Evans 18 and Prabhakar et al.Reference Prabhakar, Rath and Julka 19 The NTCP for excess cardiac mortality after 10–15 years and pneumonitis was calculated using 2 Gy per fraction and the Lyman model as described by Burman et al.Reference Burman, Kutcher and Emami 10
Selection of NTCP parameters
In the Quantec reviews, Semenenko and LiReference Semenenko and Li 20 highlighted a difficulty in justifying the most accurate parameters for use because of a large number of parameter estimates available in the literature. The lung NTCP parameters used in this study quoted were based on Semenenko and LiReference Semenenko and Li 20 whose study included the lung density corrections. These published Lymen and Kutcher model parameters for radiation-induced pneumonitis were based on the analysis of various multi-institutional toxicity data.Reference Muralidah, Narayana and Alluri 16 , Reference Brink and Nielsen 21 They reported parameters considering the lung both as a single and paired organ. In this study, the following ipsilateral lung parameters were used; m = 0·35, n = 1 and TD50 = 37·6 Gy. The NTCP parameters for calculating excess cardiac mortality using the LKB model were based on a study by Canney et al.Reference Canney, Deehan and Glegg 22 as shown in Table 1.
Table 1 Parameters used for NTCP calculations for the heart and lung using the LKB model
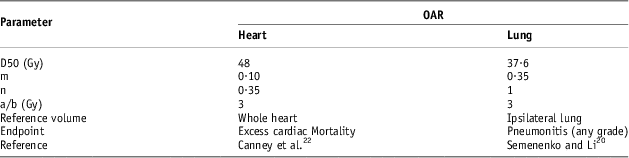
Abbreviations: NTCP, normal tissue complication probability; LKB, Lyman–Kutcher–Burman; OAR, organs at risk.
Statistical analysis
Descriptive statistics (mean, median and range) were used to report the calculated NTCP and DVH indices. The difference between the population means for the lung V 20 and heart V 25 DVH indices and the lung NTCP predictions between data with no isocentric shifts, and the data with various isocentre set-up errors, were tested for statistical significance using a paired Student's t-test comparison. The significance level used was 5% for the two-tailed test conducted using XLSTAT version 2012.2.02.
Results
The ipsilateral lung (V 20), heart (V 25) and mean doses
The DVH indices for the ipsilateral lung and the heart were calculated before and after the set-up error simulations.
DVH indices before the set-up error simulations
Table 2 shows the ipsilateral lung and heart DVH indices for each patient before set-up error simulation (n = 12). These values were then used as a baseline for comparison after each set-up error simulations. The average V 20 (n = 12) was 16·38 Gy (range 10·5–21·8 Gy), whereas the average mean lung dose delivered to the ipsilateral lung was 8·66 Gy (range 5·43–11·6 Gy). The average V 25 value for the heart was 6·3%, whereas the mean heart dose was 6·4 Gy. In one patient, a higher baseline mean heart dose was recorded owing to the anatomy of the patient, although the maximum lung heart distance was <1·5 cm.
Table 2 Ipsilateral lung and heart DVH indices before set-up error simulations (n = 12)
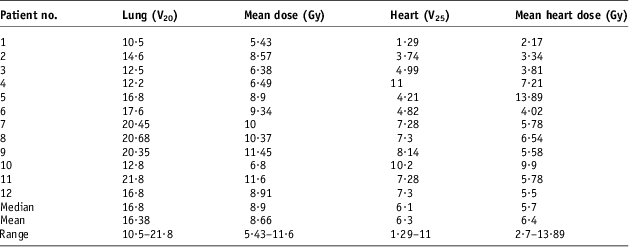
Abbreviation: DVH, dose–volume histograms.
DVH indices after the set-up error simulations
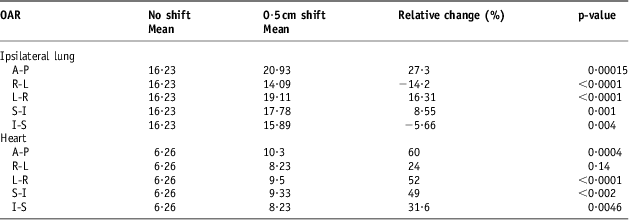
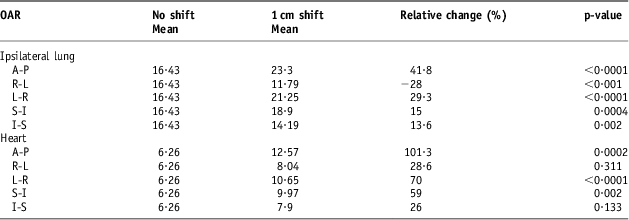
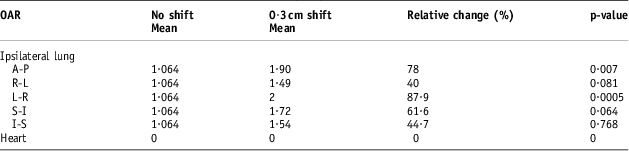
The DVH indices were analysed again after the set-up error simulations of 0·3, 0·5 and 1 cm. Tables 3–5 show a comparison between the baseline DVH indices and those recorded after the isocentric shifts. As shown in Table 5, the maximum relative change in the population mean for the Lung V 20 was recorded in the AP shift (16·43 to 23·3 Gy), p < 0·0001. Similarly, for the heart, the greatest increase in V 25 was in the AP direction after 1 cm shifts (6·26 to 12·57 Gy), p = 0·002.
Table 3 Comparison of volume with 0·3 cm isocentric shifts for the heart (V25) and the ipsilateral lung (V20)
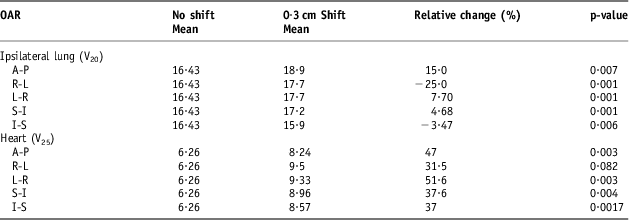
Table 4 Comparison of volume with 0·5 cm isocentric shifts for the heart (V25) and the ipsilateral lung (V20)
Abbreviation: OAR, organs at risk.
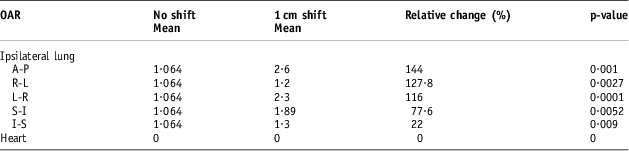
Table 5 Comparison of volume with 1 cm isocentric shifts for the heart (V25) and the ipsilateral lung (V20)
Abbreviation: OAR, organs at risk.
The calculated NTCP values for the ipsilateral lung and the heart
NTCP parameters published by Canney et al.Reference Canney, Deehan and Glegg 22 (excess cardiac mortality endpoint) and Semenenko and LiReference Semenenko and Li 20 (pneumonitis) were used in the calculations (Table 1). The NTCP for the ipsilateral lung and the heart were calculated before and after the set-up error simulations.
NTCP calculations before set-up error simulations
In addition to the DVH indices that were reported before the isocentric shifts, the NTCP for both the lung and heart were calculated (Table 6). These values show a mean value of 1·67% (range 0·73–3·4%). A maximum lung NTCP of 3·4 was reported in a patient with 3 cm CLD. The heart NTCP was 0 for all the patients recruited. All the patients had a CLD of 3 cm or less and an average MHD of 1·4 cm.
Table 6 The calculated ipsilateral lung and heart NTCPs before set-up error simulations (n = 12)
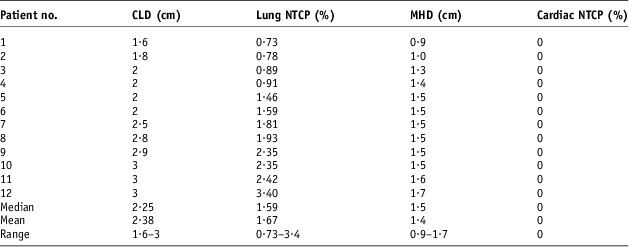
Abbreviations: NCPT, normal tissue complication probability; CLD, central lung distance; MHD, maximum heart distance.
NTCP calculations after set-up error simulations
Tables 7–9 show the population mean for the calculated lung and heart NTCP values before and after the 0·3, 0·5 and 1 cm isocentre moves (n = 12). These values were compared with the baseline values before the shifts. The relative changes were then quantified as a percentage and tested for statistical significance. Consistent with the DVH indices, the maximum calculated population mean NTCP was in the AP direction after a 1 cm shift. This was a 144% (p < 0·001) relative change compared with the value before the shift.
Table 7 The populations means for the calculated lung and heart NTCP values before and after the 0·3 cm isocentre moves (n = 12)
Abbreviations: NTCP, normal tissue complication probability; OAR, organs at risk.
Table 8 The populations means for the calculated lung and heart NTCP values before and after the 0·5 cm isocentre moves (n = 12)
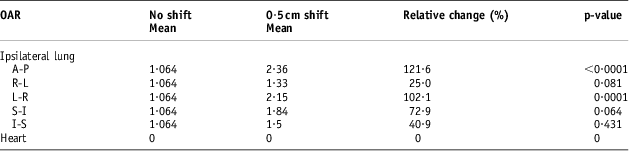
Abbreviations: NTCP, normal tissue complication probability; OAR, organs at risk.
Table 9 The populations means for the lung and heart NTCP values before and after the 1 cm isocentre moves (n = 12)
Abbreviations: NTCP, normal tissue complication probability; OAR, organs at risk.
Discussion
Radiation-induced pneumonitis complication probability
The NTCP data reported in this study for the radiation pneumonitis endpoint are in agreement with most published reports of NTCP values ranging from 1% to 5%. This range is comparable to the NTCP recorded in this study before set-up error simulations. In 67% of the patients (n = 8), the mean NTCP values were less or equal to 2%. HurkmanReference Hurkmans, Borger and Bos 23 reported lower values between 0% and 1% using the LKB Model. After performing set-up error simulations with 0·3, 0·5 and 1 cm shifts in the x, y and z directions, the maximum percentage variation in the NTCP value for the 0·3 cm isocentre shift was 78% recorded in the anterior–posterior direction. With 0·5 cm shifts, the maximum relative NTCP was 121·6% recorded in the anterior–posterior direction (p < 0·0001). A maximum value of 144% was recorded with 1 cm posterior set-up errors (p < 0·001). It is important to note that, even with the very high percentage differences recorded, the highest absolute maximum ipsilateral lung NTCP value recorded was 5·81%.
Excess cardiac mortality complication probability
The NTCP for excess cardiac mortality was 0% for all patients. These results are in close agreement with O Kyu et al.Reference O Kyu, Sung and Seung 24 who reported NTCP values for excess cardiac mortality of 0·0% in two-field treatment plans. O Kyu et al.Reference Graham, Purdy and Emami 25 also reported an NTCP value of 0·7% for the three-field plans and 1·7% for the reverse hockey stick techniques using the relative seriality model. Gagliardi et al.Reference Gagliardi, Constine and Moiseenko 15 cautions that NTCP values >5% could jeopardise the beneficial effect on survival.
The cardiac NTCP results in this study are in agreement with the studies that used the LKB model for reporting cardiac complications. It is evident that set-up errors up to 1 cm do not have a significant effect on the cardiac NTCP. Higher NTCP values are reported in studies that used the relative seriality model, which is frequently used for assessing cardiac mortality and was used by Gagliardi et al.,Reference Gagliardi, Constine and Moiseenko 15 who presented clinical data on excess cardiac complications in breast cancer and recorded mean NTCP values between 1·6% and 2·3%. This deviation from our results may be expected as patientsReference Gagliardi, Constine and Moiseenko 15 were treated for the internal mammary nodes with oblique incident electron or photon fields that administered more radiation dose to the heart.
Variation in pulmonary and cardiac dose–volume indices
Graham et al.Reference Graham, Purdy and Emami 25 found that the percentage of the ipsilateral lung receiving a dose larger than 20 Gy was significantly correlated to the grade of pneumonitis. Similarly, the V 25 and the mean cardiac doses have been used as indicators of cardiac complications in breast cancer. In the current research study, the DVH indices for both the ipsilateral lung and the heart were calculated.
The Quantec recommended shows that the heart V 25 should be <10% based on 1% risk of cardiac mortality. In addition, the V 20 for the ipsilateral lung should be <30% and the mean lung dose (MLD) <20%. However, based on Table 5, heart tolerance is exceeded after 1 cm anterior–posterior (AP), right–left (RL) and left–right (LR) directional moves. The DVH reports also show that 1 cm posterior shifts caused the greatest deviation in lung tolerance. In 58% of the patients (n = 7), V 20 was out of tolerance based on the Quantec reviews.Reference Bentzen, Constine and Deasy 13 , Reference Marks, Bentzen and Deasy 17 This suggests that errors should be strictly kept below 1 cm to minimise the risk of cardiac complications.
Tissue-density corrections and choice of algorithms
There is need for great caution in comparing the NTCP calculations in treatment planning. GagliardiReference Gagliardi, Constine and Moiseenko 15 cautions that if inhomogeneity corrections for the low-density lung tissue are not made in the treatment plans, the heart dose is underestimated, and this affects the use of the NTCP calculations and the volume-based predictions. The lung V 20 has been found to be sensitive to the choice of the algorithm used. However, the values for the heart complications have been found to be relatively insensitive to the choice of algorithm. The calculation algorithm used for treatment plan optimisation in this study was the superposition algorithm, which uses the collapsed cone convolution algorithm and is far more accurate than the routinely used FFT convolution in the presence of the tissue in homogeneities.Reference Muralidah, Narayana and Alluri 16 The current investigation made sure that lung NTCP parameters and DVH parameters were from 3D conformal studies such as those quoted in the recent Quantec reviews.Reference Gagliardi, Constine and Moiseenko 15 , Reference Marks, Bentzen and Deasy 17
Clinical implications
There is need for radiation oncologists to be aware of the implications of the reported NTCPs in left-sided breast cancer patients. With improved survival rates in the treatment of breast cancer, long-term risks of radiotherapy become relevant.
It is becoming common in most radiotherapy practices to shape the field with a heart block to reduce cardiac exposure. As proposed by Gargliadi et al.,Reference Gargliadi, Lax and Soderstroom 6 cardiac risk could be substantially reduced by partially blocking the heart using MLCs in treatment planning. Raj et al.Reference Raj, Evans and Prosnitz 26 recommend that, although this is a reasonable method to limit cardiac dose, it should be used cautiously, especially in inferiorly located tumour beds. However, it is crucial to know that the reported NTCPs in this study are for standard tangential radiation with 50 Gy in 25 fractions. Higher doses and therefore higher risk of complications may be reported for different treatment regimens. For example, Andratschke et al.Reference Andratscheke, Maurer and Molls 27 reported doses in hypo-fractionation schemes that are higher than the results in this study after correction of the fractionation efforts using the linear quadratic model (LQ-Model) and a/b ratio.
Limitations
The results of this study are based on the LKB model for calculating NTCPs. It could have been beneficial to use the relative seriality model for assessing the risk of excess cardiac mortality as it has been widely described in the literature. CMS XiO V4·16 treatment planning only used the LKB NTCP model. Despite this limitation, the Quantec reviews report that, although the LKB model is not considered the best model, it cannot be rejected as a good fit of the data.Reference Van der Laan, Van't Veld and Bijl 11
Conclusions
The simulation of set-up errors in all the three directions (x, y and z) shows that the isocentric shifts in the posterior direction have the most significant impact on the DVH data for both the lungs and the heart. Pulmonary complications could be minimised if overall set-up errors of more than 5 mm are avoided in any single direction. However, the cardiac NTCPs calculated with the standard tangential techniques resulted in zero complication probability for the whole heart.
Acknowledgements
The author acknowledges his colleagues at the Cancer Centre Bahamas and Christopher Bragg at Sheffield Hallam University for their guidance, encouragement and advice.
Financial Support
This research received no specific grant from any funding agency, commercial or not-for-profit sectors.
Conflicts of Interest
None.


