List of symbols
- b
material constant
- E
Young's modulus
- e
void ratio (–)
- e 0
void ratio measured at p 0 (–)
- F
force (kN)
- K
bulk modulus of water (MPa)
- l 0
initial length (m)
- n
material constant
- p
average stress (swelling pressure) (kPa)
- p′
average effective stress (kPa)
- p 0
reference value of average stress (kPa)
- q
deviator stress (kPa)
- q f
maximum deviator stress (kPa)
 $q_{\,f_0}$
maximum deviator stress at p 0 (kPa)
- $q_{\,f_s}$
maximum deviator stress with the strain rate taken into account (kPa)
- $q_{\,f_{s0}}$
maximum deviator stress measured at strain rate ν s0 (kPa)
- R
universal gas constant (J/(mol K))
- RH
relative humidity (%)
- S r
degree of water saturation (%)
- T
temperature (K)
- t
time (s)
- u n
vapour pressure of water (kPa)
- $u_{n_0}$
saturation vapour pressure above a flat surface of pure water (kPa)
- u
pore-water pressure (kPa)
- w
water content (%)
- β
material constant
- Δl
deformation (m)
- ε
strain (%)
- ϕ
friction angle (°)
- ν
Poisson's ratio (–)
- νs
strain rate (1/s)
- νs0
reference strain rate (1/s)
- νw0
specific volume of water (m3/kg)
- ρ
bulk density (kg/m3)
- ρm
density at saturation (kg/m3)
- ρs
particle density (kg/m3)
- ρw
water density (kg/m3)
- σ3
minor principal stress (kPa)
- σ1
major principal stress (kPa)
- ψ
suction (kPa)
- ων
molecular mass of water vapour (kg/kmol)


BACKGROUND
In nuclear-waste repositories, coupled and usually very complex processes may take place. Simplified models are needed to predict behaviour and consequences in complex geometries. Such a model and an applied modelling technique are presented and validated here.
Earthquake-induced rock shear through a deposition hole in a repository for spent nuclear fuel may cause substantial damage to the canister hosting the spent fuel. The consequences of such an event have been investigated by finite element (FE) simulations for the Swedish safety analyses (SR-Site) using the Abaqus finite element code (Hernelind, Reference Hernelind2010).
This paper describes the laboratory tests conducted to develop a material model of the buffer to be used in the simulations, the material models that these tests have provided and FEM of three rock-shear tests at the scale 1:10 with comparison between measured and simulated results. The modelling was performed to validate the material models and the calculation technique. The material model of the bentonite buffer was derived from laboratory tests. The work has yielded improved material models and modelling techniques compared to previous calculations made by the authors (Börgesson et al., Reference Börgesson, Johannesson and Hernelind2004). No similar investigations or simulations have been found in the literature.
In the model introduced by Börgesson et al. (Reference Börgesson, Johannesson and Hernelind2004) the relevant properties of the buffer that affect the stresses in the canister at a rock shear are the shear strength, the stiffness before the maximum shear stress is reached and the shear rate that also affects the shear strength. These properties are mainly dependent on the bentonite type and the density (which corresponds to a swelling pressure). As the shear caused by an earthquake is very fast and the hydraulic conductivity of the bentonite is very low it is not possible for the pore water in the water-saturated bentonite to be re-distributed so the effect will correspond to undrained shear. If the clay remains saturated in water during shear, the volume change will be so small that the volume might be considered to be constant. The very fast shear rate during an earthquake will also hinder the formation of air-filled micro cracks. In addition, the space between the canister and the rock, filled with bentonite in a deposition hole, will not change its volume during a rock shear. Constant volume yields a Poisson's ratio of 0.5 according to equation 1, as K is approaching ∞.
 $${\rm \nu} = {\rm} \left( {3^.K - E} \right)/\left( {6^.K} \right){\rm} = {\rm} 0.5 - E/\left( {6^.K} \right)$$
As the compressibility of water and particles is extremely small (Bulk modulus of water K = 2.2×10³ MPa), the bentonite has been modelled as a solid material with a Poisson's ratio of 0.49. This value is supported by measured values of E moduli of ~250 MPa for this type of material (e.g. see the results in the present study), which, according to equation 1 and using K = 2.2×10³ MPa, would yield ν = 0.48.
The scale tests were designed in 1986 (Börgesson, Reference Börgesson1986) and modelled in 2010 (Börgesson & Hernelind, Reference Börgesson and Hernelind2010). The tests simulated a deposition hole at the scale of 1:10 with reference density of the buffer, very stiff confinement simulating the rock, and a solid bar of copper simulating the canister. The three tests were almost identical with the exception of the rate of shear, which varied between 0.031 and 160 mm/s, i.e. by a factor of >5000. The tests were well documented. Shear force, shear rate, total stress in the bentonite, strain in the copper and the movement of the top of the simulated canister were measured continuously during application of the shear. Subsequently the equipment was dismantled and the bentonite was sampled carefully by measuring water content and density. The deformed copper ‘canister’ was also measured carefully after the test. The comprehensive data collected in these tests are thus available and have been used to check the material models, the calculation sequence and the boundary conditions that were used in the calculations for SR-Site.
The present study describes the laboratory tests, the material models, the scale tests and the FEM simulations and compares the results of the scale tests and the simulations. This combines the results of three reports by Dueck et al. (Reference Dueck, Börgesson and Johannesson2010), Börgesson & Hernelind (Reference Börgesson and Hernelind2010) and Börgesson et al. (Reference Börgesson, Dueck and Johannesson2010).
LABORATORY TESTS
Material
Three main types of bentonites were tested: MX-80, which contains predominantly Na-smectite; Deponit CaN, which contains predominantly Ca-smectite; and MX-80Ca and MX-80Na, which are MX-80 bentonite ion-exchanged with Ca and MX-80 bentonite ion-exchanged with Na, respectively.
The mineralogy and sealing properties of the Na-dominated MX-80 (a Wyoming bentonite product from American Colloid Co.) and the Ca-dominated Deponit CaN (a bentonite from Milos, Greece, produced by IBECO) were reported by Karnland et al. (Reference Karnland, Olsson and Nilsson2006).
The ion exchange to MX-80Ca and MX-80Na was performed by placing compacted specimens of MX-80 in a saturation device with filters on both sides. Deionized water was applied to the filters after evacuation of filters and tubes. The specimens were saturated at constant-volume conditions. After 1–2 days the deionized water was changed to a chloride solution of NaCl or CaCl2, according to desired cation of the clay (i.e. Na+ or Ca2+), circulating through the filters above and below the specimens. The results from swelling-pressure tests, triaxial tests and unconfined compression tests have been used as a base to establish the material model. These test types are described below. The particle density ρs = 2750 kg/m3 was used for Deponit CaN and ρs = 2780 kg/m3 was used for the other materials while the water density used was ρw = 1000 kg/m3 (Karnland et al., Reference Karnland, Olsson and Nilsson2006).
Swelling-pressure measurements
The swelling pressure was determined in a swelling-pressure device, consisting of a steel ring surrounding the specimen having filters on both sides. A piston and a load cell were placed vertically, in the axial direction, above the specimen. The bottom plate and a plate above the load cell were bolted together to keep the volume of the specimen constant. Swelling-pressure measurements, made with a similar method, on different bentonites with different dominating ions and in contact with different salt solutions, were reported by Karnland et al. (Reference Karnland, Olsson and Nilsson2006). At high density, no large difference in swelling pressure was observed between Na- and Ca-dominated bentonites, which are comparable to the materials used in the present study. Swelling pressure of Na-dominated bentonites have also been reported in previous studies (Börgesson et al., Reference Börgesson, Johannesson, Sandén and Hernelind1995; Kahr et al., Reference Kahr, Kraehenbuehl, Stoeckli and Müller-Vonmoos1990; Karnland et al., Reference Karnland, Nilsson, Weber and Wersin2008). Depending on the boundary conditions and the natural variations of the bentonite material, small differences may be observed in the results.
The cylindrical specimens were prepared either from blocks by mechanical trimming or by use of a special compaction device where powder was compacted to a certain density. The specimens had a diameter of 35 mm and their height varied between 13 and 20 mm. Deionized water was applied to the filters after evacuating the filters and the tubes. The specimens had free access to water throughout testing. After the test, the water was evacuated from the filters and tubes and the water content and the density of the specimen were determined. The water content was determined as the mass of water to the dry mass of the sample after drying at 105 °C for 24 h. The density was determined from weighing a sample above and submerging it into paraffin oil. The dry density was then calculated from the density and water content.
Triaxial tests
Results from triaxial tests on saturated bentonite specimens have been reported previously (e.g. Karnland et al., Reference Karnland, Olsson, Dueck, Birgersson, Nilsson, Hernan-Håkansson, Pedersen, Nilsson, Eriksen and Rosborg2009; Åkesson et al., Reference Åkesson, Olsson, Dueck, Nilsson, Karnland, Kiviranta, Kumpulainen and Lindén2012). Results from and description of the test technique and the evaluation were also given by Börgesson et al. (Reference Börgesson, Johannesson, Sandén and Hernelind1995).
Triaxial tests on highly compacted bentonite specimens were also reported by Man & Martino (Reference Man and Martino2009) and ENRESA (1998). In the former study, it was mainly sand-bentonite which was used and in the latter study FEBEX bentonite was selected. In the former report the influence of ionic solution instead of deionized water was reported and increased strength was obtained when solutions of CaCl2 were used. Increased shear strength, measured as residual strength using a direct shear box, was also reported by Di Maio & Fenelli (Reference Di Maio and Fenelli1994) as an effect of the use of an ionic solution of NaCl.
In the present study a high-pressure triaxial cell equipped with deformation transducer, load cell and pore- and cell-pressure transducers was used. Two different methods were used for preparation of the specimens namely trimming or compaction to a certain density. A special saturation device was used for specimens prepared in more than one piece or for specimens far from saturation. In the saturation device, deionized water was applied after evacuating the filters surrounding the specimens. All specimens had a final height of 70 mm and a diameter of 35 mm when mounted in the triaxial cell. The applied cell pressure was based on an estimation of the actual swelling pressure of the bentonite to minimize volume change of the specimen before closure of the valves. The valves to the pedestal and top-cap were kept closed during the equilibration period and the pore pressure at the base pedestal was measured. Filter-paper drains along the specimens were used to accelerate the equalization of the pore pressure.
When the cell was at pressure equilibrium, it was placed in a mechanical press and the shear test commenced. A constant shear rate of 4–9×10⁻⁶ mm/s (corresponding to a strain rate of 6–13×10–6%/s) was used. The specimens were undrained during the course of shearing. After failure, the water content and density of the specimens were determined.
The cell pressure, σ3 (kPa), pore pressure, u (kPa), deformation, Δl (m), and axial force, F (kN), were measured throughout the test. Because the specimens were undrained during shearing, no volume change was taken into account and the deviator stress, q (kPa), was calculated from equation 2, where A 0 is the initial specimen cross-section area and l 0 the initial length of the specimen. The vertical total stress σ1 (kPa), the average effective stress, p′ (kPa), and the strain, ε (%), were derived from equations 3, 4 and 5, respectively.
 $$q = \displaystyle{F \over {A_0}}\left(\displaystyle{{l_0 - \Delta l} \over {l_0}}\right)$$
 $${\rm \sigma} _1 = q + {\rm \sigma} _3$$
 $$p^{\prime} = \displaystyle{1 \over 3}\left({\rm \sigma} _1 + 2{\rm \sigma} _3 - 3{\rm \alpha} u\right)$$
 $${\rm \varepsilon} = \displaystyle{{\Delta l} \over {l_0}} \cdot 100$$
The use of α = 1 in equation 4, which describes the effective stress theory according to Terzaghi, was motivated by measurements on bentonite, which yield values between 0.9 and 1.0 (Graham et al., Reference Graham, Oswell and Gray1992; Harrington & Birchall, Reference Harrington and Birchall2007).
Unconfined compression test
In the unconfined compression tests, a water-saturated specimen is compressed axially with a constant rate of strain with no radial confinement or external radial stress. This technique is much simpler and quicker than the triaxial test and should yield the same results, according to the effective stress theory, because the suction in the unconfined specimen corresponds to an effective stress equal to the swelling pressure. The correspondence between suction and swelling pressure is described further below. The specimen cannot change volume and the effective average stress was kept constant during the test, as shown by the triaxial tests. However, some uncertainties may be introduced as the test type does not enable control of pore pressure and ion equilibrium.
Results from unconfined compression tests on saturated bentonite have also been reported earlier (Börgesson et al., Reference Börgesson, Johannesson and Hernelind2004; Dueck, Reference Dueck2010; Dueck et al., Reference Dueck, Johannesson, Kristensson, Olsson and Sjöland2011). The method is often used for unsaturated highly compacted bentonite specimens (e.g. Dixon et al., Reference Dixon, Kohle, Drew and Keith2006). A similar testing technique was used and a similar evaluation of results was carried out but the results are not comparable, because those specimens were not water saturated.
The specimens in the present study were prepared in the same way as those for the triaxial tests but the final dimensions were smaller. All unconfined compression tests were carried out on specimens with a height of 40 mm and diameter of 20 mm. The specimens were placed in a load frame and the compression performed at a constant rate. The applied strain rate for several specimens was 0.013%/s, corresponding to 0.0053 mm/s for the specimen height 40 mm. During compression at that rate, the specimens were surrounded by a thin plastic film to minimize evaporation of water.
A very fast, precision compression machine was used for shear rates of between 0.1 and 300 mm/s. Above 300 mm/s, a compression hammer was used. The deformation and the applied force were measured continuously with a load cell and a deformation transducer and after failure the water content and density were determined.
The specimens were considered as undrained during shearing and no volume change was taken into account. The deviator stress was derived from equation 2.
RESULTS
A model mainly describing the relationship between density, swelling pressure, shear strength and rate of strain for different bentonites was developed and reported by Börgesson et al. (Reference Börgesson, Johannesson, Sandén and Hernelind1995, Reference Börgesson, Johannesson and Hernelind2004). This model was used (see below) and was updated in the present study in terms of the impact of strain rate and impact of change of the dominant exchangeable ions (Börgesson et al., Reference Börgesson, Dueck and Johannesson2010).
Swelling pressure
The swelling pressure, p, has been modelled as a function of the void ratio e according to equation 6 when 0.5 < e < 1.5 (Börgesson et al., Reference Börgesson, Johannesson, Sandén and Hernelind1995) where e 0 is the measured value at p 0 = 1000 kPa and β is a material constant.
 $$p = p_0 \cdot \left( {\displaystyle{e \over {e_0}}} \right)^{\left( {1/{\rm \beta}} \right)}$$
Measured swelling pressures of the bentonites are presented in Fig. 1 together with equation 6 with the parameters shown in Table 1 (solid lines). The colours blue, green, orange and red denote the materials MX-80, MX-80Na, MX-80Ca and Deponit CaN. Details of the specimens are listed in Table 2. The swelling pressure was evaluated from the results of the triaxial tests as the effective average stress, p′, at equilibrium before the beginning of shearing. The suction calculated from RH measurements on saturated dismantled samples was also used as a measure of the swelling pressure. A relationship between water-retention properties in terms of chemical potential, RH or suction and swelling pressure under certain conditions has been demonstrated (Kahr et al., Reference Kahr, Kraehenbuehl, Stoeckli and Müller-Vonmoos1990; Karnland et al., Reference Karnland, Muurinen, Karlsson, Alonso and Ledesma2005).
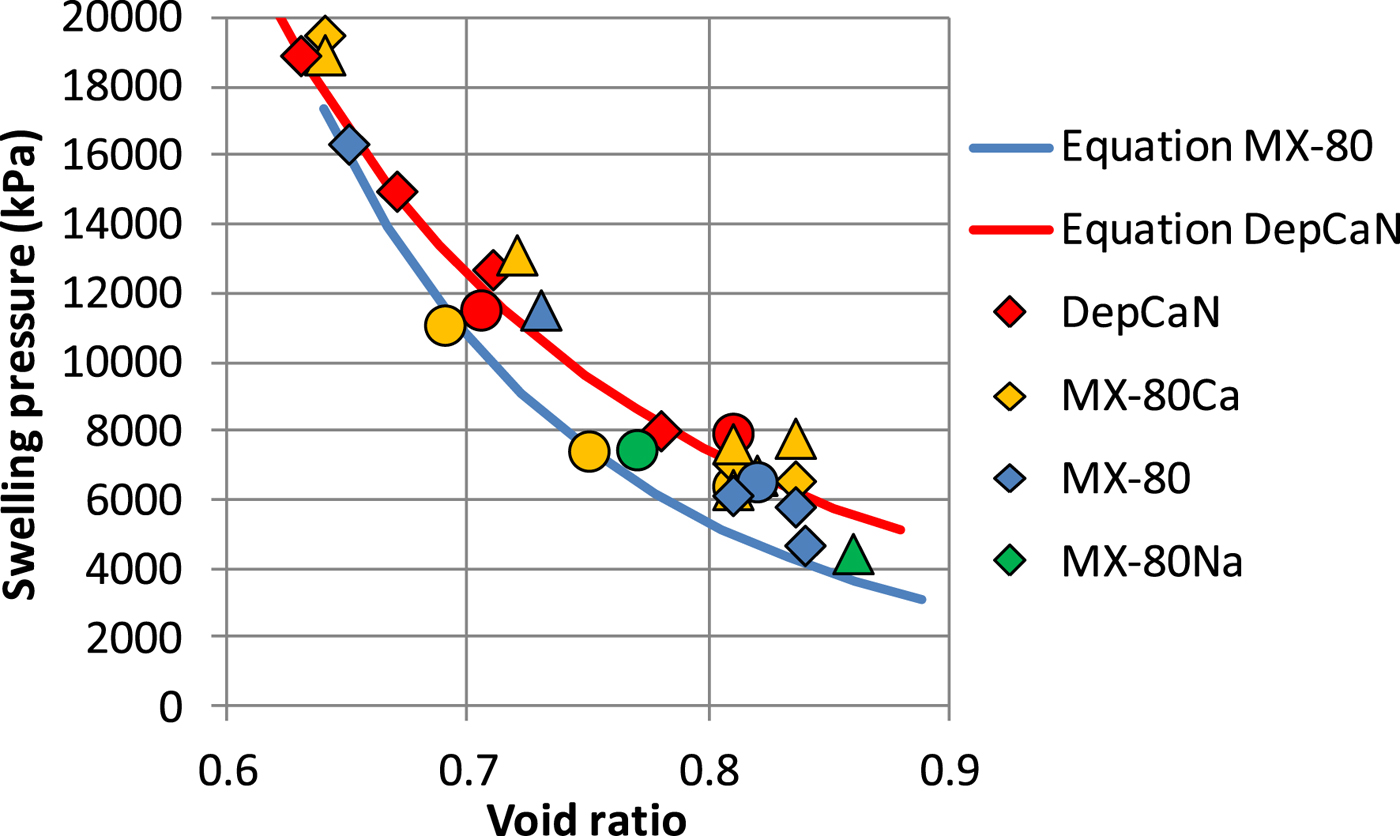
Fig. 1. Swelling pressure as a function of void ratio of the different bentonite types. The diamonds, circles and triangles denote swelling pressure tests, triaxial tests and RH measurements, respectively, while the solid lines correspond to calculated values according to equation 6 with constants from Table 1.
Table 1. Constants used in equation 6 for different materials.

Table 2. Final values of water content, void ratio and degree of saturation of specimens used for measurement and evaluation of swelling pressure. In addition, the method of preparation (compacted from powder to high-density specimen, trimmed or dismantled after saturation) and method of measurement: (1) measured with a movable piston in a swelling pressure device; (2) equilibrium in triaxial cell before shearing; (3) RH measurement on dismantled specimen) are also shown.

The value of suction, ψ, was calculated according to the thermodynamic relation given in equation 7, (Fredlund & Rahardjo, Reference Fredlund and Rahardjo1993). Parameters included in the equation are the absolute temperature, T, the universal gas constant, R, the specific volume of water, ν w0, the molecular mass of water vapour ων, the vapour pressure of pore water, u ν, and the saturation vapour pressure above a flat surface of pure water, u ν0. The ratio between the parameters u ν and u ν forms the definition of relative humidity, RH.
 $${\rm \psi} = - \displaystyle{{{\rm R} \cdot T} \over {\nu _{w0} \cdot {\rm \omega} _\nu}} \ln (\displaystyle{{u_\nu} \over {u_{\nu 0}}})$$
Shear strength
The measured shear strength, evaluated as the maximum deviator stress, q, can be compared to results from previous studies. The failure envelope, i.e. the shear strength plotted as function of the mean effective stress is expressed in equation 8 (Börgesson et al., Reference Börgesson, Johannesson, Sandén and Hernelind1995), which was originally derived from triaxial test results, where  $q_{\,f_0}$ is the measured value at p 0 = 1000 kPa and b is a material constant.
 $$q_f = q_{\,f_0} \cdot \left( {\displaystyle{{\,p_{}} \over {\,p_0}}} \right)^{\rm b}$$
The results from the present investigation together with results from previous work including Karnland et al. (Reference Karnland, Sandén, Johannesson, Eriksen, Jansson, Wold, Pedersen, Motamedi and Rosborg2000) and Karnland et al. (Reference Karnland, Olsson, Dueck, Birgersson, Nilsson, Hernan-Håkansson, Pedersen, Nilsson, Eriksen and Rosborg2009) are shown in Fig. 2. In addition the results presented by Åkesson et al. (Reference Åkesson, Olsson, Dueck, Nilsson, Karnland, Kiviranta, Kumpulainen and Lindén2012) are in agreement with those in Fig. 2. The failure envelopes of the bentonite materials were evaluated according to equation 8, where the constants used are shown in Table 3. The stress paths during the triaxial tests were mainly vertical (Fig. 2), suggesting that the swelling pressure in the form of effective average stress was constant during shearing and that the deviator stress at failure can be expressed as a function of the swelling pressure, i.e. equation 8. At undrained shear, the total average stress does not influence the strength so undrained uniaxial tests may be used to evaluate the strength. The effective stresses are not necessary for the model. The bentonite at undrained shear behaves as material in which the stress-strain relation is independent of the changes in total stress.
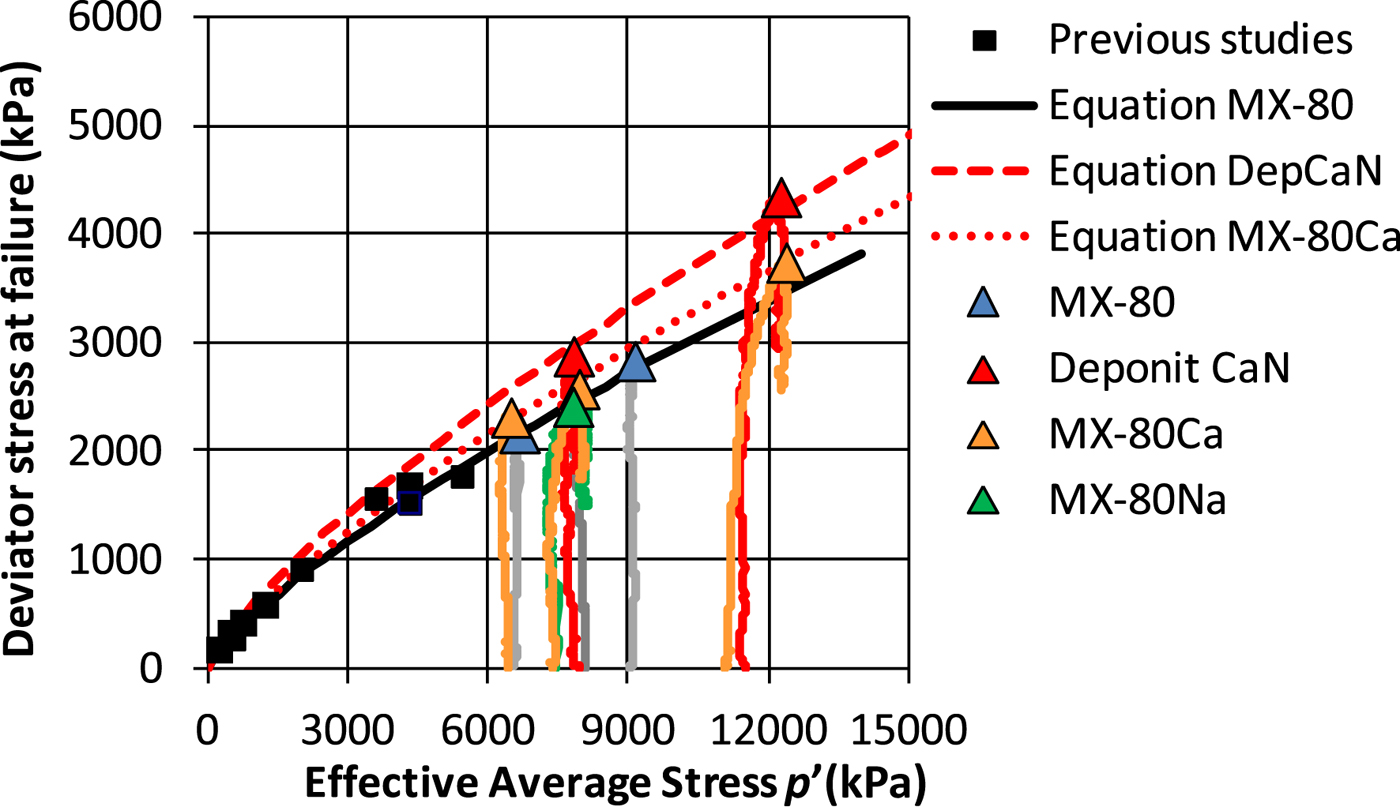
Fig. 2. Deviator stress at failure as a function of effective average stress from triaxial tests. Some of the test results are shown with stress paths. Measured results (triangles and squares) and calculated values according to equation 8 (lines) with constants from Table 3. Results from previous studies by Karnland et al. (Reference Karnland, Sandén, Johannesson, Eriksen, Jansson, Wold, Pedersen, Motamedi and Rosborg2000, Reference Karnland, Olsson, Dueck, Birgersson, Nilsson, Hernan-Håkansson, Pedersen, Nilsson, Eriksen and Rosborg2009) and Börgesson et al. (Reference Börgesson, Hökmark and Karnland1988, Reference Börgesson, Johannesson, Sandén and Hernelind1995) are also shown.
Table 3. Constants used in equation 8 for different materials.

The results of the triaxial tests with shear rate 4–9 × 10⁻⁶ mm/s, corresponding to a strain rate of 6–13 × 10–6%/s, were plotted together with results of the unconfined compression tests with the shear rate 5 × 10⁻³ mm/s, corresponding to a strain rate of 0.013%/s, in Fig. 3. In the diagram, the lines represent a combination of equations 6 and 8, rewritten as equation 9, and used with the parameters from Tables 1 and 3.
 $$q_f = q_{\,f_0} \cdot \left( {\displaystyle{{e_{}} \over {e_0}}} \right)^{\textstyle{{\rm b} \over {\rm \beta}}} $$
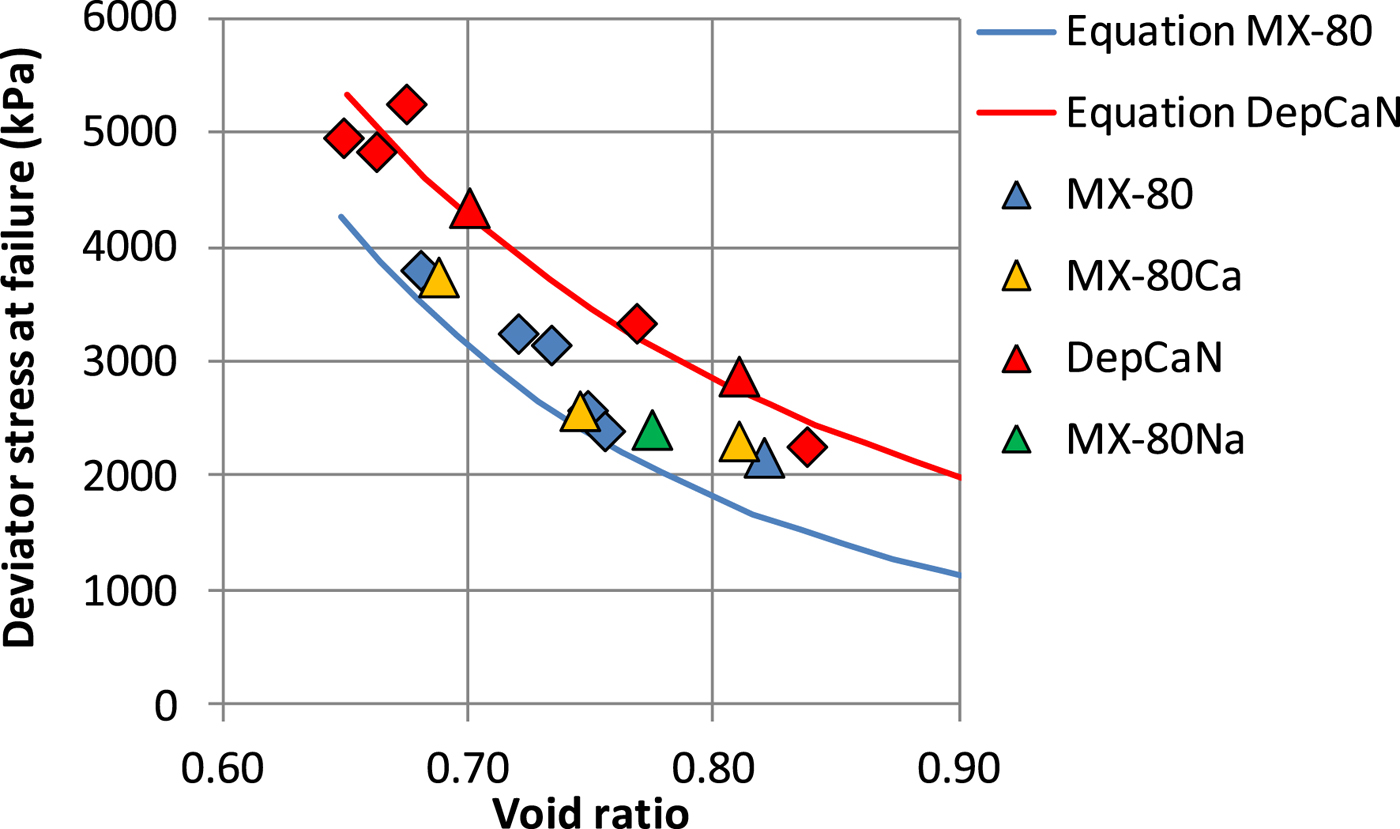
Fig. 3. Deviator stress at failure as a function of void ratio of different bentonite types and test types. The diamonds and triangles show measured results from unconfined compression tests and triaxial test, respectively. The solid lines show calculated values according to a combination of equations 6 and 8 for two materials with constants from Tables 1 and 3.
Details of the specimens used are listed in Tables 4 and 5. The exchangeable ion affects the shear strength inasmuch as the Ca-dominated bentonites have generally higher shear strength than their Na-dominated counterparts (Fig. 2, 3), in agreement with Dueck (Reference Dueck2010). Higher shear strength was also shown as an effect of the use of ionic water at shearing (Man & Martino, Reference Man and Martino2009; Di Maio & Fenelli, Reference Di Maio and Fenelli1994).
Table 4. Final values of water content, void ratio and degree of saturation of specimens used for triaxial tests. In addition the method of preparation is shown.

Table 5. Final values of water content, void ratio and degree of saturation of specimens used for unconfined compression tests. In addition, the method of preparation is shown.

Influence of strain rate
The dependence of strain rate, v s, on the deviator stress at failure,  $q_{\,f_s}$, has been proposed to follow equation 10 (Börgesson et al., Reference Börgesson, Johannesson and Hernelind2004) where
  $q_{\,f_{s0}}$ is the measured value at the strain rate ν s0 = 10–6 s–1 and n is a constant.
 $$q_{\,f_s} = q_{\,f_{s0}} \cdot \left( {\displaystyle{{\nu _s} \over {\nu _{s0}}}} \right)^{\rm n}$$
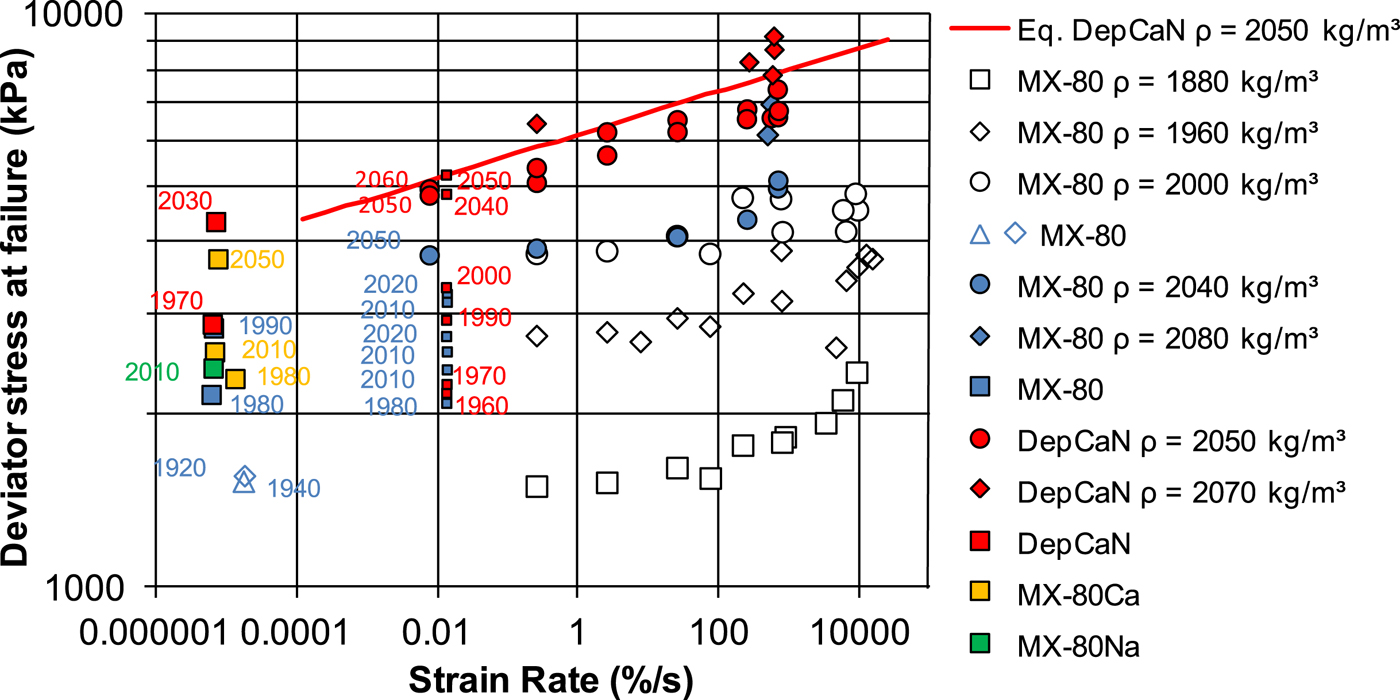
The deviator stress at failure from all types of tests was plotted as a function of strain rate (Fig. 4, filled symbols). The open symbols represent data from Börgesson et al. (Reference Börgesson, Johannesson and Hernelind2004), Karnland et al. (Reference Karnland, Sandén, Johannesson, Eriksen, Jansson, Wold, Pedersen, Motamedi and Rosborg2000) and Karnland et al. (Reference Karnland, Olsson, Dueck, Birgersson, Nilsson, Hernan-Håkansson, Pedersen, Nilsson, Eriksen and Rosborg2009). The densities (kg/m3) of these specimens are shown for tests run at low strain rates.

Fig. 4. Deviator stress at failure as a function of strain rate of specimens mainly of MX-80 (filled blue and all unfilled symbols) and of DepCaN (red symbols). The densities follow from the legend or the data labels. Open symbols refer to previous studies by Börgesson et al. (Reference Börgesson, Johannesson and Hernelind2004) and Karnland et al. Reference Karnland, Sandén, Johannesson, Eriksen, Jansson, Wold, Pedersen, Motamedi and Rosborg2000, Reference Karnland, Olsson, Dueck, Birgersson, Nilsson, Hernan-Håkansson, Pedersen, Nilsson, Eriksen and Rosborg2009). All triaxial tests were run at rates of <0.0001%/s and test results at higher rates were obtained by unconfined compression tests or compression hammer (rates >1000%/s). The red line represents the relationship for Deponit CaN at the density 2050 kg/m3.
The relationship for Deponit CaN at density of 2050 kg/m3 was evaluated and plotted as a straight red line in the diagram, with n = 0.038 and the deviator stress at failure  $q_{\,f_{s0}}$ = 4300 kPa at the reference strain rate. Combining equations 9 and 10 results in the general equation 11, where
  $q_{\,f_{0s0}}$ is the shear strength at ν s = νs0 = 10–6 s–1 and the void ratio e = e 0.
 $$q_f\,(e,\nu _s) = q_{\,f0s0} \cdot \left( {\displaystyle{{\nu _s} \over {\nu _{s0}}}} \right)^{\rm n} \cdot \left( {\displaystyle{{e_{}} \over {e_0}}} \right)^{\textstyle{{\rm b} \over {\rm \beta}}} $$
Stress-strain relationship
The shape of the stress-strain relationship up to failure is very similar in all types of tests and for all bentonites. Examples of tests with different bentonite type, rate of deformation, test type and density are shown in Figs 5 and 6. The results from triaxial tests on Deponit CaN and MX-80Ca are shown in Fig. 5 and results from the unconfined compression test on MX-80 and Deponit CaN carried out at shear rates of between 0.003 and 300 mm/s, corresponding to strain rates between 0.0075 and 750%/s are shown in Fig. 6.
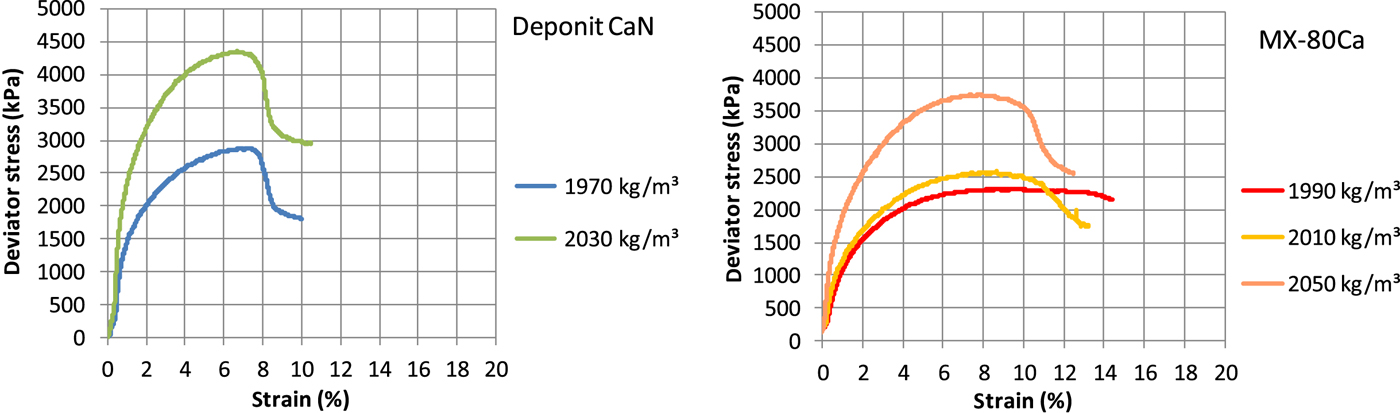
Fig. 5. Deviator stress as a function of strain from triaxial tests on specimens of Deponit CaN (left) and MX-80Ca (right).The labels show the densities of the specimens.
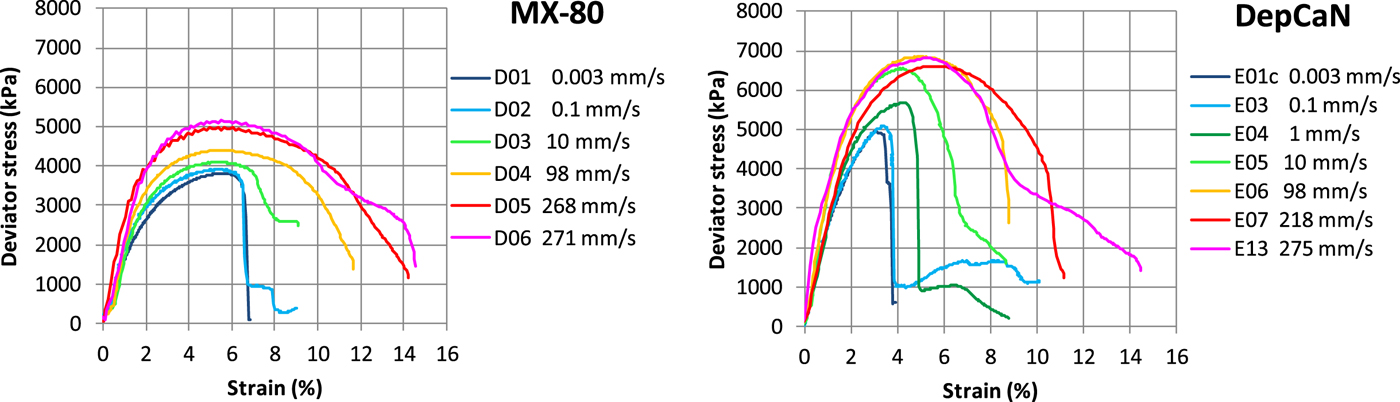
Fig. 6. Deviator stress as a function of strain from unconfined compression tests with shear rates of 0.003–300 mm/s. Test results of MX-80 with the density 2040 kg/m3 (left) and Deponit CaN with the density 2050 kg/m3 (right).
The deviator stress increases quickly and to about half of the maximum value and then begins to yield and reach maximum values, with a few exceptions, after 4–8% strain. The drop in deviator stress at large strain seen in the unconfined compression tests might have been caused by a lack of lateral support. As it is not readily marked in the triaxial tests where most of the results show long deformations and only a small decrease in stress after 10% of strain, the behaviour is considered as ideally plastic in the model.
REFERENCE-MATERIAL MODEL OF THE BUFFER
Based on observations, the stress-strain relationship in the material model yield a behaviour consisting of three parts as follows (Fig. 7): (1) linear elastic for strain 0 < ε < 1% with an elasticity that yields 58% of the maximum deviator stress at strain ε = 1% (black line in Fig. 7); (2) plastic hardening for strain 1% < ε < 5.3% with the maximum deviator stress determined from equation 10 (green line in Fig. 7); and (3) almost ideally plastic at ε > 5.4% (red line in Fig. 7).
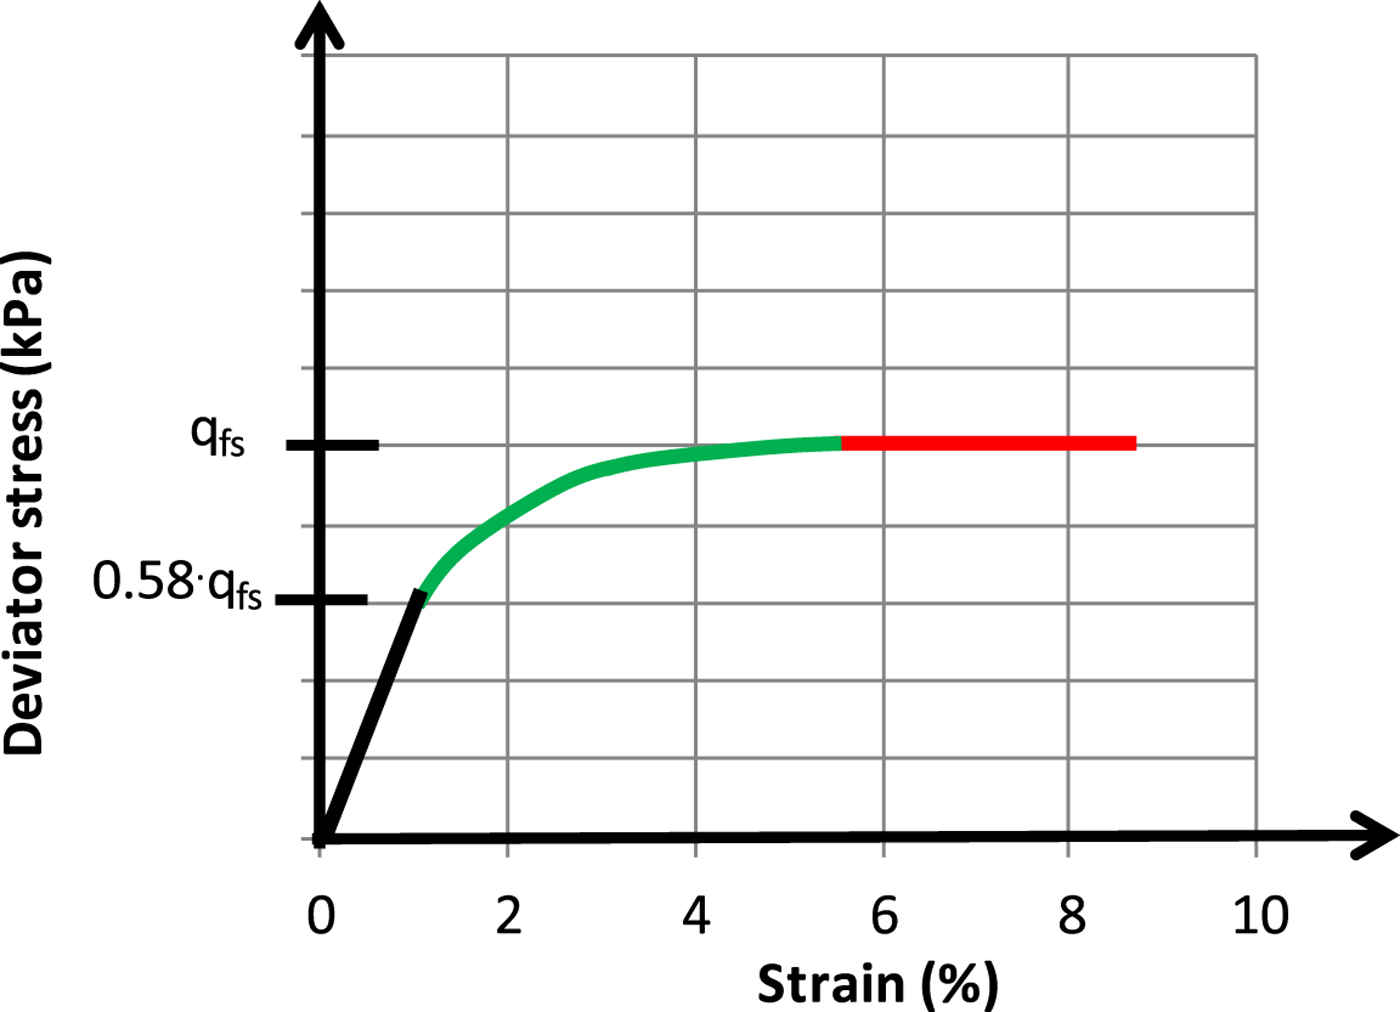
Fig. 7. Generalized stress-strain relationship used in the material model.
The material model of the bentonite is elastic-plastic with an E-modulus that determines the behaviour until the material starts yielding whereupon the plastic strain is modelled as a function of the deviator stress and is added to the elastic strain. The assumption that total stresses can be used in the model is confirmed by results of the triaxial tests. Passive triaxial tests (Börgesson et al., Reference Börgesson, Johannesson, Sandén and Hernelind1995; Graham et al., Reference Graham, Oswell and Gray1992) and the results of the present study (Fig. 2) show that the average effective stress does not change during shear, indicating that the strength always corresponds to the strength at the existing average stress before shear. Also included in the model is a strain-rate dependency of the stress-strain relation, which ranges between strain rates of 10–6 1/s < νs < 103 1/s.
The model does not include swelling because the shear is so fast that the bentonite is undrained and thus is modelled as virtually without volume change (Poisson's ratio v = 0.49). The model is a traditional associated elastic-plastic Mises model where the yield surface is defined by a table. Values are interpolated in the table based on the current plastic strain. The elastic-plastic material model has strain-rate dependent stress-strain relation, which is adapted to the buffer density. Therefore, different models must be used for different densities.
Because the possibility cannot be excluded that the exchangeable cations in the Na-dominated bentonite MX-80 are exchanged by Ca-ions and because the shear strength of the ion exchanged MX-80 is higher, the properties of the Ca-dominated bentonite, Deponit CaN, were used for the reference model. Tests on MX-80 in which Na was exchanged by Ca showed a slightly lower maximum deviator stress compared to Deponit CaN. There were few results from tests on MX-80Ca, especially at high strain rates, however, and the conservative choice was, therefore, to use Deponit CaN as the reference clay for the safety analyses in SR-Site (Hernelind, Reference Hernelind2010). Figure S1 (supplementary figure available online from DOI: 10.1180/clm.2018.15) shows the stress-strain relation of the model plotted for different strain rates for the reference clay Ca-bentonite at the reference density corresponding to the highest allowable density at water saturation 2050 kg/m3.
SCALE TESTS
The deposition hole in the tests was scaled to ~1:10, the diameter of the hole being 15.8 cm and the length 62.2 cm. The copper canister was simulated by a rod of solid copper 45.0 cm long and with a diameter of 8.0 cm. The permeable rock was simulated by means of a cylindrical bronze filter 2 cm thick. The filter was permeable enough to guarantee unlimited water supply for the bentonite without allowing bentonite to penetrate into the filter. It was also stiff enough to resist the swelling pressures and the local stress-concentrations during shear.
The cylindrical filter was surrounded by a cylinder made of acid-proof stainless steel. The cylinders were made in two 30 cm-long parts in order to locate the shear plane at the center of the canister, and to orient it perpendicularly to its axis. The cylinders were mounted rigidly to form a single unit in a steel frame during the water-saturation phase while one of them was free to move during the shearing phase.
In total, 18 sensors were installed to measure stresses and strains during saturation and shear: four force transducers to measure the required force during shear, three displacement transducers, six pressure transducers to measure the pressure at the clay/canister interface and at the clay/rock interface, and five strain gauges to measure strain on the ‘canister’ surface (Fig. S1). Two of the displacement transducers were used to measure the shearing of the modelled rock while the third was used to measure the movement of the end of the canister relative to the simulated rock. This was achieved using a copper tube that was fixed at the canister and passed through the filter and the steel cylinder. Figure S2 (supplementary figure available online from DOI: 10.1180/clm.2018.15) shows two pictures taken during mounting of the equipment and during shear.
The buffer was made from isostatically compacted MX-80 blocks with bulk density of ρ = 2140 kg/m3 and water content w = 9%. The pieces were sawed to fit the equipment with slots to the outer periphery to yield a final target density of ρ = 2020–2050 kg/m3 in water-saturated and expanded state. After mounting, the bentonite was saturated with distilled water via the filters.
The swelling pressure and the water inflow were measured continuously. Two months was sufficient to achieve steady-state conditions and no further water intake was recorded after that time. The tests were performed at room temperature without heating the canister.
Three shear tests were performed, each with different shear rate but otherwise at identical conditions. The relative displacements were very large compared to that considered in the safety analyses (4–6 times larger).
Test 1: shear rate = 0.031 mm/s and shear displacement = 28 mm
Test 2: shear rate = 1.9 mm/s and shear displacement = 30 mm
Test 3: shear rate = 160 mm/s and shear displacement = 21 mm
Upon completion of the shearing tests, the equipment was dismantled and the bentonite was sampled carefully to measure density and water content. The deformed canister was measured after the test. The measured average properties and swelling pressure are listed in Table 6.
Table 6. Measured average data of the bentonite after dismantling and sampling and average measured swelling pressure after wetting is complete.

MATERIAL AND FINITE ELEMENT MODELS
Material models
The laboratory tests described above yielded a material model that is a function of the density and the strain rate. The density is constant during the shear but the strain rate varies with time and location in the entire buffer material.
The material models used to simulate the scale test differed from the reference model described earlier, as the scale tests were performed with the Na-bentonite, MX-80. The material model is adapted to the density and an example at the density 2020 kg/m3 is given in Fig. 9 and Table 7. The calculations include five different densities and all data from the other densities were described by Börgesson & Hernelind (Reference Börgesson and Hernelind2010).
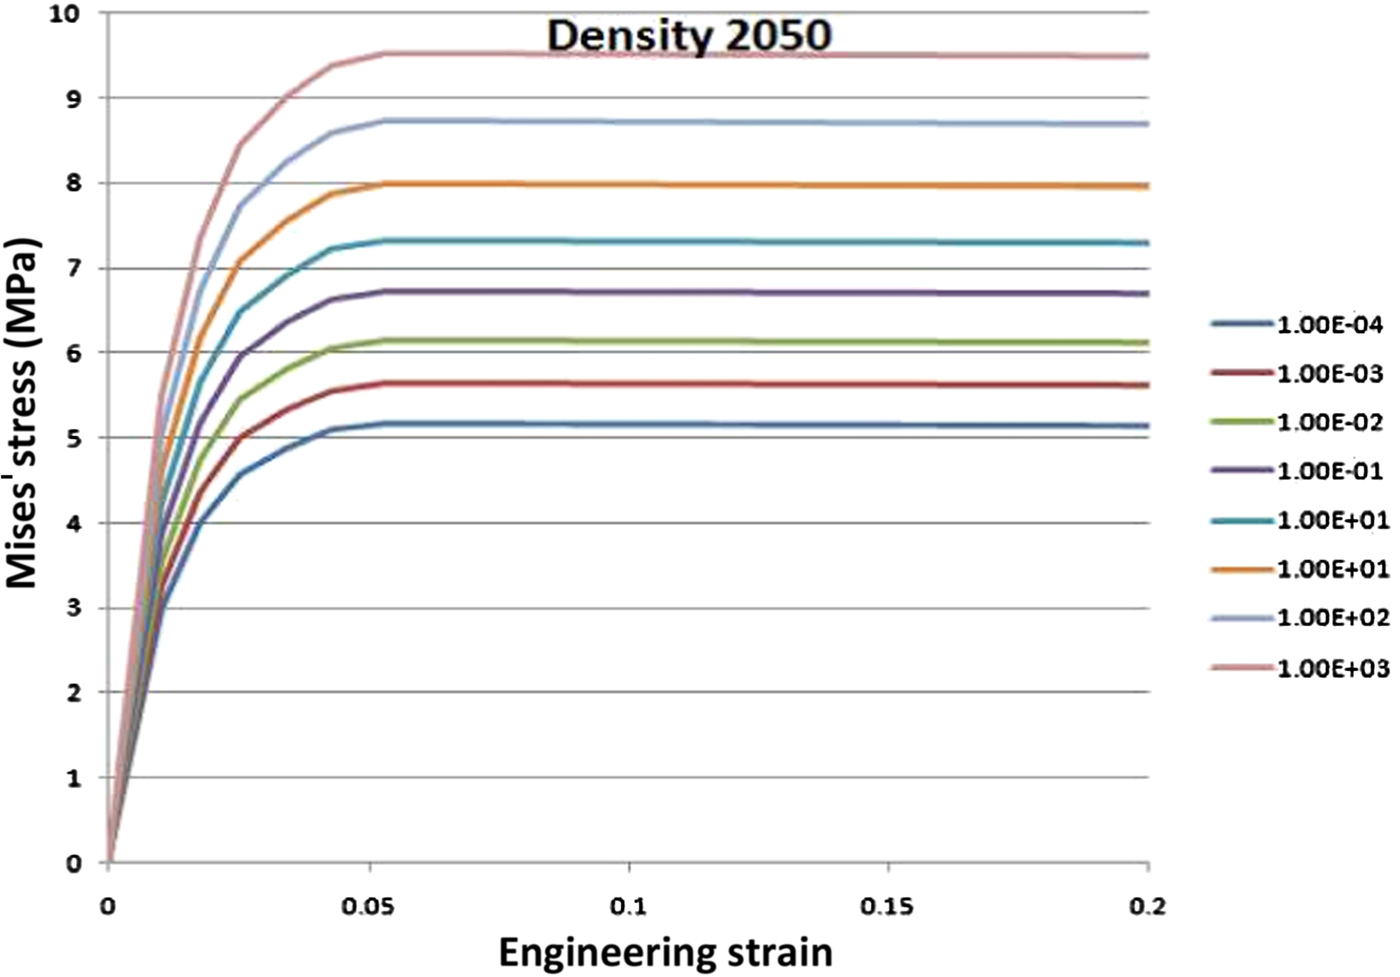
Fig. 8. Modelled stress-strain relation of Ca-bentonite at different strain rates (s–1) for a density of 2050 kg/m3. The deviator stress and the strain are shown as Mises’ stress (= deviator stress in triaxial and unconfined compression tests) and engineering strain.
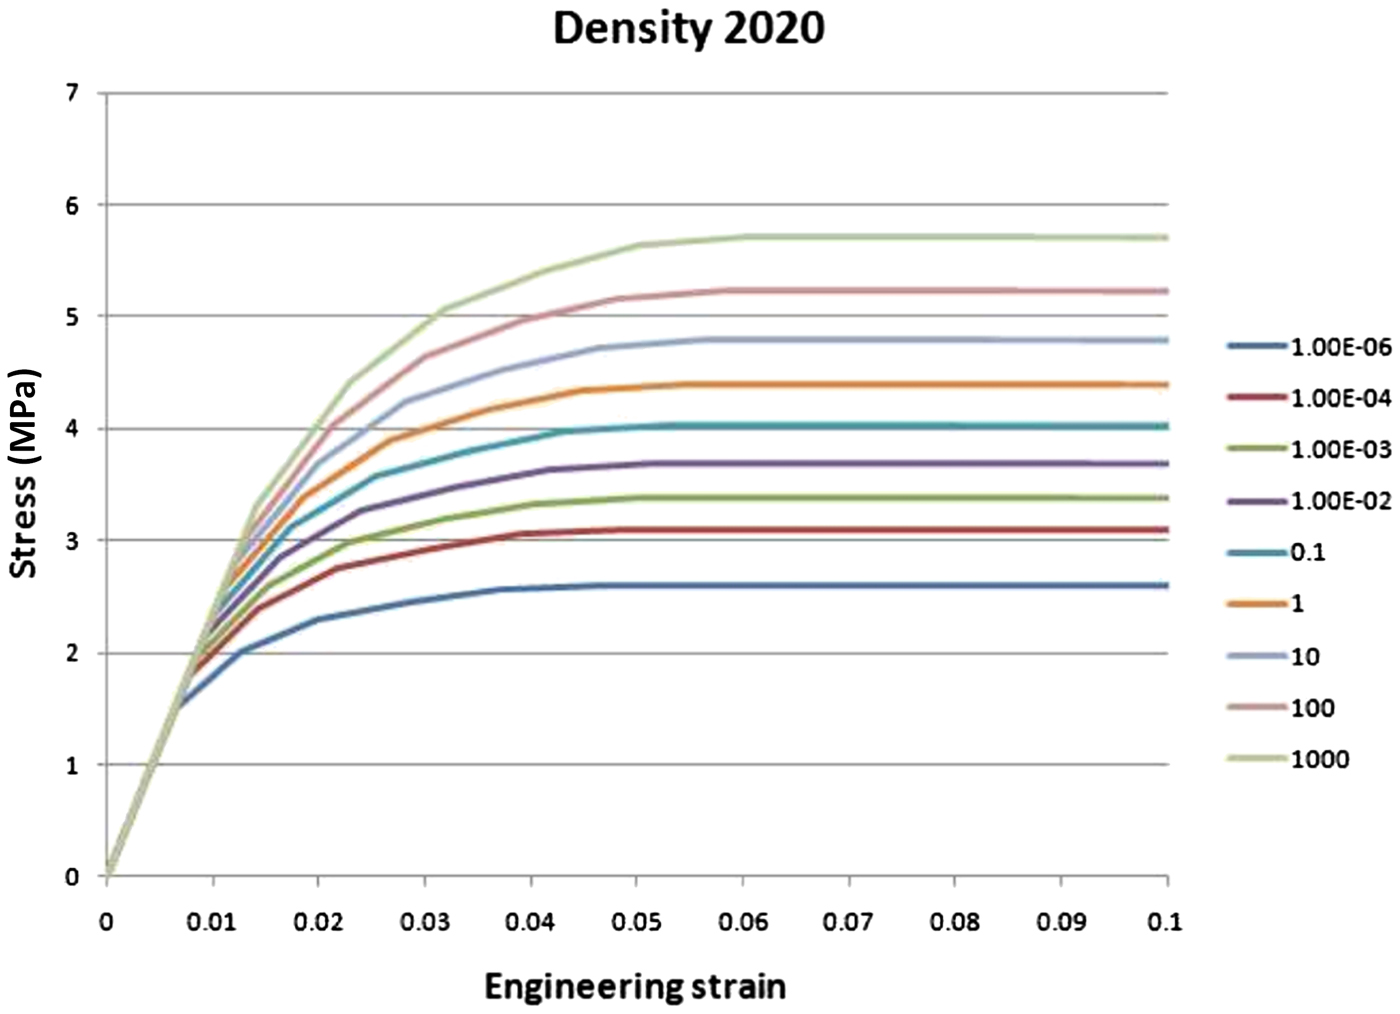
Fig. 9. Stress-strain model of MX-80 bentonite at various strain rates (s–1) at the density at saturation of 2020 kg/m3 plotted as Mises’ stress as a function of the engineering strain.
Table 7. Elastic-plastic material data for the bentonite buffer at the density 2020 kg/m3 (e = 0.745) and all strain rates.
The finite element code, Abaqus has a unique feature that allows for assignment of individual strain-rate dependant properties. The plastic properties of each element can be made a function of the strain rate of the element. The same properties were thus assigned to all elements but a condition related to the strain rate of the element was included. At each modelling step the strain rate was checked and the stress-strain relation was adapted according to the model. However, because this feature does not allow for changes in elastic properties but only plastic, a constant elasticity at the strain rate of 0.1 s–1 was used.
The material model of the copper is the same basic model with an elastic plastic strain-rate dependant stress-strain relation. The copper model is based on the results of tension tests (Fig. 10).
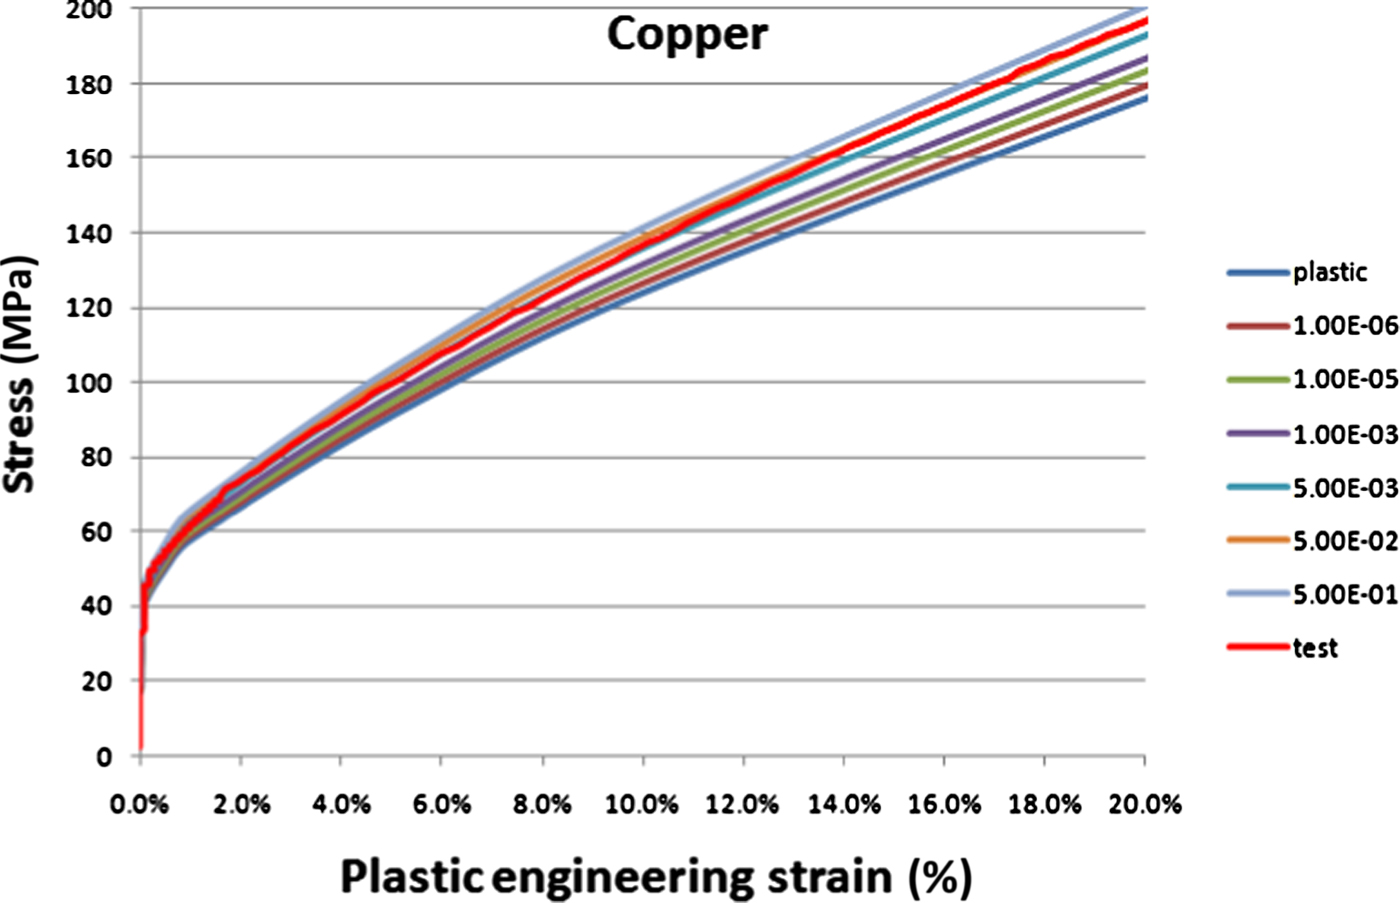
Fig. 10. Copper model plotted as Mises’ stress as a function of the engineering strain for various strain rates (s–1). The measured relationship at the strain rate of 5%/s is also plotted (denoted ‘test’) and is in almost complete agreement with the model for the same strain rate.
All the boundaries of the bentonite against the copper canister were equipped with contact surfaces. The contact surfaces have friction at sliding along the elements with no cohesion and the friction coefficient of 0.1, i.e. the friction angle ϕ = 5.7°. The contact is thus released if the total pressure perpendicular to the surface is lost. The friction angle, ϕ = 5.7°, corresponds to about half the friction angle of the bentonite at the actual densities, which has been derived from laboratory tests (e.g. see Börgesson et al., Reference Börgesson, Johannesson, Sandén and Hernelind1995).
Element mesh
The element mesh included the bentonite and the copper canister (Fig. 11). The confining steel tube was not modelled but instead all nodes at the outer boundary of the bentonite buffer had prescribed zero displacement simulating the lower fixed part of the steel tube and constant displacement rate of the upper half simulating the shear movement. The element size is ~5 mm × 5 mm × 5 mm, giving a total of ~50,000 elements. Eight-node elements with reduced integration were used. The mesh was refined with smaller elements close to the shear plane to better capture the strains at the interface between the fracture and the buffer.
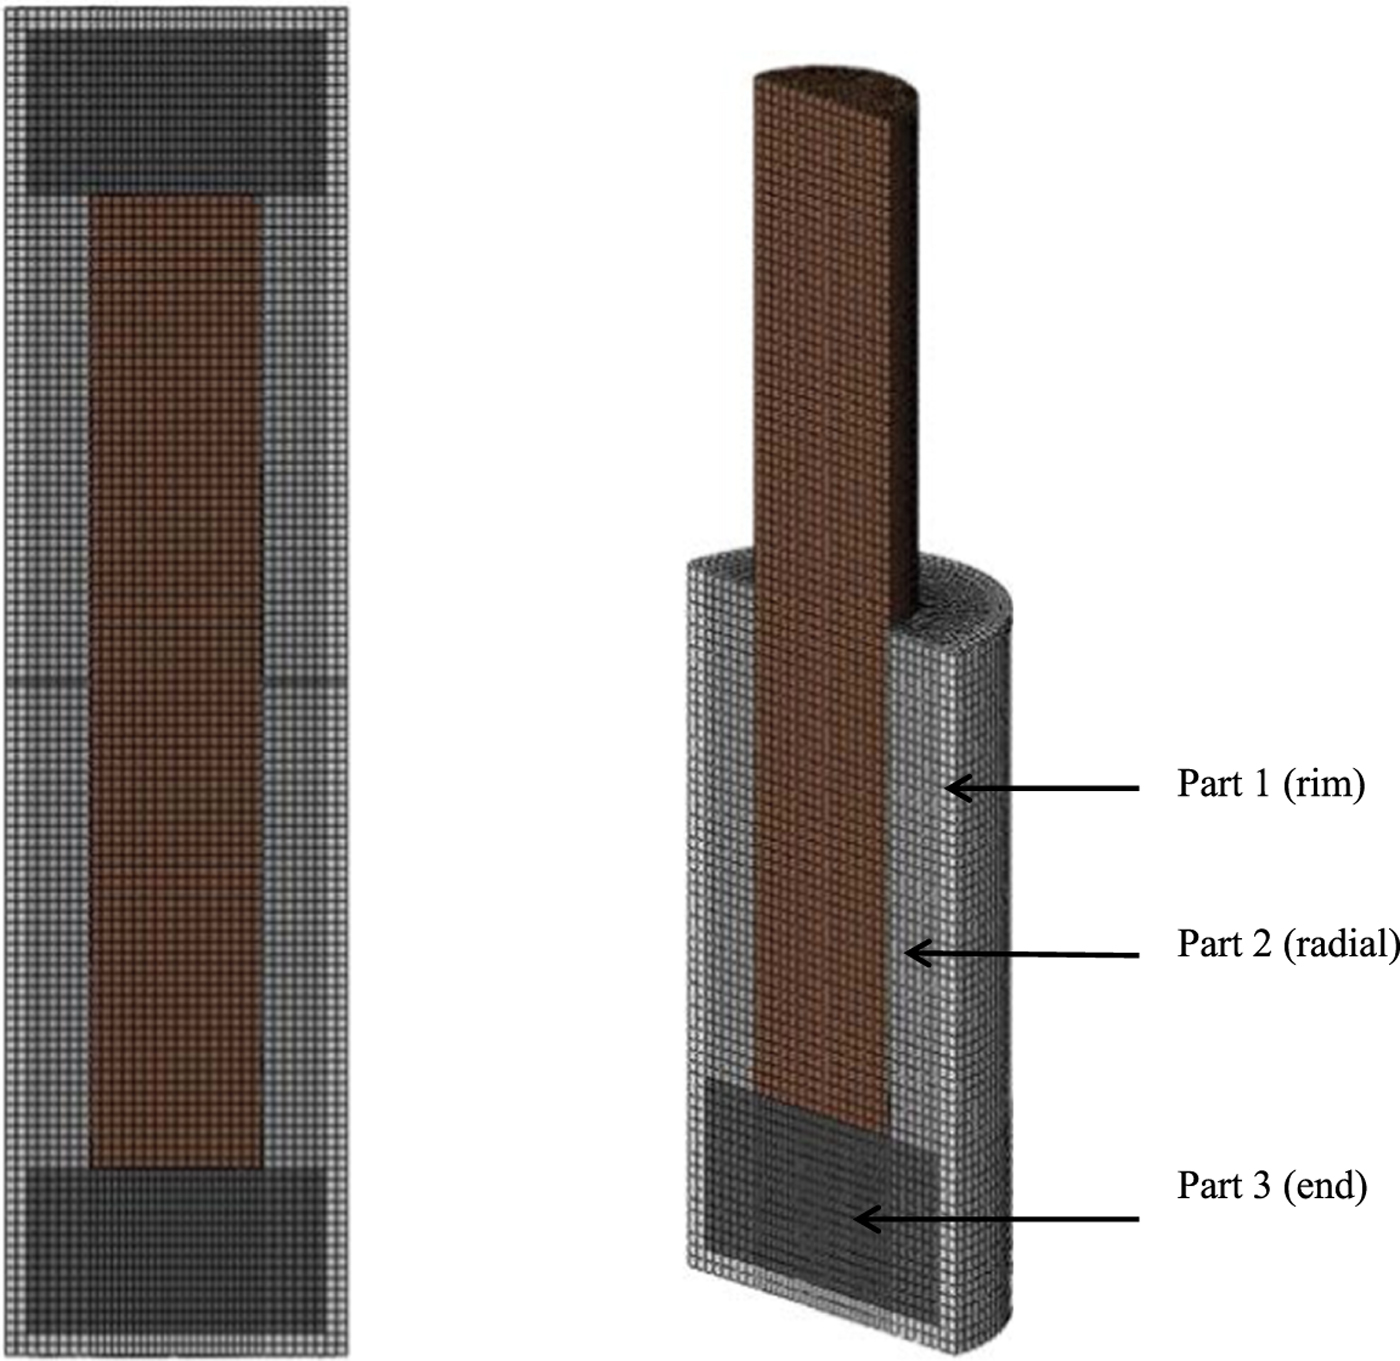
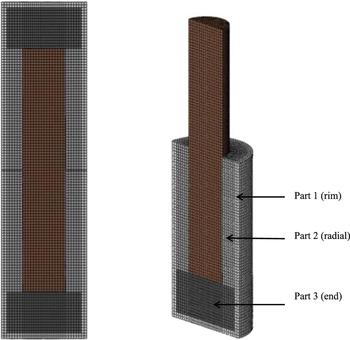
Fig. 11. The element mesh. The shearing part of the buffer is removed in the figure on the right. The various grey scales represent the three different bentonite densities used in the model.
Initial conditions
The buffer material was divided into three parts with different densities (Fig. 11) as the measurement of the density distribution after the detailed sampling at the end of the tests showed that the bentonite was not fully homogenized after completion of the water saturation. Part 1 is the 10 mm low-density outer rim, part 2 is the rest of the radial buffer outside the canister and part 3 corresponds to the buffer at the end sections.
The measured densities and density distributions were evaluated and the results yielded the densities shown in Table 8, which were used in the calculations. Two density distribution models were applied in the calculations: model A, which implies three different densities and model B with only one density corresponding to the average density in each test. In this way, the influence of the inhomogeneities could also be evaluated.
Table 8. Densities used in the calculations.

MODELLING RESULTS AND COMPARISON WITH MEASUREMENTS
Modelling results
The Abaqus code, version 6.9-1 was used for the calculations. The influence of strain rate on the shear stress was taken into account by using the rate-dependent stress-strain model valid for the specified densities. Large strains and large displacements are considered in the code.
The calculations were performed in two steps. At first the swelling pressure (10 MPa) was applied as the initial conditions for the stress tensor and then the shear phase started and was run with the actual shear rate until about the same displacement was achieved as in the different tests as shown above. Six simulations were performed. Each of the three tests was modelled with both model A with three densities and with model B with one density.
The deformed mesh at the end of the test for Test 3 is shown in Fig. 12. The canister was bent with almost no tilting. The average stress increased from 10 MPa to >30 MPa in the active parts and decreased to <2 MPa in the passive parts. A gap was formed between the bentonite and the canister in the passive part although the average stress is positive, because the stress perpendicular to the surface was zero. There was insufficient time for the bentonite to swell and fill the small gap because the shear was very fast and the hydraulic conductivity was too low; this was modelled by using v = 0.49. However, within a decade, the swelling of the bentonite in a deposition hole is expected to fill the gap and homogenise the density and the stresses in the buffer.
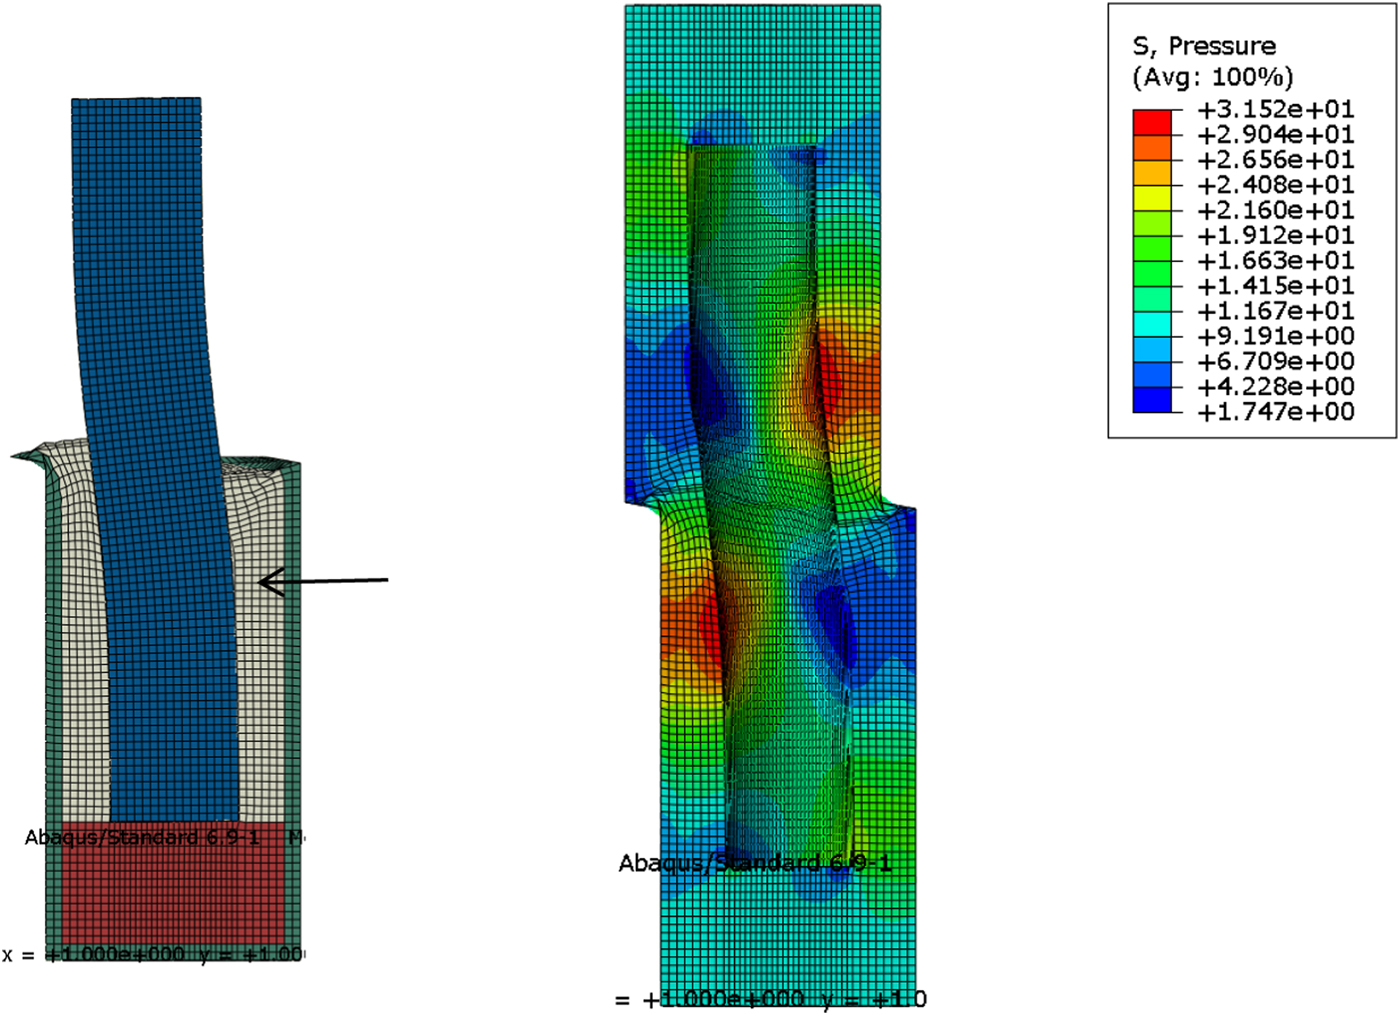
Fig. 12. Deformed mesh results after 23 mm shear displacement for Test 3. The figure on the left shows the mesh with the upper part of the buffer removed and the figure on the right shows the average stress in the bentonite (MPa). The arrow indicates that the bentonite/canister contact is lost.
The plastic strain in the copper and bentonite for Test 3 is shown in Fig. 13a. The plastic strain in the most stressed parts of the copper is >4% and the plastic strain locally is several hundred % in the bentonite. The plasticity in the bentonite is concentrated in the shear zone. The bentonite around the top and bottom of the copper ‘canister’ is scarcely affected, indicating that the bentonite is so stiff that it keeps the copper bar in a stiff grip that prevents it from tilting.
The plastic strain in the copper and bentonite for Test 1 is shown in Fig. 13b. The plastic strain in the copper is almost halved, whereas the plastic strain in the buffer is strongly increased compared to Test 3. This difference becomes apparent in the behaviour of the copper canister, which is strongly tilted in Test 1 unlike in Test 3. The reason for this difference is the greater stiffness of the bentonite resulting from the higher density and higher shear rate in Test 3 in comparison with Test 1.
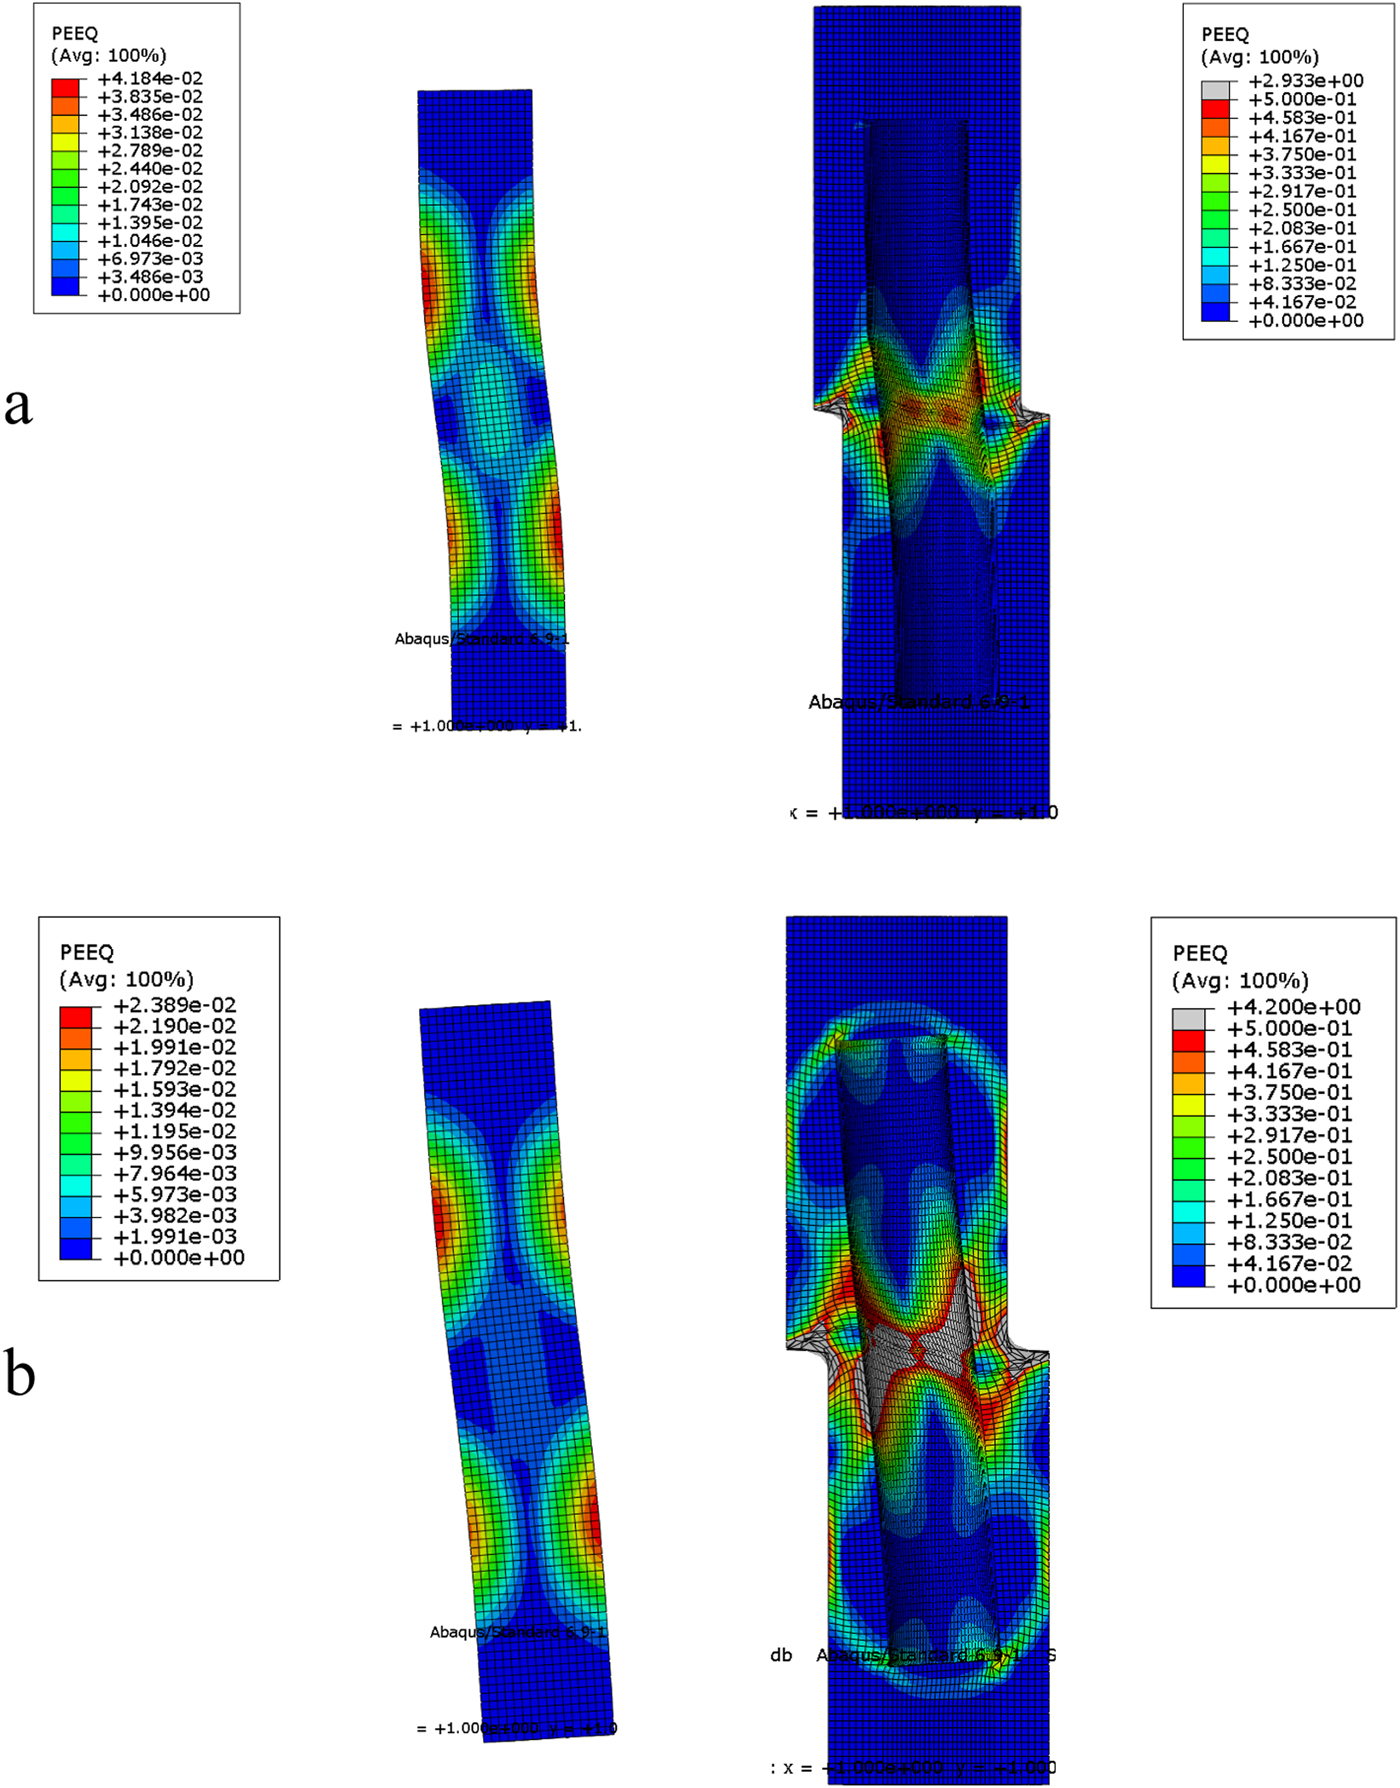
Fig. 13. (a) Deformed mesh results after 23 mm shear displacement for Test 3, showing the plastic strain (referred to as PEEQ) in the copper and in the bentonite. The figure on the left shows the copper bar alone and the right figure shows the bentonite alone. (b) Deformed mesh results after 30 mm shear displacement for Test 1. The figures show the plastic strain (referred to as PEEQ) in the copper and in the bentonite. The figure to the left shows the copper bar alone and the figure to the right shows the bentonite alone.
The magnitude of the strain rate, which, in combination with the density, determines the stress-strain relationship, is illustrated in Fig. 14. The strain rate in different parts of the bentonite is shown as contour plots at the end of Tests 1 and 3. The strain rate is well inside the model limits shown in Fig. 9. For Test 1 a large part of the bentonite around the shear plane has a strain rate >5.0 × 10⁻⁴ s–1 and for the entire model the strain rate is between 2.3 × 10⁻⁸ s–1 < dε/dt < 6.3 × 10⁻³ s–1. For Test 3, a large part of the bentonite around the shear plane has a strain rate of >1.0 s–1 and for the entire model the strain rate is between 1.6 × 10⁻⁴ s–1 < dε/dt < 50 s–1.
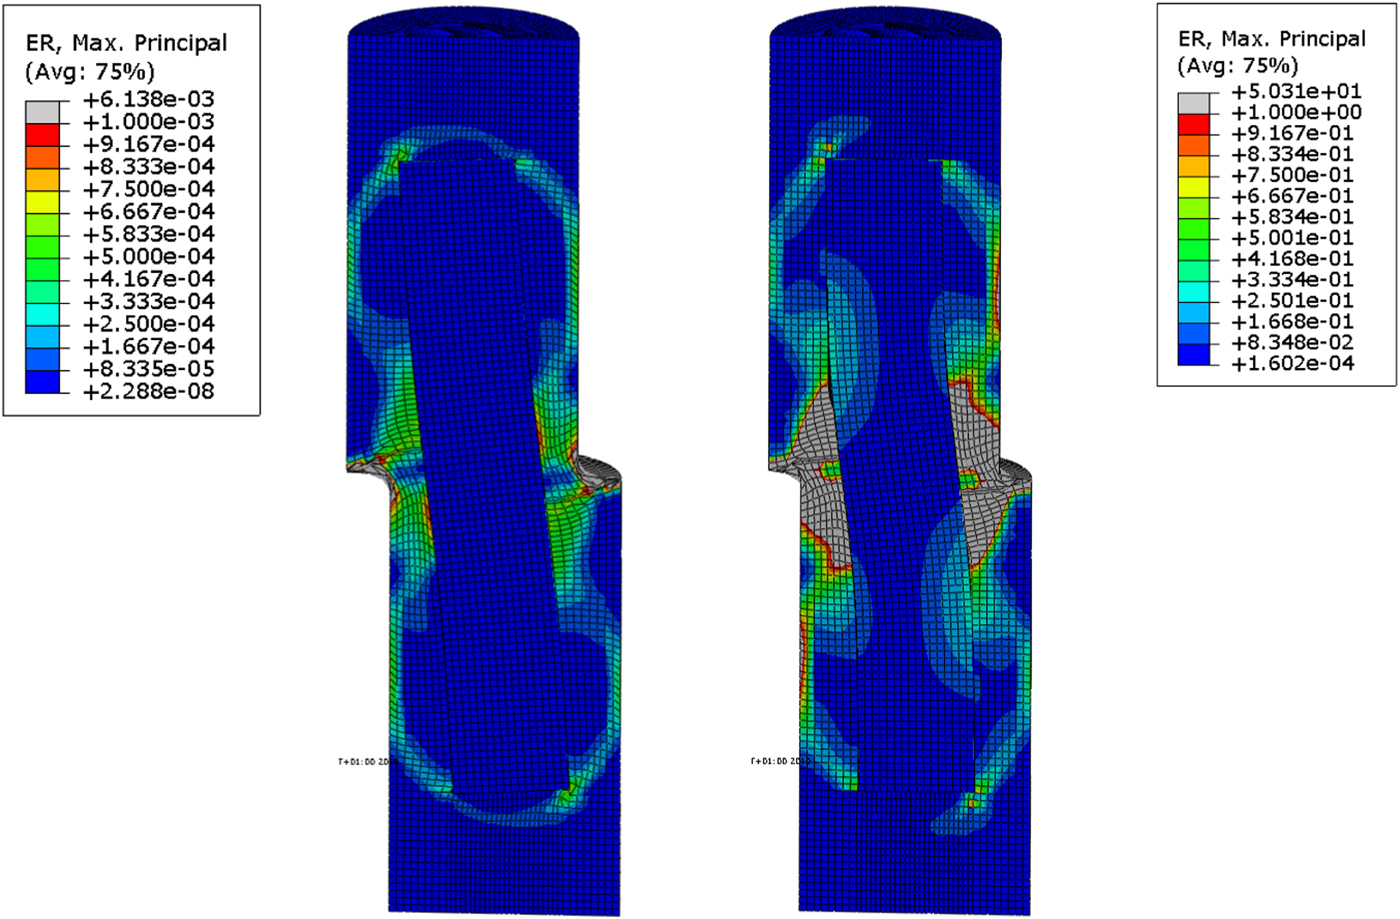
Fig. 14. Strain rate (s–1) (ER) at the end of Test 1 (left) and Test 3 (right).
Comparison with measurements
The modelled and experimental results have been compared for all three tests and the two density models (A and B). The results of the comparison are summarized and evaluated (see examples in Figs 15–17).
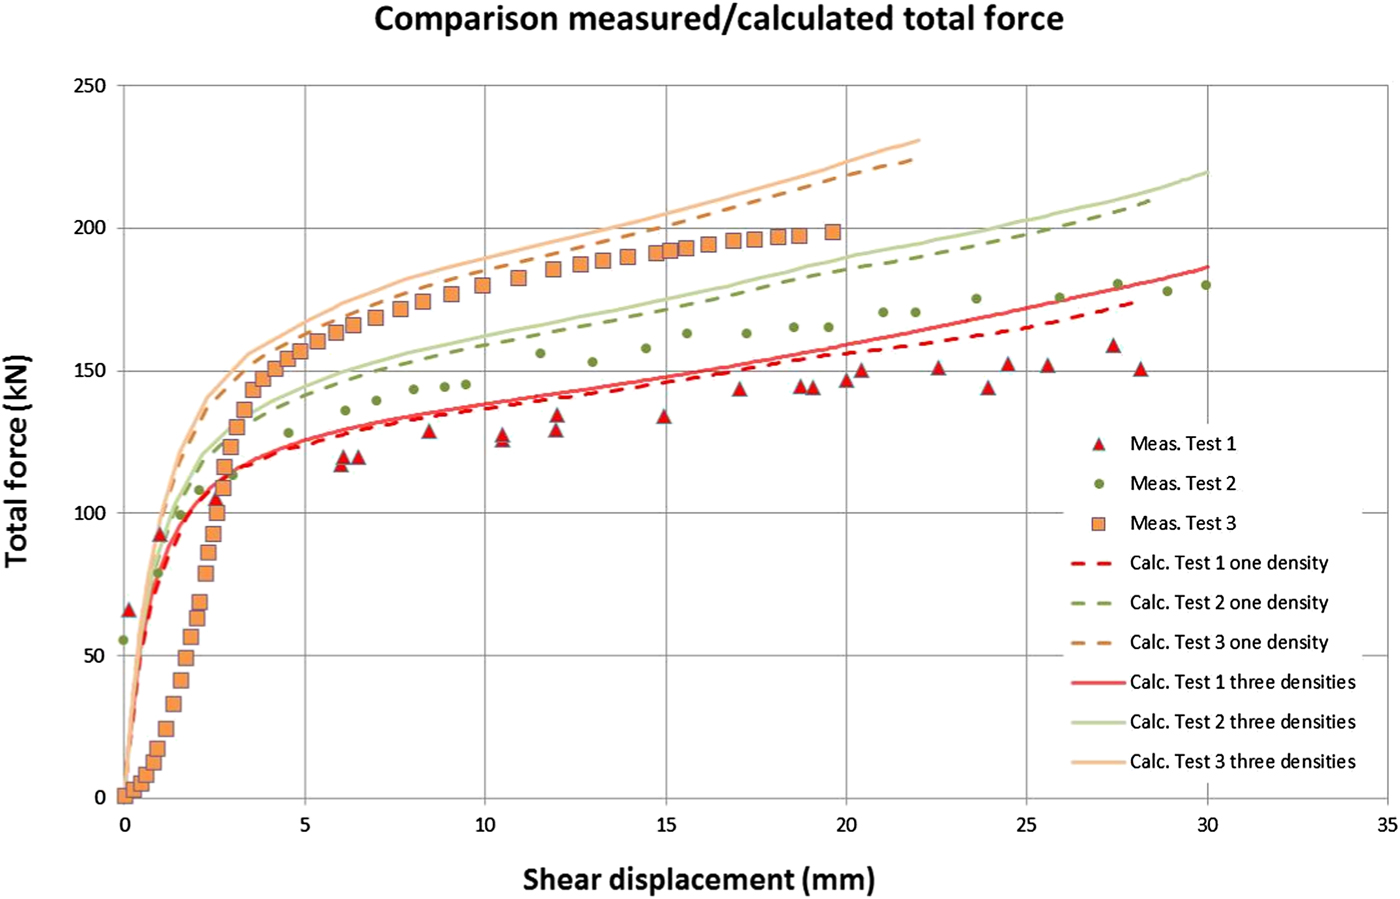
Fig. 15. Modelled and measured total force as a function of the shear displacement for all three tests. Both models are shown.
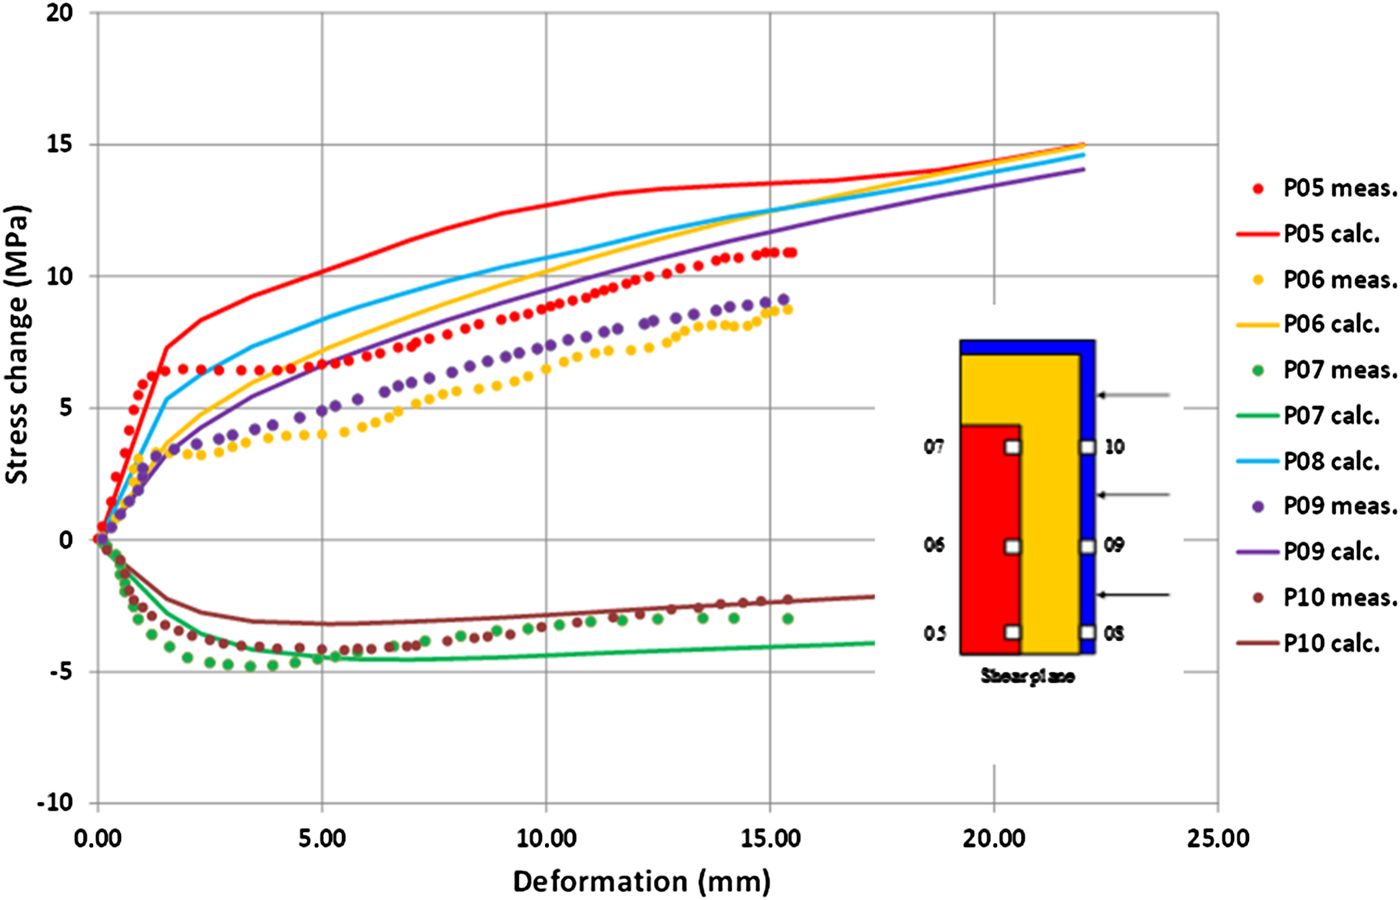
Fig. 16. Modelled and measured radial stress change in the buffer as a function of the total shear displacement for Test 3 (160 mm/s). Transducer P8 was out of order in this test. The locations of the stress transducers P05–P10 are also shown.
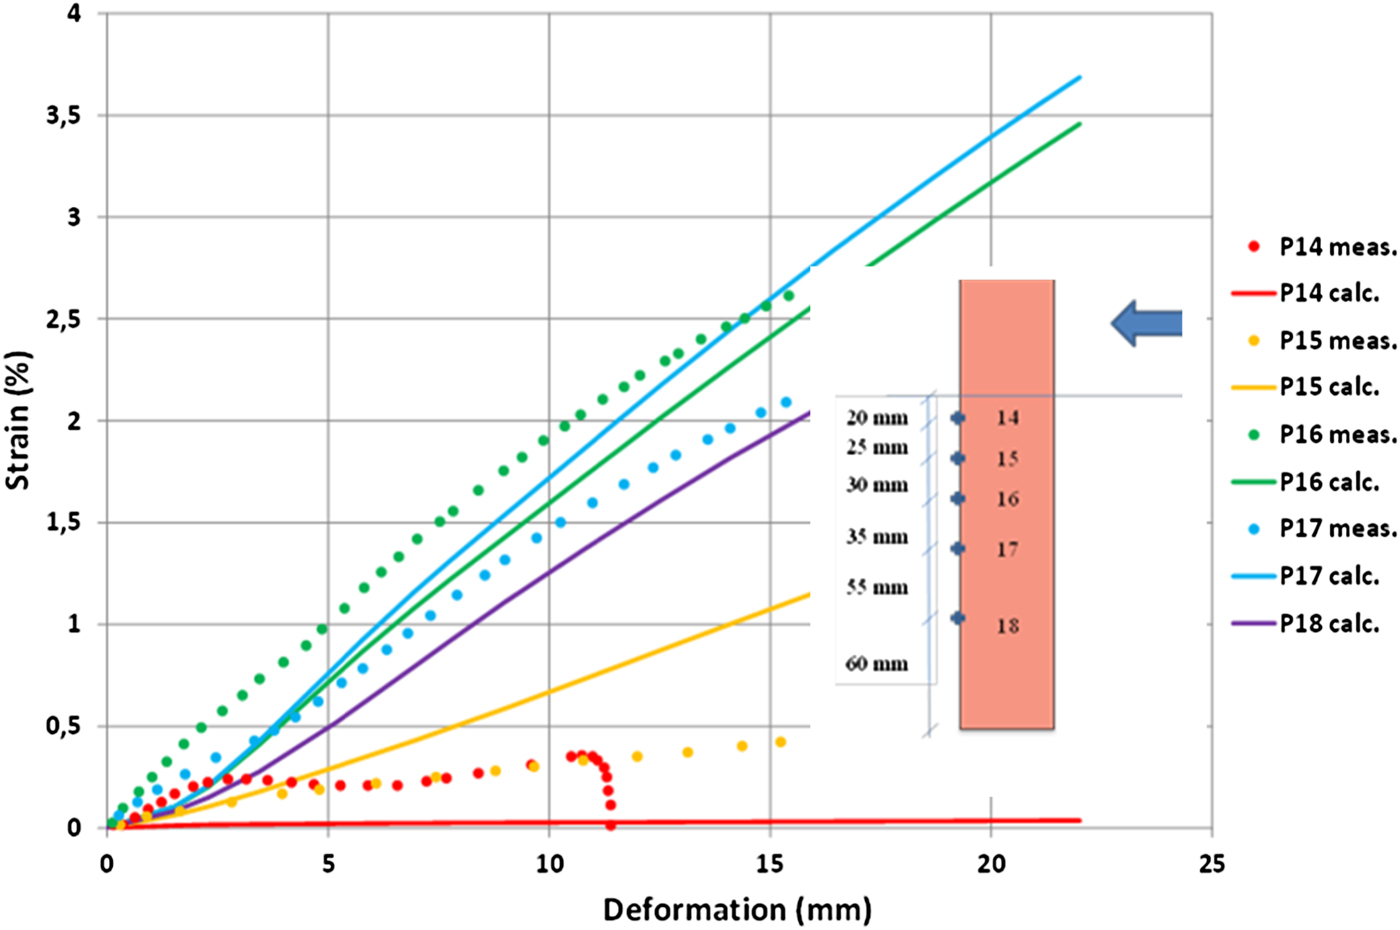
Fig. 17. Modelled and measured axial strain in the canister surface as a function of the total shear displacement for Test 3 (160 mm/s). Transducer P18 was out of order in this test. The locations of strain gauges P14–P18 are also shown.
A comparison between modelled and measured total force on the sheared half throughout the test (Fig. 15) shows that:
• The shear process seems to be well modelled as the shape of the curves is similar with, at first, a quick increase in force until about 3 mm shear and then a slow almost linear increase until the end of the test.
• The magnitude of the calculated force agrees well with the experimental values although the modelling yields a slight overestimation of force for all tests.
• The influence of the bentonite density and the shear rate is reflected in both the modelled and measured force. The force increases as would be expected with increasing test number as both the density and the shear increase likewise.
• The difference between the two density models with three different densities (Model A) and one average density (Model B) is very small.
• The very fast Test 3, which was finished in ~1 s, showed worse agreement, with a delay in measured initial response and a lower increase in force at the end of the test. The reason for these deviations is not clear. The initial delay, which was not expected, may have been caused by loose contacts between the different parts of the test device, which is sometimes seen also in triaxial or uniaxial tests.
The overall result is that the total force as a function of the shear deformation is well modelled for all three tests in spite of a slight overestimation.
A comparison between modelled and measured radial total stress change on the ‘canister’ and the ‘rock’ surface in Test 3 is shown in Fig. 16. The other two tests showed similar results. Total stress is measured at three locations on the ‘canister’ surface and at three locations on the ‘rock’ surface (Fig. 16). Note that:
• Transducers 5, 6, 8 and 9 located rather far from the top of the canister, yield increased stress according to both the calculations and the measurements while the two upper transducers (7 and 10) yield decreased stress. This is expected because the canister tends to rotate during shear.
• The individual transducers that yield increasing stress (5, 6, 8 and 9) do not differ significantly according to the calculations, in agreement with corresponding measurements. Note that these measurements are difficult to obtain because the bentonite is very stiff and is not allowed to swell during the fast shear so valve formations may occur at the contact with the transducer.
• The average of the measured positive stress agrees fairly well with the calculated values although the stresses are slightly overestimated in Test 3 (Fig. 16).
• The measured decreased stress of transducers 7 and 10 is well represented in the modelling.
The overall conclusion of the comparison is that the agreement between measured and modelled stresses is surprisingly good, both regarding trends and values, considering the problems associated with this type of measurements.
The comparison between modelled and measured axial strain in the copper in Test 3 is shown in Fig. 17. The other two tests showed similar results. Strain is measured by strain gauges glued to the copper surface (Fig. 17). These measurements may be subjected to many sources of errors as the strain gauges were glued to the copper surface without an opportunity to check or calibrate them. In addition, they were exposed to the swelling pressure of ~10 MPa and any displacement of the bentonite relative to the copper may affect adversely the results. The experimental results also suggest that there have been problems for many of the strain gauges and some did not yield signals. Gauges 16 and 17 seemed to work properly for all three tests; they also yielded the largest strain, both according to the measurements and the calculations.
A comparison of the results of strain gauges 16 and 17 showed that both the shape and the magnitude of the curves agree well between modelled and measured results, when plotting the strain in the copper ‘canister’ surface against the total shear displacement. The results for these strain gauges also agreed well in the other two tests, suggesting that the stress-strain processes in the copper canister are rather well modelled.
The deformed mesh in Test 1 and photos of the test taken after shear are shown in Fig. 18. After the tests the ‘canisters’ were measured thoroughly and the bending was noted as the parallel displacement of the end parts as shown (Fig. 18). The copper ‘canister’ tilts and is bent in Test 1. In both the tests and in the modelling the tilting was noted to have reduced and the bending increased with increased stiffness of the buffer (caused by increased density and shear rate). In the very quick Test 3, with high density, there was scarcely any tilting but significant bending.
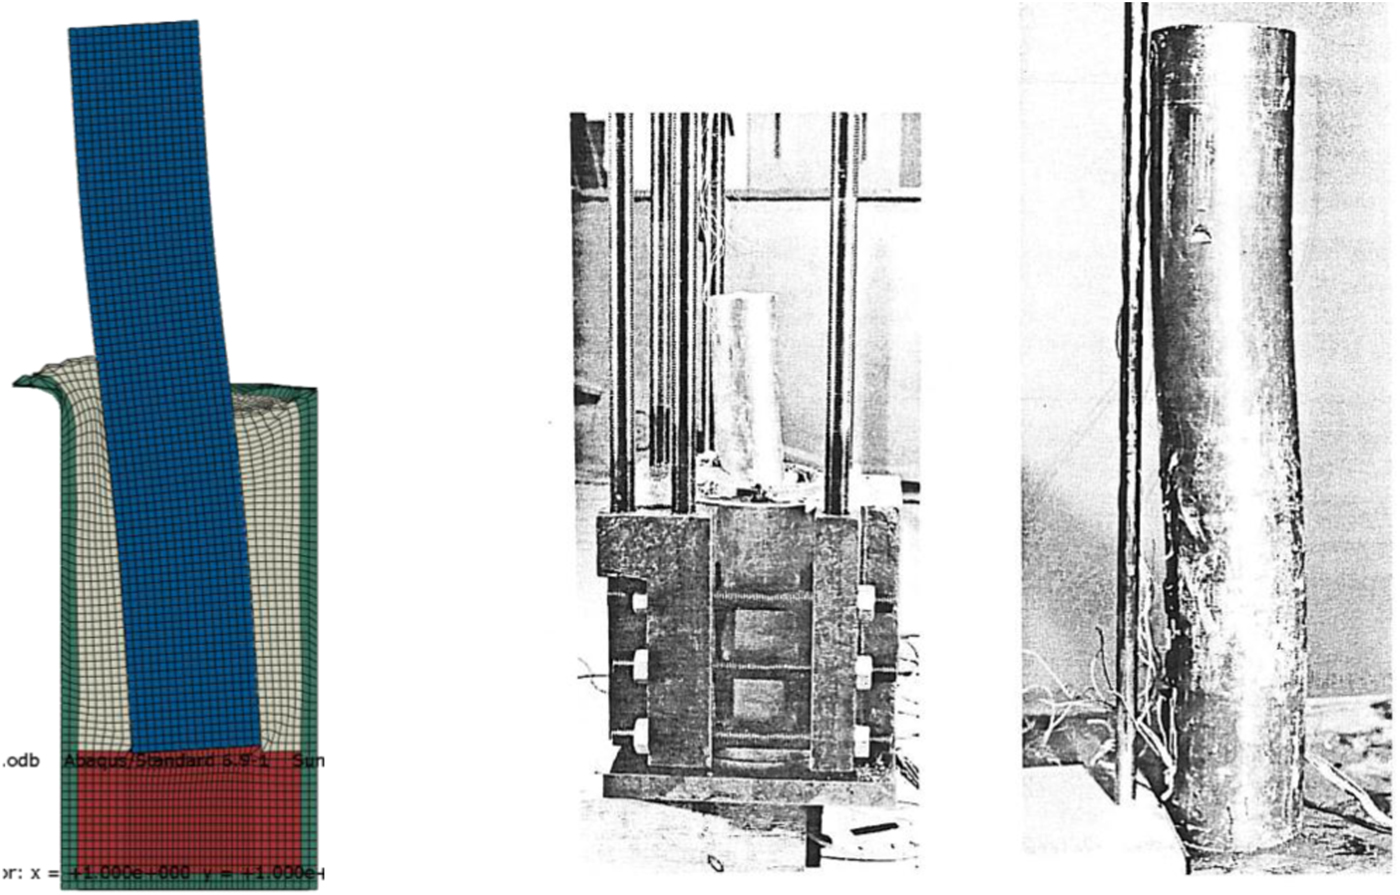
Fig. 18. Test 1 at the completion of shearing. Modelled result and images of the deformed canister taken during excavation when half the bentonite and the upper steel cylinder had been removed and during measurement of the deformed canister.
The comparison of the results after 15 mm shear displacement and the ratios between calculated and measured are listed in Table 9. The agreement between calculated and experimental values is generally good with a difference of <10% with a few exceptions. In the three cases where the difference is greater, the calculated values were greater than their measured counterparts. The axial buffer displacement noted in the table corresponds to the maximum axial displacement of the shear plane after shear. Moreover, there is little difference, generally <2%, between the two types of models (Table 9). The largest difference was noted for the canister bending of Test 1, but this could be explained because the calculation of the one density case only was run to 90% of the complete test.
Table 9. Comparison between calculated and measured results at 15 mm shear displacement.

1Average of transducers 5, 6, 8 and 9.
2Transducer 6 excluded.
3Average of transducers 16 and 17.
4Only 27 mm shear displacement.
5End of tests.
CONCLUSIONS
The material model described in this study was based on a model presented previously, which was updated according to results from new tests. The bentonite was modelled as elastic-plastic material with a deviator stress that is rate dependant and with no volume change during shear.
The three model tests of rock shear through a deposition hole that were performed in 1986 were modelled with the same finite element program, Abaqus, a similar finite element mesh, the same modelling technique, the same contact conditions (between different materials) and the same material models as used for the SR-Site calculations of the present scenario. The modelling results were compared with the measured results of the tests and were found to agree well for all three tests.
The calculations were performed without changes or adaptations of material models or parameter values in order to obtain agreement with experimental results. Exactly the same models and calculation techniques were used in a similar manner as in the modelling of the effect of full-scale rock shear through a deposition hole at different scenarios for the SR-Site. The only difference was that the SR-Site calculations were done with a buffer-material model that corresponds to the expected properties of Ca-exchanged MX-80 bentonite, which means greater shear strength than applied for the scale-test modelling. The calculations of the three model shear tests and the comparisons made in this report can thus be considered to validate the SR-Site modelling of the rock shear scenario.
A lower residual strength could not be included in the model for numerical reasons. The material model had constant stress after failure but the good agreement between calculated results and test results show that the influence is small. In addition, the modelling can be done with the simplified assumption that the bentonite buffer between the canister and the rock is homogeneous with only one average density, without considering the density difference between the bentonite close to the rock surface and close to the canister, which is caused by incomplete homogenization after swelling has been completed.
SUPPLEMENTARY MATERIAL
The supplementary material for this article can be found at https://doi.org/10.1180/clm.2018.15.
ACKNOWLEDGEMENTS
The present study was funded by the Swedish Nuclear Fuel and Waste Management Company (SKB).