


 ratings of foreign-accentedness, fluency metrics. We find that vocabulary measures show low to medium correlations with fluency metrics and ratings of foreign-accentedness, but not with vowel metrics. We then turn our attention to the impact of research methods on the study of vocabulary and pronunciation. More specifically, we discuss the possibility that these results are due to pitfalls in vocabulary and pronunciation indices, such as the failure of Dialang to take into account the effect of L1-L2 cognates, and the lack of measures for evaluating consonants, intonation and perception skills.
1. THE RELATION BETWEEN VOCABULARY KNOWLEDGE AND SECOND LANGUAGE (L2) PRONUNCIATION
In recent years, growing evidence has suggested that measures of L2 learners’ vocabulary knowledge are good predictors of overall L2 competence and, for this reason, vocabulary tests are often used for placement purposes or as a quick evaluation of L2 proficiency level (Milton, Reference Milton2009 and Reference Milton, Bardel, Lindqvist and Laufer2013; Meara, Reference Meara2010). Several studies have explored the relation between learners’ vocabulary knowledge and their competence in reading, writing, listening (e.g., Stæhr, Reference Stæhr2008; Milton, Reference Milton, Bardel, Lindqvist and Laufer2013) and (to a lesser extent) speaking skills (Hilton, Reference Hilton2008b). In most cases, measures of learners’ vocabulary size were found to correlate strongly with reading and writing skills (for example, scores of the Vocabulary Levels Test explain 72% and 52% of variance in the ability to obtain an average or above average score in a reading test and a writing test respectively, according to Stæhr, Reference Stæhr2008) and more moderately but still significantly with listening skills (explaining 39% of variance, according to Stæhr, Reference Stæhr2008). These results clearly reflect the fact that knowing a larger number of words in an L2 will result in better comprehension of a text and in better writing.
However, evidence about the potential correlation between learners’ vocabulary knowledge and speaking skills is scant (Hilton, Reference Hilton2008b), and the few studies that have ventured to explore this topic have usually found small correlations at best. Koizumi and In’nami (Reference Koizumi and In’nami2013: 902) reported on nine existing studies, most of which found smallFootnote 1 correlations between L2 vocabulary and variously defined speaking skills. The criteria for evaluating speaking skills vary across studies, including IELTS scores, grammatical accuracy, measures that relate to fluency (i.e. speech rate, length of utterances, number and length of pauses, presence or absence of hesitations markers, etc.) and most often composite scores obtained via rating scales and/or fluency measures. However, we find it striking that none of the studies examined pronunciation in terms of intelligibility, comprehensibility, foreign accentedness, accuracy or acoustic measures of phonetic detail (see below).
The lack of research in this domain may be due to the fact that L2 pronunciation is known to be affected by several linguistic factors (perceptual skills, degree of similarity of the sound systems between the first language (L1) and the L2, etc.) as well as by individual factors (age of onset in L2 learning, L2 exposure, motivation) (cf. Piske, MacKay and Flege, Reference Piske, MacKay and Flege2001), and that the link between vocabulary knowledge and pronunciation is not as straightforward as the link between vocabulary knowledge and reading comprehension or writing. However, research in L1 acquisition has shown that the development of the phonological and lexical components are related in monolingual children (Majerus, Poncelet, van der Linden and Weeks, Reference Majerus, Poncelet, Van der Linden and Weekes2008; Kern, Reference Kern2018), and some studies suggest a similar pattern for L2 late adult learners. Bundgaard-Nielsen, Best and Tyler (Reference Bundgaard-Nielsen, Best and Tyler2011a, and b) found that vocabulary size was associated with L2 vowel perception performance in adult learners, supporting the hypothesis that lexical development assists L2 phonological acquisition. We thus find it reasonable to believe that the relation between vocabulary knowledge and phonology may be reflected in pronunciation patterns (as well as in perception), given that a link between production and perception in the acquisition of L2 phonology has long been postulated (Flege, Reference Flege and Strange1995; Colantoni et al., Reference Colantoni, Steele, Escudero and Neyra2015) and revealed by many studies, both at the segmental and at the prosodic level (see Santiago, Reference Santiago2018, for more details). However, we are not aware of any research exploring this topic, with the exception of a very recent study on Japanese learners of L2 English by Uchihara and Saito (Reference Uchihara and Saito2019). These authors found significant correlations of the Productive Vocabulary Test (Lex30) score with native expert judgments of fluency, but not with native judgments of accentedness and comprehensibility.
In this contribution, we address the relation between vocabulary knowledge and pronunciation in L2 acquisition by analysing a corpus of 25 Italian learners of L2 French. After presenting our corpus in section 2, we discuss the methods and the issues affecting measurements of L2 learners’ vocabulary knowledge and pronunciation, and we illustrate our metrics (section 3). Finally, we present our findings (section 4) and conclude by discussing our results in the light of methodological issues in measuring L2 pronunciation and vocabulary knowledge (section 5).
2. THE CORPUS
2.1. The protocol and the participants
We focused our analysis on the Italian section of the ProSeg corpus (Delais-Roussarie et al., Reference Delais Roussarie, Kupisch, Mairano, Santiago and Splendido2018), which includes recordings of learners of L2 French from various L1 backgrounds. The 25 Italian participants were instructed learners of L2 French and were attending university courses ranging B1 to C1 at the time of recording. They were recorded with a professional unidirectional microphone at a sampling rate of 44 kHz and 16-bit quantization, while sitting in a sound-attenuated room at the University of Turin. The recording sessions lasted approximately 1 hour, and participants were rewarded with 6 euros upon completion. The protocol included the following tasks:
a read-aloud task of eight short passages (560 words in total);
a read-aloud task of a longer passage (359 words);
a picture description task (portraying a family event);
a monologue (telling a film/book/holiday, as chosen by participants);
Dialang vocabulary test;
a read-aloud task of seven short passages in L1 Italian (392 words) to be used as baseline data.
In the present study, we shall consider the score obtained in the Dialang vocabulary test as a metric of receptive vocabulary (cf. 4.1.1), data elicited via the picture description task for computing productive vocabulary metrics (cf. 4.1.2), and data elicited via the read-aloud task of 8 short passages in L2 French for computing pronunciation metrics (cf. 4.2).
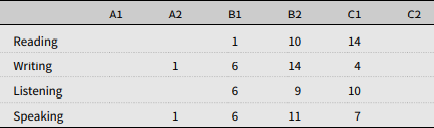
All learners provided written informed consent and filled in a questionnaire with information about their age (M = 25.28, SD = 3.7), gender (21 M and 4 F, a typical unbalance in L2 French courses in Italy), regional provenance (16 participants from Piedmont, nine participants from other regions of Italy), and relevant information about their acquisitional process. The age of first contact with French was on average 12 years (range: 6–21 years) and happened in a formal learning context for all participants. Six of them had participated in Erasmus exchange programmes in France, and the remaining participants except one had already been to a French-speaking country (median: 2 weeks, ranging from 1 week to 9 months). A larger number of participants claimed to regularly read and listen to French (n = 17 and 16, respectively), than to write and speak in French (n = 12 and 10, respectively). Table 1 illustrates self-reported language levels in the four skills.
Table 1. Self-reported level in the four skills (number of participants per level)
2.2. The annotation
As previously mentioned, the read-aloud task was used for the analysis of pronunciation in L2 French via acoustic measurements and native judgments (cf. 3.2). In this task, all participants read the same short passages describing common life events and short dialogues, ensuring that the data are balanced by number of vowels and consonants produced by each participant, as well as other linguistic variables (phonological context, frequencies of lexical items, etc.). In order to measure learners’ productive vocabulary, we used data from the picture description task. In this task, all participants described the same image (illustrating a family event), ensuring that vocabulary choices made by participants would not be influenced by other variables.
Data from both the read-aloud and the picture-description tasks were first transcribed orthographically in CLAN following the conventions of the CHILDES project (MacWhinney, Reference MacWhinney2000). For the read-aloud task, we naturally disposed of the original text passage, so the only manual intervention at this stage consisted in revising the text according to each speaker’s misreadings, repetitions and other minor reading issues. For the picture description task, we proceeded to the full orthographic transcription of the first 5 minutes of each participant’s production. We decided to limit the analysis to 5 minutes of speech, so that the results would not be biased by shorter vs longer productions by different learners. This resulted in an average of 522 word tokens (SD = 128.18, range: 306–801) per participant.
The orthographic transcriptions were then converted into TextGrid format for acoustic analysis in Praat (Boersma and Weenink, Reference Boersma and Weenink2019). The expected phonemic transcription was generated from the orthography according to Parisian French phonology and forced-aligned to the audio signal with EasyAlign (Goldman, Reference Goldman2011), resulting in the automatic alignment of words, syllables and phonemes. Finally, all the material was manually checked by the authors, who fixed incorrect phoneme labels and imprecise phoneme boundaries. Care was taken to preserve phoneme labels that would correspond as closely as possible to L2 target phonemes for any given word, rather than to the actual phonetic realizations (for instance, /y/ in the French word <pull> sweater was transcribed as [pyl] even in cases where learners pronounced a vowel closer to [pul]). This annotation choice is crucial and was driven by the type of analysis planned (cf. 3.2.4). Phonemes associated with false starts, repetitions, hesitations and misreadings were marked for exclusion.
2.3. Data analysis
The annotated material was then used to compute measures of L2 vocabulary and pronunciation, as outlined in the next section. More specifically, we used the Dialang score (cf. 3.1.1) as an indication of learners’ receptive vocabulary size, and we computed various lexical diversity indices (cf. 3.1.2) on productions for the picture description task as an indication of learners’ productive vocabulary size. Annotated productions for the read-aloud task were used to obtain various L2 pronunciation metrics, namely ratings of foreign accentedness (cf. 3.2.1) and nasality (3.2.2), as well as acoustic measures of fluency (cf. 3.2.3) and of tense-lax vowel pairs (cf. 3.2.4). Since measuring L2 vocabulary and pronunciation presents several methodological challenges, the next section discusses such issues before presenting all our metrics in detail. The results of the analysis are presented in Section 4, first for vocabulary metrics, then for pronunciation metrics and finally by looking at the correlation between the two.
3. MEASURING L2 VOCABULARY SIZE AND L2 PRONUNCIATION: METHODS AND ISSUES
3.1. Assessing L2 vocabulary knowledge
Assessing the vocabulary knowledge of L2 learners is not an easy task. The first problem consists in defining what exactly is meant by vocabulary knowledge, since there are many levels at which an L2 learner may know a word (Henriksen, Reference Henriksen1999; Milton, Reference Milton2009; Nation, Reference Nation2013) and the process of learning words passes through various steps. The initial step consists in recognizing a word and potentially understanding one or more of its meanings; the second step consists in learning to use it; the third step consists in using it appropriately, e.g. in the right co(n)text and with its collocates, and extending it to metaphorical uses (Beck and McKeown, Reference Beck, McKeown, Barr, Camail, Mosenthal and Pearson1991: 792). The literature usually distinguishes between receptive (or passive) vocabulary (i.e. the set of words that a learner recognizes and understands) and the productive (or active) vocabulary (i.e. the set of words that a learner uses when writing or speaking (Henriksen, Reference Henriksen1999; Nation, Reference Nation2013)). Some methods have been proposed to quantify these two aspects of vocabulary knowledge (reception and production) in terms of size (i.e. number of known words) and are discussed below. Measuring the depth of vocabulary knowledge, (i.e. the degree to which a learner appropriately masters a given word) is an even more complex issue, which is beyond the scope of this article.
Various tests have been developed with the aim of estimating the size of learners’ receptive vocabulary, typically in the form of Yes-No vocabulary tests, such as the Eurocentres Vocabulary Size Test (Meara and Jones, Reference Meara and Jones1990), the Vocabulary Levels Test (Schmitt, Schimtt and Clapham, Reference Schmitt, Schmitt and Clapham2001), Dialang (Huhta et al., Reference Huhta, Luoma, Oscarson, Sajavaara, Takala and Teasdale2002; Alderson and Huhta, Reference Alderson and Huhta2005), the X_Lex Vocabulary Test (Meara and Milton, Reference Meara and Milton2003), which also has a French version (Milton, Reference Milton2006), and the Vocabulary Size Test (Beglar and Nation, Reference Beglar and Nation2007; Webb, Sasao and Balance, Reference Webb, Sasao and Ballance2017). Such tests typically consist of a list of words, usually sampled from a frequency list, for which the learner has to tick the words that (s)he knows, or that (s)he recognizes as real versus invented. While Yes-No vocabulary tests have been widely used for placement purposes and have a number of promoters (e.g. Meara, Reference Meara2010; Mochida and Harrington, Reference Mochida and Harrington2006), they have received criticism (Beeckmans, Eyckmans, Jessens, Dufranne and Van de Velde, Reference Beeckmans, Eyckmans, Janssens, Dufranne and Van de Velde2001; Eyckmans, Reference Eyckmans2004). First, they evaluate lexical knowledge as bipolar (know/not know) rather than on a continuum reflecting the learning process, and they do not allow to test knowledge of multiple meanings for a given word. Second, words are decontextualized, failing to test learners’ mastery to use them for communicative purposes. Additionally, many such tests do not take into account the effects of cognate words, by which some words may be unknown to learners, but are still familiar to them due to their similarity to L1 words. However, despite such objections, Yes-No vocabulary tests have been widely used in practice and in research and are still considered as a standard for estimating receptive vocabulary size. For this reason, in the present study we used the French Dialang vocabulary test (cf. 3.1.1).
Some tests have been developed with the aim of estimating the size of learner’s productive vocabulary, such as the Productive Vocabulary Levels Test (Laufer and Nation, Reference Laufer and Nation1999) in which learners have to complete cloze items surrounded by a sentence, or Lex30 (Meara and Fitzpatrick, Reference Meara and Fitzpatrick2000) in which learners are given one word and have to provide other related words. However, in second language acquisition research it is also common to estimate productive vocabulary size via measures of lexical diversity (i.e. the variety of words used by learners in written or spoken productions). The simplest of such measures is TTR (type/token ratio), which is the number of different words in a passage (types) divided by the total number of words in that same passage (tokens). Yet, TTR has the drawback of being heavily affected by text length: longer texts tend to have a smaller type/token ratio as many function words tend to be repeated over and over, meaning that TTR cannot be used to compare productions of different length. In order to avoid this pitfall, several more sophisticated measures of lexical diversity have been developed recently, the most widely used being vocd-D (Richards and Malvern, Reference Richards and Malvern1997; Malvern, Richards, Chipere and Durán, Reference Malvern, Richards, Chipere and Durán2004; McCarthy and Jarvis, Reference McCarthy and Jarvis2007), MTLD Measure of Textual Lexical Diversity (McCarthy and Jarvis, Reference McCarthy and Jarvis2010) and its variant with moving average MTLD-MA. Some authors (e.g., Nation and Webb, Reference Nation and Webb2011) have warned that actual use of words in oral or written productions varies according to many factors such as task type, task mode and learners’ motivation, so that even the most sophisticated measures may not accurately reflect vocabulary size. However, metrics such as vocd-D and MTLD have the advantage of being relatively easily available and practical, as they can be computed on any text or transcript without requiring learners to pass a specific test. This is probably the reason why they are widely employed in the literature as a measure of vocabulary size and have recently been used for the automatic classification of L2 learners into CEFRL levels (Arnold, Ballier, Gaillat and Lissón, Reference Arnold, Ballier, Gaillat and Lissón2018).
In the present study, we used four metrics of vocabulary size, namely the Dialang vocabulary test score as a measure of learners’ receptive vocabulary, and the vocd-D, MTLD and MTLD-MA indices of lexical diversity as measures of learners’ productive vocabulary.
3.1.1 Dialang test score
The Dialang system (Huhta et al., Reference Huhta, Luoma, Oscarson, Sajavaara, Takala and Teasdale2002; Alderson and Huhta, Reference Alderson and Huhta2005) is a battery of language tests for 14 languages (including French), and is widely used for placement purposes as well as for diagnosis of learning needs (Alderson and Banerjee, Reference Alderson and Banerjee2001). The system uses a preliminary Yes-No vocabulary test in order to select the appropriate subsequent language tests for a given test taker. Learners are shown 75 verbs in the infinitive form (some of them are pseudowords); their task is to decide which verbs exist and which are invented. The output score ranges from a minimum of 0 to a maximum of 1000, with the following equivalence set by Dialang authors: 0-100 for A1, 101-202 A2, 201-400 for B1, 401-600 for B2, 601-900 for C1, 901-1000 for C2. We used the online version of this test (available at https://dialangweb.lancaster.ac.uk/) in order to obtain a measure of learners’ receptive vocabulary size in L2 French.
3.1.2 Lexical diversity indices (vocd-D, MTLD, MTLD-MA)
In order to obtain an estimate of the size of learners’ productive vocabulary, we computed three of the most frequently used indices of lexical diversity, namely vocd-D (Richards and Malvern, Reference Richards and Malvern1997), MTLD (McCarthy and Jarvis, Reference McCarthy and Jarvis2010) and its more recent version MTLD-MA. Although there is still no consensus about which of these metrics provides the best estimate of lexical diversity, all of them are meant to neutralize the effect of text length (which is known to have an impact on simpler measures of lexical diversity such as TTR, see McCarthy and Jarvis, Reference McCarthy and Jarvis2010, for a detailed discussion and a comparison of the various metrics). We computed them on orthographic transcriptions of learners’ productions for the picture description task after excluding non-lexical realizations (filled pauses, slips of the tongue, unrecognizable words, etc.). Vocd-D was calculated within CLAN, while MTLD and MTLD-MA were computed in R (R Core Team, 2019) via the MTLD command of the koRpus package (Michalke, Reference Michalke2018) with all parameters set to default.
3.2. Assessing L2 pronunciation
If assessing learners’ vocabulary size is a problematic task, measuring L2 pronunciation accuracy is certainly not simpler. In this case, the main problem is that no standard metric is available in the literature and that learners of different native languages clearly have different pronunciation problems and follow different development patterns (Flege, Reference Flege and Strange1995; Piske et al., Reference Piske, MacKay and Flege2001). Furthermore, it is debatable whether learners’ pronunciation should be evaluated in terms of nativelikeness (the extent to which they sound similar to native speakers, cf. Birdsong, Reference Birdsong2018; Bongaerts, Reference Bongaerts2003), intelligibility (the extent to which their speech is understandable), or comprehensibility (the amount of effort needed by a native listener to understand them) (Munro and Derwing, Reference Munro and Derwing1995). And in the case of nativelikeness, another complication consists in establishing what can be considered as learners’ model – something that is particularly relevant for languages with more than one standard variety of international prestige, such as (British vs American) English.
Scholars use listener judgments, fluency measures (Derwing, Rossiter, Munro and Thomson, Reference Derwing, Rossiter, Munro and Thomson2004) or acoustic measurements to assess L2 accuracy, each of these having advantages and drawbacks. For instance, listener judgments are often used to evaluate to what extent foreign-accented speech affects the intelligibility or comprehensibility of L2 speech (Munro and Derwing, Reference Munro and Derwing1995), but these are impressionistic evaluations and thus subjective. Fluency metrics do not offer any insight into learners’ pronunciation of vowels, consonants and intonation patterns. Finally, acoustic indices of pronunciation such as voice onset time (VOT: the span of time between the release of a plosive and the start of vocal fold vibration) have been used as an objective measurement of nativelikeness to assess fine-grained phonetic properties in L2 speech (cf. Flege, Munro and McKay, Reference Flege, Munro and MacKay1995), but this can only work if the L1 and the L2 differ in this respect: this is not the case for Italian learners of L2 French, given that both French and Italian have short-lag VOT.
In this study, we use various pronunciation metrics for L2 French that include acoustic measures, native judgments and fluency metrics. We believe that one of the originalities of this paper is represented by the variety of the L2 pronunciation metrics considered and, more specifically, by our vowel metrics. We propose vowel metrics that measure the degree to which vowel pair oppositions are kept apart in L2 French vowel realizations. This approach was recently proposed by Mairano, Bouzon, Capliez and De Iacovo (Reference Mairano, Bouzon, Capliez and De Iacovo2019) for L2 English, with the aim of measuring the acoustic distance and overlap of tense versus lax vowel pairs for L2 English (e.g., /i�?/ vs /ɪ/ and /u�?/ vs /ʊ/), and has not been applied to L2 French before. In this study we propose to use vowel pairs involving front rounded vowels versus their counterpart with which they are often confused by Italian learners, namely /y/ vs /u/, /ø/ vs /e/, /œ/ vs /ɛ/. These metrics indicate the degree to which the target vowel pairs are assimilated to a single phonological category in L2 productions by our learners. In addition, we computed traditional fluency metrics and also used native judgments of foreign-accentedness.
3.2.1 Ratings of foreign accentedness (FA)
Since our acoustic metrics focus on the pronunciation of vowels (cf. 3.2.4), we collected global ratings of FA in the effort to account for other parameters that may play a role, such as consonants and intonation patterns. We extracted eight sentences from every learner’s production for the read-aloud task. Three French native phoneticians provided ratings of FA for the resulting 200 utterances (8 utterances x 25 learners) on a 5-point Likert scale (1 = very strong foreign accent, 5 = no or very light foreign accent). They were left free to listen to the audio samples as many times as they wished. The intra-class correlation coefficient calculated on aggregated ratings was high (0.89, CI = 0.79-0.95).
3.2.2 Ratings of nasality for /ɛ̃/, /ɑ̃/, /ɔ̃/
In addition to rounded front vowels (cf. 3.2.4), a typical difficulty for Italian learners of L2 French is represented by nasal vowels /ɛ̃/, /ɑ̃/, /ɔ̃/, (and /œ̃/, which tends to merge with /ɛ̃/ for many speakers, cf. Fougeron and Smith, Reference Fougeron and Smith1999). Acoustically measuring nasality is complex (even more so with an automatic approach), as it involves accounting for the interaction of various cues (Delvaux, Metens and Soquet, Reference Delvaux, Metens and Soquet2002; Delvaux, Reference Delvaux2009), so we opted for expert judgments. We extracted nine words with /ɛ̃/, /ɑ̃/, /ɔ̃/ (/ɑ̃/: également, gens, résistant; /ɛ̃/ demain, magasin, main; /ɔ̃/: promotion, rayon, sinon) from every learner’s production for the read-aloud task. Three native French phoneticians (the same as in 3.2.1) provided ratings of vowel nasality for the resulting 225 samples (3 words x 3 vowels x 25 learners) on a 5-point Likert scale (1 = vowel is not nasalized or does not have the expected characteristics of height and frontness/backness, 5 = vowel is nasalized and has the expected value of height and frontness/backness). They were free to listen to audio samples as many times as they wished. The intra-class correlation coefficients calculated on aggregated ratings were 0.88 (CI = 0.77-0.94) for /ɛ̃/, 0.67 (CI = 0.35-0.84) for /ɑ̃/, 0.85 (CI = 0.72-0.93) for /ɔ̃/.
3.2.3 Fluency metrics (AR, SR, NP)
Oral fluency is a term that could be related to different cognitive skills of speech production in L1 and L2. Some researchers see fluency as an independent construct of L2 pronunciation (Thomson, Reference Thomson, Reed and Levis2015). However, in our study we use this term to refer to the rate and degree of fluidity of speech via quantifiable temporal cues and we assume that these temporal metrics describe some of the learners’ pronunciation skills. We computed traditional fluency metrics on learners’ productions, accounting for filled and unfilled pauses as well as for speech rate and articulation rate (Derwing and Munro, Reference Derwing and Munro2015). These were automatically extracted from the annotation with an ad hoc Praat script. We computed articulation rate (AR, phon/sec excluding pauses), speech rate (SR, phon/sec including pauses), and number of silent pausesFootnote 2 in the first 5 minutes of speech (NP, which was later inverted in order to correlate positively rather negatively with AR and SR).
3.2.4 Acoustic distance (D) and overlap (P) for /u - y/, /e - ø/, /ɛ - oe/ pairs
Finally, we devised a set pronunciation metrics aimed at evaluating the extent to which the problematic vowel pairs /u - y/, /e - ø/, /ɛ - œ/ are kept distinct in learners’ productions. In order to do so, we concentrated our analysis on the first three formants (F1, F2, F3), which are respectively the main acoustic correlates of the degree of aperture, frontness-backness and roundedness. We wrote a Praat script to automatically extract F1, F2 and F3 from the midpoint of every vowel produced by learners in the read-aloud task, using the Burg method and Praat’s default settings, in a band lower than 5.5 kHz for women and 5 kHz for men. In order to minimize the effects of detection errors, we applied filters for French vowels as per Gendrot, Gerdes and Adda-Decker (Reference Gendrot, Gerdes and Adda-Decker2016), but adapted them so that they would accept plausible values for either vowel in our target vowel pairs /u - y/, /e - ø/, and /ɛ - œ/ (see Ferragne, Reference Ferragne, Diaz-Negrillo, Ballier and Thompson2013, on the issue of filtering formants with L2 data). Such filters resulted in 16% of vowels being discarded, and a further 2.8% was lost due to hesitations, misreadings or slips of the tongue. In order to account for inter-speaker differences in vowel formants, we normalized values with Nearey’s intrinsic procedure (Nearey, Reference Nearey1978) as implemented in the phonTools 0.2–2.1 package (Barreda, Reference Barreda2015), and finally discarded realizations of any vowel other than /u - y/, /e - ø/, and /ɛ - œ/. This left us with 6651 observations for analysis.
As a first acoustic metric, we computed Euclidean distances (D) between /u - y/, /e - ø/, /ɛ - œ/ pairs in the normalized F2-F3 chart for each learner, as indicative of how far apart in the acoustic space the two vowels are realized. For example, we computed the distance between the mean realization of /u/ and the mean realization of /y/ in the F2-F3 chart for each speaker. We used the F2-F3 (rather than F1-F2) chart because our vowels in each pair differ in terms of frontness and/or roundedness (F2 and F3 being considered as their main acoustic correlates respectively, cf. Gendrot et al., Reference Gendrot, Gerdes and Adda-Decker2016, for French), but not in terms of height (measured by F1). Euclidean distances between vowels in the acoustic space have been used in the literature with various purposes, such as comparing vowel systems (Gendrot and Adda-Decker, Reference Gendrot and Adda-Decker2007) and measuring prosodic effects on segments (Gendrot et al., Reference Gendrot, Gerdes and Adda-Decker2016), but only rarely for L2 data (Méli and Ballier, Reference Méli and Ballier2015; Mairano et al., Reference Mairano, Bouzon, Capliez and De Iacovo2019). Our assumption is that learners who have developed a phonological category for /y/ show a larger /u - y/ distance. As shown in Figure 1 and Table 2, this seems to be the case of learner IT3 (D /u-y/ = 14.23), but not IT22 (D /u-y/ = 1.7).
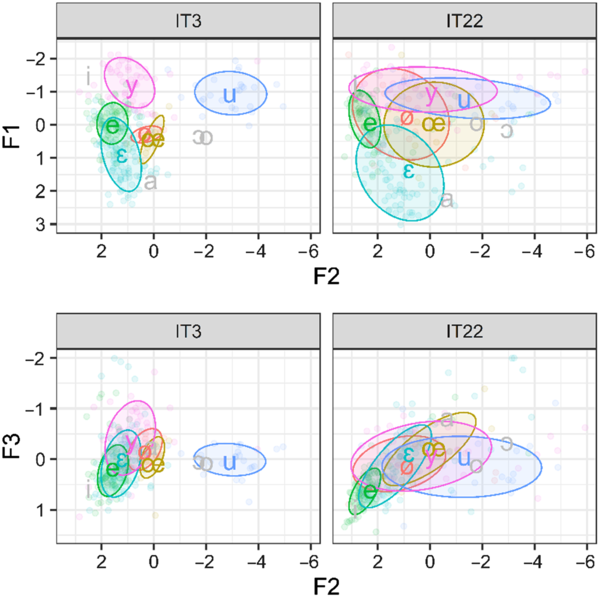
Figure 1. Normalized F1-F2 and F2-F3 plots for 2 learners. Ellipses encompass 1 st. dev. from the mean.
Table 2. Acoustic distance and overlap for learners IT3 and IT22

As a second acoustic metric, we computed the degree of acoustic overlap within such pairs: we used the Pillai score (P), also known as Pillai-Bartlett trace, extracted from a Multivariate Analysis of Variance (MANOVA) with F1, F2, F3 as dependent variables and with Vowel Identity as the independent variable for each target vowel pair. A Pillai score of 1 indicates a complete separation of vowel categories, while a score of 0 indicates complete overlap. This metric has been proposed in sociophonetics as a more powerful alternative to acoustic distances (Nycz and Hall-Lew, Reference Nycz and Hall-Lew2013) for measuring vowel mergers and splits (Hay, Warren and Drager, Reference Hay, Warren and Drager2006; Hall-Lew, Reference Hall-Lew2010), and has recently been proposed as a metric of L2 pronunciation by Mairano et al. (Reference Mairano, Bouzon, Capliez and De Iacovo2019). Our assumption is that speakers who have developed phonological categories for front rounded vowels show less overlap with competing phonemes (IT3) than learners who have not developed such phonological categories (IT22), as shown in Figure 1 and Table 2.
4. RESULTS
4.1. Measures of vocabulary size
Our 25 learners obtained Dialang scores ranging from 319 to 923 (mean: 599; median: 610). vocd-D values calculated on their productions spanned 26.94 to 79.39 (mean: 52.59; median: 52.27), while MTLD spanned 21.38 to 64.44 (mean: 33.55; median: 38.85), and MTLD-MA spanned 30.99 to 59.78 (mean: 42.85; median: 44.23). Figure 2 shows the correlation matrix between all our vocabulary measures. It shows clearly that the three lexical diversity metrics (meant to give an indication of learners’ productive vocabulary) correlate strongly and significantly among them (all p values < 0.01), while correlations with Dialang (meant to give an indication of learners’ receptive vocabulary) are all low and never reach significance.
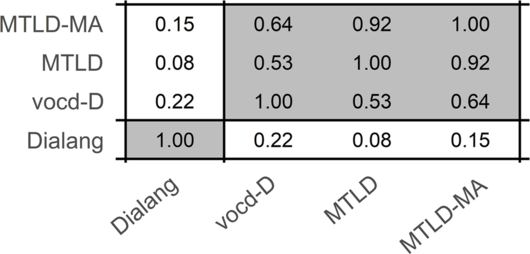
Figure 2. Correlation matrix (Pearson’s r) of all our vocabulary measures. Grey cases indicate significant correlations.
Additionally, since vocabulary size is considered to be a good predictor of learners’ proficiency in the four skills, we computed the correlation of our vocabulary metrics with self-reported evaluations in reading, writing, speaking and listening competence. As shown in Table 3, the relation does not seem to be particularly strong and never reaches statistical significance in our data.
Table 3. Correlations (Spearman’s rs) between vocabulary scores and self-evaluations in the four skills

4.2. Measures of L2 pronunciation
Given the high number of L2 pronunciation metrics considered, our first analysis consisted in estimating the relation between them. In order to do so, we generated a Fruchterman-Reingold graph via the qgraph library (Epscamp, Cramer, Waldorp, Schmittman and Borsboom, Reference Epscamp, Cramer, Waldorp, Schmittman and Borsboom2012) in R. This representation (Figure 4) is derived from the correlation matrix (Figure 3) by computing an adjacency matrix (indicating the strength of the relation between any two variables) and using it to compute distances between variables: the stronger the relation between two variables, the closer they are clustered in the graph. In the illustration, connecting lines are drawn only for significant correlations (p < 0.05).
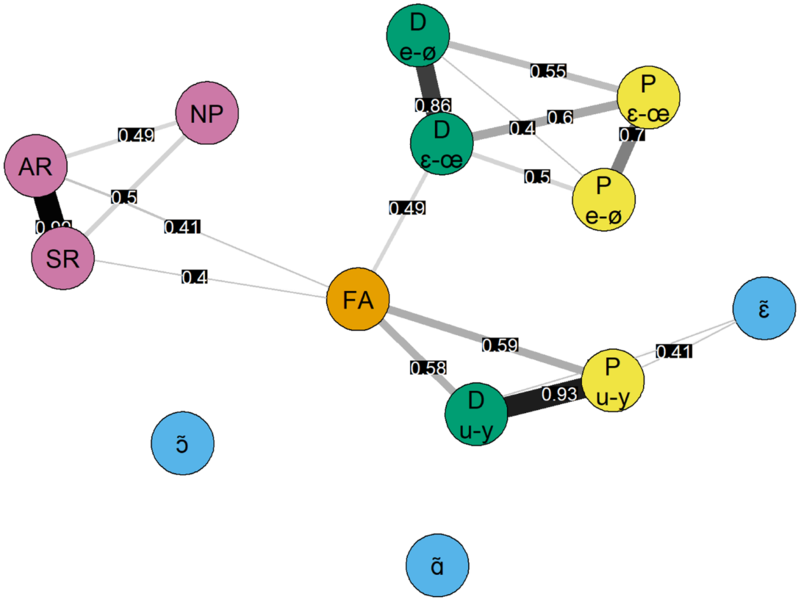
Figure 4. Fruchterman-Reingold graph illustrating relations among L2 pronunciation metrics: acoustic distances (D) in green, Pillai scores (P) in yellow, nasality ratings in blue, fluency metrics in violet, foreign-accentedness (FA) ratings in orange. Connecting lines are drawn exclusively for significant correlations and their width illustrates the strength of the correlation.
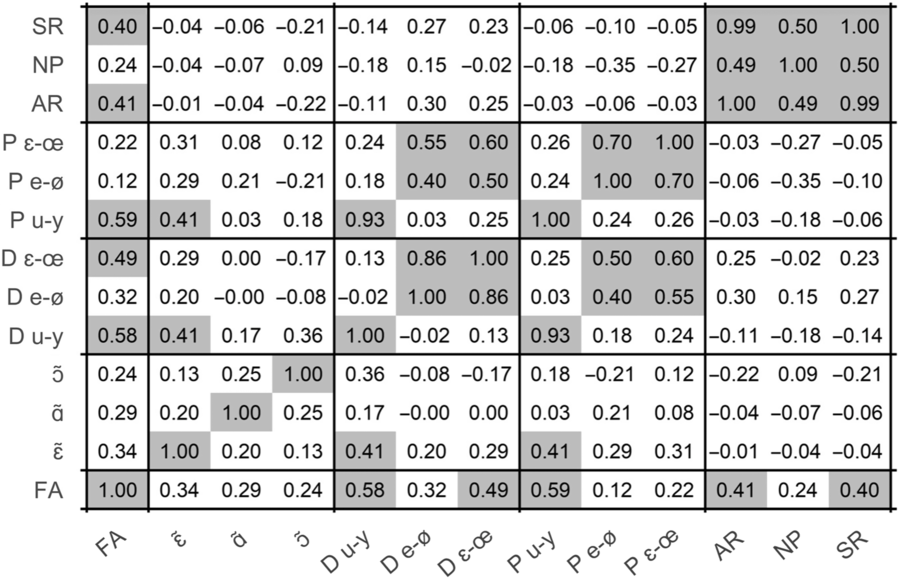
Figure 3. Correlation matrix (Pearson’s r) of L2 pronunciation metrics. Grey cases indicate significant correlations (p < 0.05).
The first consideration is that impressionistic ratings of FA are placed in the centre of the graph in Figure 4, meaning that this variable tends to correlate with most other variables: native listeners seem to be using all available cues of L2 pronunciation in order to determine the degree of foreign accent. Interestingly, the variables that correlate most strongly with FA are the acoustic distance and overlap of /u - y/ (r = 0.59 and 0.58 respectively) and the acoustic distance of /ɛ - œ/ (r = 0.49). This suggests that such metrics somehow reflect impressionistic ratings provided by humans, confirming previous results on L2 English (Mairano et al., Reference Mairano, Bouzon, Capliez and De Iacovo2019). It is also worth mentioning that FA ratings correlate more strongly with acoustic distances than with Pillai scores in the present L2 French data (but in contrast to previous results on L2 English). It is also interesting to note that acoustic metrics for /e - ø/ and /ɛ - œ/ cluster together and are strongly correlated to each other, while a second cluster is composed of acoustic metrics for /u - y/. Moving to other metrics, we observe that fluency measures tend to form a third cluster: articulation rate (AR) and speech rate (SR) correlate significantly with FA (r = 0.41 and 0.4 respectively, p < 0.05), and inverted number of pauses (NP) more weakly so (r = 0.24). Finally, ratings of nasality correlate far less with FA and other metrics and are therefore more peripheral. Nasality ratings for /ɛ̃/ show medium correlations with the /u - y/ distance and Pillai score (and also with FA ratings, although not reaching statistical significance), while nasality ratings for /ɑ̃/ and /ɔ̃/ occupy an isolated position in the graph as they do not correlate significantly with any other variable considered.
4.3. Correlation between vocabulary size and pronunciation
The final analysis addresses the core issue of this article, namely the relation between learners’ vocabulary size and their pronunciation in L2 French. We computed the correlation between each L2 pronunciation metric considered above and our four vocabulary metrics, as shown in Table 4.
Table 4. Correlations (Pearson’s r) between vocabulary scores and L2 pronunciation metrics. Grey cases indicate significant correlations (p < 0.05)
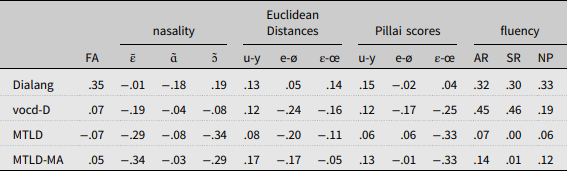
Most correlations are very low and non-significant, however some encouraging results come from fluency metrics (AR, NP, SR). The analysis shows correlations of up to r = 0.46 (p = 0.02) for fluency metrics with the vocd-D index of lexical diversity and up to r = 0.33 (although not reaching statistical significance) with scores obtained by learners in the Dialang vocabulary test. These figures roughly reflect findings from the few previous relevant studies, where fluency metrics were found to show medium correlations with L2 speakers’ receptive (Hilton, Reference Hilton2008b) and productive (Uchihara and Saito, Reference Uchihara and Saito2019) vocabulary size. We find it reasonable to claim that learners with a wider productive vocabulary (or, at least, a more readily available one) tend to be more fluent speakers, as they probably need to spend less time looking for the right words when speaking in the L2, so that the speech production process is likely to be faster altogether (see Hilton, Reference Hilton2008b, for an extensive discussion). However, this is not reflected by the result of the MTLD and MTLD-MA metrics, which do not correlate with fluency (nor with any other measure).
Turning to our other metrics of L2 pronunciation, we observe that none of our vowel measures (acoustic distance and overlap of vowel pairs, as well as nasality ratings) correlates significantly with vocabulary scores in our data. This seems to suggest that vowel pronunciation accuracy, despite heavily affecting native listeners’ impressionistic ratings of FA (cf. 4.2), is not related with vocabulary knowledge (cf. results on Japanese learners of L2 English by Uchihara and Saito, Reference Uchihara and Saito2019). That said, caution is needed because our analysis is limited to 25 learners, and the risk of type II error (the probability of rejecting an existing correlation) is high. Finally, we observe that ratings of FA show medium correlations with Dialang scores (but not with metrics of lexical diversity), which however do not reach statistical significance (r = 0.35, p = 0.09).
5. FINAL DISCUSSION
Our analysis showed that the scores obtained by learners in the Dialang vocabulary test and the vocd-D index of lexical diversity computed on learners’ productions only weakly correlate with (some) metrics of L2 pronunciation. More specifically, fluency metrics show medium correlations with metrics of receptive and productive vocabulary size (reflecting findings by Hilton, Reference Hilton2008b, and Uchihara and Saito, Reference Uchihara and Saito2019), while ratings of foreign-accentedness show weak correlations with receptive vocabulary measures only. In opposition, none of our L2 vowel metrics correlate at all with vocabulary indices, and the MTLD and MTLD-MA vocabulary scores correlate with no other variable at all. If we assume that the Dialang score and the vocd-D index reflect respectively the receptive and productive vocabulary size of L2 learners, and that our pronunciation metrics aptly capture the pronunciation patterns of L2 speech, then we are led to conclude that the relation between learners’ vocabulary and pronunciation is marginal at best. However, a number of issues prevent us from drawing such hasty conclusions. We therefore turn to the methodological challenges this type of research is confronted with.
First, as already mentioned above, we acknowledge that a correlation analysis with data from 25 learners has a weak statistical power, potentially leading to type I and type II errors. In our case, a type II error means incorrectly rejecting a relation between vocabulary knowledge and pronunciation in L2 acquisition. Indeed, with a sample size of 25 learners and setting the β level at 0.05, we can only reliably reject a correlation strength of r > 0.34, meaning that our data would not be inconsistent with a small to medium correlation between learners’ vocabulary knowledge and L2 vowel pronunciation accuracy. Unfortunately, the process of recording a speech corpus and annotating it with phonetic labels is extremely time-consuming, making it difficult to observe a large amount of data. Indeed, the dataset analysed in this study is comparable to the ones found in similar learner speech corpora conceived for phonetic analysis (e.g. Aix-Ox, cf. Herment, Loukina and Tortel, Reference Herment, Loukina and Tortel2012; Anglish cf. Tortel, Reference Tortel2008; Coreil cf. Delais-Roussarie and Yoo, Reference Delais-Roussarie and Yoo2010; Corpus Parole, cf. Hilton, Reference Hilton2008a), reflecting a typical trend in this domain. However, given the apparent subtlety of the phenomena under scrutiny, it is clearly desirable that future research investigating the relation between lexicon and pronunciation in SLA make use of a larger, and as such more powerful, dataset.
Second, we need to raise some issues about the metrics used. As far as vocabulary metrics are concerned, we found that Dialang scores (receptive vocabulary) do not correlate with lexical diversity indices (productive vocabulary), and this could be due to the relation between receptive and productive vocabulary not being a straightforward one (Webb, Reference Webb2008; Zhou, Reference Zhou2010). All our vocabulary metrics also correlated poorly with self-evaluations provided by L2 learners in the four skills. Clearly, the trustworthiness of learners’ self-evaluations is debatable (Ross, Reference Ross1998), so that these results may not be sufficient to cast doubt on the applicability of Dialang vocabulary test as a quick evaluation of learners’ level in the four skills, but the limited applicability of vocabulary tests has already been pointed out by other researchers (cf. Beeckmans et al., Reference Beeckmans, Eyckmans, Janssens, Dufranne and Van de Velde2001). More specifically, Eyckmans (Reference Eyckmans2004) reported the failure of Dialang vocabulary test to account for the effects of cognates, something that may clearly play a relevant role for Italian learners of L2 French. Other studies suggested that aurally-elicited vocabulary tests correlate better than written vocabulary tests with learners’ oral skills (Milton, Wade and Hopkins, Reference Milton, Wade, Hopkins, Chacón-Beltrán, Abello-Contesse, Torreblanca-López and López-Jiménez2010). Although it may be argued that vocabulary scores obtained via oral tests reflect only the part of vocabulary for which learners recognize the spoken form and not necessarily their whole receptive vocabulary, it may certainly make sense to use oral tests at least from an applied perspective (e.g., evaluation/placement) when wishing to get scores that more closely reflect oral skills. In the future, we plan to verify if aurally elicited vocabulary tests reflect L2 pronunciation with better accuracy than written tests. Additionally, measures of lexical diversity such as vocd-D and MTLD also have pitfalls if taken as an indication of learners’ vocabulary size: low diversity does not necessarily imply a small vocabulary size. In order to measure vocabulary size from free productions, some authors have proposed to use metrics based on lexical frequency on the grounds that non-proficient learners tend to overuse frequent words, while more proficient learners make use of less frequent words (Laufer and Nation, Reference Laufer and Nation1995; Edwards and Collins, Reference Edwards and Collins2011). It seems that this approach may have similar pitfalls to lexical diversity metrics, given that failure to use infrequent words does not imply lack of knowledge. However, such metrics offer interesting possibilities for future investigations.
As far as our L2 pronunciation metrics are concerned, the analysis showed that acoustic distances and Pillai scores of vowel pairs correlate fairly strongly with ratings of FA, thereby confirming results by Mairano et al. (Reference Mairano, Bouzon, Capliez and De Iacovo2019) on L2 English data and providing comforting reassurance about the validity of these metrics. The advantage of this approach lies in evaluating L2 pronunciation intrinsically, without referring to comparable productions by native control speakers – who do not necessarily correspond to learners’ model. However, this is not to say that such metrics are unproblematic: we are well aware that automatic formant extraction is prone to erroneous detections that may bias the analysis, and this is especially true for L2 speech, where filtering out implausible formant values is not always a viable solution (cf. 3.2 and Ferragne, Reference Ferragne, Diaz-Negrillo, Ballier and Thompson2013). Additionally, the acoustic metrics considered in this study focus on the pronunciation of vowels, leaving out consonants and intonation. A more global approach may reveal different patterns. In fact, we observe medium correlations between ratings of FA (which we assume to be global, in the sense that listeners consider cues of all types, including vowels, consonants and prosody) and Dialang scores in our data (r = 0.35, p = 0.09, though not with indices of lexical diversity). Although not reaching statistical significance, this result hints at a potential relation between receptive vocabulary size and L2 pronunciation accuracy considered globally. This encourages us to pursue this line of research and invites us to consider other aspects of L2 pronunciation, such as consonants, intonation patterns and voice quality. Additionally, in future investigations, we plan to extend our analysis to the interaction of vocabulary size with not only production but also perception of L2 phonological categories.
Finally, we would like to mention the possibility that the relation between the development of L2 learners’ vocabulary and pronunciation be non-linear. More specifically, the relation between the two may be relatively strong in the early phases of acquisition, when lexicon drives phonological oppositions (cf. Bundgaard-Nielsen et al., Reference Bundgaard-Nielsen, Best and Tyler2011a and b), and become weaker in later stages. Arguably, this non-linearity may be particularly true in the case of instructed learning, where pronunciation is seldom taught at all in classes of L2 French and its development depends on a plethora of other factors, such as personal motivation, aptitude, quantity and quality of L2 exposure (Piske et al., Reference Piske, MacKay and Flege2001). Unfortunately, the learners recorded in the ProSeg corpus span levels B1 to C1, so for now we have no way of corroborating this hypothesis, and only future investigation can tell if our supposition is correct. Additionally, this hypothesized non-linearity may also explain why Bundgaard-Nielsen et al. (Reference Bundgaard-Nielsen, Best and Tyler2011a and b) found a relationship between vocabulary size and the perception of vowel categories for learners with little exposure to the L2, while we did not find a relationship between vocabulary size and the production of vowel categories for our (relatively advanced) participants. We therefore advocate for larger studies including learners at earlier stages of acquisition, and using a higher number of metrics capable of capturing the development of vocabulary and pronunciation in the L2. We hope that this will help us shed light on the elusive relation between lexicon and phonology in the course of second language acquisition.
Acknowledgements
Earlier versions of this work have been presented at the EuroSLA 2017 conference (30 August 30–2 September, Reading, UK) and at the SLAmethod conference (30 May–1 June 2018, Montpellier, France), where we received precious feedback. Additionally, we wish to thank the anonymous reviewers, who provided very precise and constructive comments and suggestions. Finally, we are grateful to all participants of the ProSeg corpus for giving us their time and their voices.


