INTRODUCTION
Tritrichomonas foetus causes bovine trichomoniasis, which is one of the most widespread sexually transmitted diseases in cattle and causes infertility and abortion, leading to considerable economic losses in beef-producing areas of the world (Rae and Crews, Reference Rae and Crews2006). Furthermore, T. foetus is able to infect and colonize the colon of domestic cats, resulting in chronic, large-bowel diarrhoea (Gookin et al. Reference Gookin, Stebbins, Hunt, Burlone, Fulton, Hochel, Talaat, Poore and Levy2004; Yaeger and Gookin, Reference Yaeger and Gookin2005; Stockdale et al. Reference Stockdale, Dillon, Newton, Bird, Bondurant, Deinnocentes, Barney, Bulter, Land, Spencer, Lindsay and Blagburn2008).
Tritrichomonas foetus is studied not only for its veterinary importance, but also because of its particular cell structure. This parasite has several unusual characteristics, including cellular components called hydrogenosomes, which are an anaerobic form of modified mitochondria that generate hydrogen and ATP, a microtubular pelta-axostylar system and the costa, which is a large striated fibre (Lindmark and Müller, Reference Lindmark and Müller1973; Benchimol, Reference Benchimol2004).
Trichomonads are characterized by the presence of a well-developed Golgi complex (Fig. 1) that corresponds to the parabasal apparatus, which is formed by both the Golgi cisternae and the parabasal filaments (Honigberg et al. Reference Honigberg, Mattern and Daniel1971; Honigberg and Brugerolle, Reference Honigberg, Brugerolle and Honigberg1990; Benchimol et al. Reference Benchimol, Ribeiro, Mariante and Alderete2001). The large size of the Golgi in trichomonads likely indicates a significant role; however, little is known about its function in this parasite. Indeed, there are few cellular and biochemical studies regarding this organelle (Diaz et al. Reference Díaz, Monteiro-Leal and De Souza1996; Díaz and De Souza, Reference Díaz and De Souza1998; Almeida et al. Reference Almeida, Benchimol, de Souza and Okorokov2003). The absence of reliable commercial antibodies to the Golgi complex of trichomonads and the lack of a fully sequenced T. foetus genome are factors that complicate the process of understanding and mapping of trichomonad proteins. To gain a deeper knowledge of the biochemical and molecular characteristics of the T. foetus Golgi complex, a panel of monoclonal antibodies was raised against the Golgi complex of T. foetus with the aim of obtaining an antibody against a Golgi-resident protein that could be used to study this organelle. In addition, complementary techniques, such as immunolabelling, immunoblotting, mass spectrometry analysis and database searches, were used to identify the proteins that were recognized by this antibody. The new information about nucleic acid sequences and the 3D structure of the proteins obtained in this work were added to the T. foetus database.

Fig. 1. A general view of T. foetus in a routine longitudinal thin section. Note the well-developed Golgi (G) with several budding vesicles, the hydrogenosomes (H) and the nucleus (N) with its nucleolus (Nu).
MATERIALS AND METHODS
Cell culture
The K strain of T. foetus was isolated by Dr H. Guida (Embrapa, Rio de Janeiro, Brazil) from the urogenital tract of a bull. The JT strain of Trichomonas vaginalis was isolated at the Hospital Universitario, Universidade Federal do Rio de Janeiro, Brazil and has been maintained in culture for several years. Microorganisms of both cell lines were cultivated in TYM Diamond's medium (Diamond, Reference Diamond1957) supplemented with 10% fetal calf serum (FCS). The cells (1 ×10⁶ cells mL−1) were grown for 24 h at 36·5 °C, washed in PBS to remove the medium and used in the experiments described below.
Isolation of the Golgi-rich fraction
The Golgi was isolated as previously described (Díaz et al. Reference Díaz, Monteiro-Leal and De Souza1996). Briefly, rinsed T. foetus cells were resuspended in 10 mL of 10 mMTris–HCl buffer (pH 7·4), containing 0·25 m sucrose and 2 mm MgCl2 (G buffer). A cocktail of proteases inhibitors (Sigma, USA) was added to this G buffer to prevent protein degradation before the cells were disrupted with 300 strokes of a Potter-type homogenizer. The homogenate was centrifuged at 2500 g for 10 min, and the pellet of unbroken cells, nuclei and hydrogenosomes was discarded. The resultant PNS was harvested, and an equal volume of 2·3 m sucrose was added to achieve a final concentration close to 1·4 m sucrose. This suspension was loaded into the bottoms of ultracentrifuge tubes (Beckman SW 28) and successively overlaid with (10 mL of each concentration) 1·2 m sucrose, 1·0 m sucrose and 0·8 m sucrose. This gradient was then centrifuged at 95 000 g for 2·5 h (Beckman SW 28 rotor). Two bands, representing the 0·8/1·0 m (GF1) and 1·0/1·2 m (GF2) interfaces, were carefully removed from the top, diluted with G buffer without sucrose, collected by centrifugation at 80 000 g for 30 min (Beckman Type 65 rotor), and used for experiments. All steps were performed at 4 °C or on ice.
Monoclonal antibody production
To generate the monoclonal antibodies (mAbs), approximately 50 μg of purified Golgi complex (GF1 and GF2) was used to immunize female BALB/c mice. The mice were injected intraperitoneally on days 0, 7, 14, 21 and 30. The antigen was emulsified in Freund's complete adjuvant for the first injection. The subsequent immunizations were performed with incomplete adjuvant followed by antigen preparation in PBS. Two mice were euthanased, the spleens were removed, and fusion with myeloma cells was performed. The hybridoma supernatants were screened using immunofluorescence. The positive clones were subcloned by limiting dilution. The antibody anti-Golgi 20.3 was purified by chromatography using protein G.
Immunofluorescence microscopy
Cells were fixed with 1% paraformaldehyde in phosphate buffer, pH 7·2, overnight at room temperature. The fixed parasites were washed in PBS and allowed to adhere to poly-l-lysine-coated (mol wt 300 000) glass coverslips. The cells were washed in PBS, permeabilized with 0·1% Triton X-100 and blocked with 50 mm ammonium chloride and 1 and 3% BSA for 15 min each step. The hybridoma supernatants (without dilution) and the mAb anti-Golgi 20.3 (1/10 in PBS/BSA1%) were used as the primary antibodies and were detected with an anti-mouse IgG Alexa-488 or Alexa-546 conjugated secondary antibody (1/100 in PBS/BSA1%, Molecular Probes, USA). The lectin Helix pomatia (HPA-Alexa 488) diluted 1/50 in PBS/BSA 1% is known to recognize carbohydrates of the T. foetus Golgi complex (Benchimol et al. Reference Benchimol, Ribeiro, Mariante and Alderete2001; Benchimol and Bernadino, Reference Benchimol and Bernardino2002) and it was used for co-localization with mAb anti-Golgi to confirm the specificity of our antibody. To stain the nuclei, the cells were incubated with 5 μg mL−1 DAPI for 5 min in the dark. The samples were observed using an Axiophot II Zeiss microscope, and the images were acquired using a chilled C5985 CCD camera (Hamamatsu, Japan). Programs such as KS300 and AdobePhotoshop CS2 were used to create the pseudo-coloured images.
C6-NBD-ceramide labelling
Living cells were incubated in a solution containing 5 μ m C6-NBD-ceramide (MolecularProbes, USA) in TYM medium supplemented with 10% FCS, pH 6·2, for 5 min at 37 °C in the dark. C6-NBD-Ceramide (C6-NBD-Cer) is a selective stain for the Golgi complex (Pagano et al. Reference Pagano, Sepanski and Martin1989). When it is incubated in living cells at 37 °C, the fluorescent analogue of ceramide is metabolized into fluorescent sphingolipid and glucosylceramide and, concomitantly, the Golgi apparatus becomes intensely fluorescent (Simons and van Meer, Reference Simons and van Meer1988; de Melo and de Souza, Reference De Melo and de Souza1996). Subsequently, the cells were washed in warmed PBS and fixed in freshly prepared 1% paraformaldehyde for 1 h at room temperature. The samples were observed using an Axiophot II Zeiss microscope, and the images were acquired using a chilled C5985 CCD camera (Hamamatsu, Japan). Programs such as KS300 and Adobe Photoshop CS2 were used to create the pseudo-coloured images.
Transmission electron microscopy
Cells were fixed overnight at room temperature in 2·5% glutaraldehyde in 0·1 m cacodylate buffer. Afterwards, the cells were washed in PBS and post-fixed for 15 min in 1% OsO4 in 0·1 m cacodylate buffer containing 5 mm CaCl2 and 0·8% potassium ferricyanide. The cells were dehydrated in ethanol and embedded in Epon. Ultra-thin sections were harvested on 300 mesh copper grids, stained with 5% uranyl acetate and 1% lead citrate and observed with a JEOL 1210 transmission electron microscope.
Immunocytochemistry
Cells were fixed overnight in 2·5% glutaraldehyde in 0·1 m cacodylate buffer, pH 7·2, and dehydrated in ethanol. Whole cells and Golgi fractions were embedded in Epon. For immunolabelling, thin sections were quenched in 50 mm NH4Cl for 30 min and incubated with mAb anti-Golgi 20.3. After several washes in PBS-1% BSA, the sections were incubated with 10 nm gold-labelled goat anti-mouse IgG (BB International, UK).The samples were washed and observed with a JEOL 1210 electron microscope. The controls included samples that did not receive the primary antibody.
Quantitative evaluation of immunogold labelling specificity
The quantitative evaluation of labelling specificity was performed according to a previous study (Lucocq and Gawden-Bone, Reference Lucocq and Gawden-Bone2010). For this procedure, 10 micrographs were taken at random locations. The raw number of gold particles, Au(+), was counted in any one labelled section when the target component was present at normal expression levels. The Au(+) is composed of specific, Au(s), and non-specific, Au(ns), labelling. Thus, Au(+) = Au(s)+Au(ns), and an estimative of Au(s) = Au(+)−Au(−). The fraction of specific labelling, f(s), is given by f(s) = Au(s)/Au(+).
Immunoprecipitation
After cell fractionation, the PNS, 0·8/1·0 m (GF1) and 1·0/1·2 m (GF2) (1 mg mL−1) fractions were incubated in 10 μL of mAb anti-Golgi 20.3 overnight at 4 °C. Afterwards, the samples were incubated overnight at 4 °C with 50 μL of Protein A-Sepharose CL-4B (Sigma, USA), and the samples were gently shaken. For identification of the proteins by mass spectrometry an immunoprecipitation of a combined sample (GF1+GF2) was performed. The immunoprecipitated complexes were collected by centrifugation at 3000 g for 2 min at 4 °C. The supernatants were discarded, and the pellets were extensively washed with 20 mm PBS, pH 7·4. The samples were heated at 95 °C for 5 min and centrifuged for 30 s at 12 000 g at room temperature. Next, the supernatants (IP samples) were separated by 12% SDS–PAGE and transferred to polyvinylidene fluoride (PVDF) membranes. The proteins were then probed with mAb anti-Golgi 20.3.
SDS–PAGE analysis
The subcellular fractions of T. foetus were analysed by SDS–PAGE using 12% gradient gels (Laemmli, Reference Laemmli1970). The same amount of protein (50 μg) from all of the samples was boiled and applied to the gel. Kaleidoscope Prestained Standards (Bio-Rad, Brazil) were used as standard proteins to evaluate the molecular mass of the protein bands in each sample. The gels were stained with silver or Coomassie brilliant blue G (CBB-G-250).
Detection of Golgi protein using Western blot analysis
The Golgi proteins were separated by 12% SDS–PAGE and transferred to a PVDF membrane (Millipore Corporation, USA). The PVDF membrane was blocked with 5% non-fat dried milk and washed once in TBS containing 0·1% Tween-20 at 4 °C for 1 h. Afterwards, the membrane was incubated with the mAb anti-Golgi 20.3 primary antibody, diluted 1:1000 in the same blocking solution. The specifically bound primary antibody was detected using a horseradish peroxidase labelled goat anti-mouse IgG antibody diluted 1:2000 in the blocking solution. The membrane was incubated, washed in TBS-Tween and developed using the ECL Plus Western blotting detection system (GE Healthcare, Sweden).
Protein digestion and peptide extraction
SDS–PAGE gels were stained with CBB-G-250 and all five bands were manually cut from the gel and subjected to digestion. To remove the stain, each of the five bands were cut and treated with 50% acetonitrile and 25 mm NH4HCO3 overnight at 4 °C. The gel pieces were then reduced at 56 °C for 1 h using a DTT solution (10 mm DTT in 25 mm NH4HCO3). The samples were briefly washed with 25 mm NH4HCO3. The free -SH groups in the protein molecules were alkylated at room temperature for 45 min in the dark with 55 mm iodoacetamide in 25 mm NH4HCO3. Afterwards, the gel pieces were dehydrated with 100% acetonitrile and rehydrated with trypsin solution (0·01 μg μL−1 in 25 mm NH4HCO3) at 37 °C for 20 h. The peptides were extracted with 5% trifluoroacetic acid (TFA) dissolved in 50% acetonitrile. ZipTip C18 pipette tips were utilized to condense the peptides and remove the inorganic compounds. The peptides were eluted with 5 μL of 50% acetonitrile and 0·1% formic acid.
MALDI-TOF/TOF mass spectrometry
Approximately 0·3 μL of the extracted peptide solution was mixed with an equal volume of a saturated matrix solution (10 mg mL−1 α-cyano-4-hydroxycinnamic acid (Aldrich, Milwaukee, WI, USA) in 50% acetonitrile/0·1% TFA) on the target plate and allowed to dry at room temperature. The raw data for protein identification were obtained using a 4700 Proteomics Analyzer (Applied Biosystems, Foster City, CA, USA). Both MS and MS/MS data were acquired with a neodymium-doped yttrium aluminium garnet (Nd:YAG) laser with a 200-Hz repetition rate. Typically, 1600 shots were accumulated for the spectra in MS mode, whereas 2400 shots were accumulated for the spectra in MS/MS mode. The MS and MS/MS mass spectra were acquired in reflector mode and internally calibrated with trypsin autolysis peptides. Up to eight of the most intense ion signals with signal-to-noise ratios above 30 were selected as precursors for MS/MS acquisition. External calibration in MS mode was performed using a mixture of four peptides: des-Arg1-Bradykinin (m/z = 904·468), angiotensin I (m/z = 1296·685), Glu1-fibrinopeptide B (m/z = 1570·677), and ACTH (18–39) (m/z = 2465·199). The MS/MS spectra were externally calibrated using known fragment ion masses observed in the MS/MS spectrum of angiotensin I.
Liquid chromatography–tandem mass spectrometry (LC–MS/MS) analysis
Trypsin-digested peptides were solubilized in 30 μL of 2% acetonitrile and 0·1% formic acid (mobile phase A), and 5 μL was injected onto a trap column (C18, 0·25 μL, OPTI222PAK). The separations were performed using a reverse-phase capillary column (Acclaim, 3 μ m C18, 75 μ m×20 cm, LC Packings, Dionex) connected to a nano-HPLC system (nano-LC 1D plus, Eksigent). For elution, mobile phases A and B (80% acetonitrile, 0·1% formic acid) were used. The eluting peptides were directly introduced into a linear ion trap-mass spectrometer equipped with a nanospray source (LTQ XL,Thermo-Fisher Scientific). The MS spectra were collected in centroid mode over a range of 400–1700 m/z, and the five most abundant ions were subjected to collision-induced dissociation (35% normalized collision energy) twice before being dynamically excluded for 120 s. All of the MS/MS spectra were from peptides of 600–4000 Da, and at least 15 fragments were converted into DTA files using Bioworks version 3.3.1 (Thermo-Fisher Scientific).
Database search and peptide identification/validation
The DTA files were submitted for database searching using Turbo Sequest (Eng et al. Reference Eng, McCormack and Yates1994; Lundgren et al. Reference Lundgren, Han and Eng2005) (available in Bioworks version 3.3.1). The protein database contained sequences from T. vaginalis (n = 119 913, April 05, 2010), keratin (n = 1091) and trypsin (n = 1), which are available from the National Center for Biotechnology Information (NCBI). All of the sequences (total of n = 242 008) were used in the forward and reverse orientations to calculate the False Discovery rate (FDR). The database search parameters were the same as described in Rodrigues et al. (2011). To ensure the quality of protein identification, the false positive rate (FPR) was estimated using the following formula: FPR = number of proteins matching the reverse sequences/total number of proteins. The FPR was calculated after applying the following filters in Bioworks (for Sequest analysis): DCn⩾0·85; protein probability ⩽1 × 10⁻³; and Xcorr ⩾1·5, 2·0 and 2·5, for singly, doubly and triply charged peptides, respectively. Using these parameters, we validated all of the sequences with an FPR<1%.
Isolation of genomic DNA from T. foetus
Genomic DNA was purified with Wizard Genomic DNA Purification Kit (Promega, USA) according to the manufacturer's instructions.
Sequencing analysis
To confirm the presence of the adenosine triphosphatase and beta-tubulin genes in T. foetus DNA, the total assembly was performed using Newbler 2.6. Afterwards, T. foetus genes and target proteins were aligned using the tBLASTN 2.2.24 software. The Consed 20.0 software was used to align and select the contigs. The existence of the gene was then confirmed using the ORF Finder software (http://www.ncbi.nlm.nih.gov/gorf/gorf.html) and BLASTp 2.2.24 software.
Theoretical study
To verify the possibility of antibodies cross-reacting with adenosine triphosphatase and beta-tubulin, 20 antigenic peptides were constructed for these proteins using the web server MHC-I Antigenic Peptide Processing Prediction (http://www.mpiib267berlin.mpg.de/MAPPP). Afterwards, the alignment of adenosine triphosphatase with antigenic peptides predicted for beta-tubulin was performed using the program CLUSTALW2 (http://www.ebi.ac.uk/Tools/msa/clustalw2/). The same strategy was used to verify the peptides predicted for adenosine triphosphatase. To observe the exposure of these antigenic peptides in their tertiary structures, the homology models of adenosine triphosphatase and beta-tubulin were constructed as described by Abreu et al. (Reference Abreu, Albuquerque, Rodrigues and Castro2006), using the Swiss Model and Swiss-PDB viewer programs available at http://swissmodel.expasy.org/ and http://www.expasy.org/spdbv/, respectively. The crystal structures of the beta subunits of the alpha-beta tubulin dimer (PDB = 1TUB) and A-type ATPase (PDB = 2C61) were used as templates due to their high degree of homology with the proteins studied. Blocks of structurally conserved regions were identified, and the structural alignment of the protein sequences was generated. Coordinates for all residues were transferred to both adenosine triphosphatase and beta-tubulin sequences and loops were constructed in a single round. Several cycles of constrained energy minimization were used to normalize the structures and their geometrical parameters. In subsequent runs, the peptides were constructed according to the template by searching for steric hindrance. The models were minimized using the Gromos parameter set, available in Swiss-PDB viewer. The energy minimization of the models was performed in a vacuum without a reaction field. The Gromos forcefield allows the energy of a structure to be evaluated, as well as the repair of distorted geometries via energy minimization. The models were validated as previously described by Castro et al. (Reference Castro, Silva, Craik and Zingali2001).
RESULTS
Isolation of the Golgi complex
The homogenization procedure lysed approximately 90% of the cells. The fractionation methodology was controlled by phase-contrast and transmission electron microscopy. A typical PNS was produced after the first centrifugation step at 2500 g , in which it was possible to observe the Golgi cisternae (Fig. 2a and b). To remove possible contaminating structures such as membranous endoplasmic reticulum (ER) vesicles, plasma membrane and/or hydrogenosomes, the PNS was further purified using discontinuous sucrose gradient centrifugation. Two fractions were recovered by flotation, corresponding to the 0·8/1·0 and 1·0/1·2 M interfaces (designated GF1 and GF2, respectively), which were enriched in Golgi complexes, as determined by electron microscopy (Fig. 2c and d). Electron microscopy analyses of either of the two fractions, GF1 or GF2, showed that they were highly enriched for elements of the Golgi complex. No cytoskeletal, flagellar, nuclear or hydrogenosomal contamination was found, demonstrating that the homogenization, followed by differential and discontinuous sucrose gradient centrifugation, was efficient. However, light contamination was occasionally found with profiles of the ER and plasma membrane. Therefore, extra care was taken during the antibody screening to choose one antibody that was specific to the Golgi complex in T. foetus.

Fig. 2. (a) TEM of the post-nuclear supernatant fraction, showing several of the Golgi cisternae fractions (arrows). (b) A nearly-intact Golgi complex is found in the PNS (G). (c, d) The general appearance of fractions obtained from the 0·8–1·0 M (GF1) (c) and 1·0–1·2 (GF2) interfaces (d).
Characterization of Golgi complex proteins in T. foetus
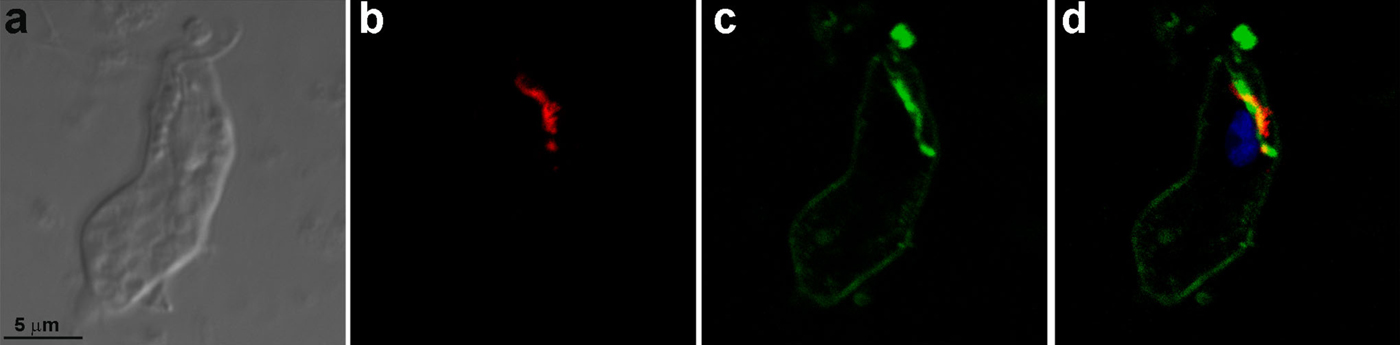
Mice were immunized with the Golgi complex fractions (GF1 and GF2) isolated from T. foetus and used to generate monoclonal antibodies (mAbs). The fusion of splenocytes and myeloma cells generated 405 hybridomas, of which 116 were selected to be cloned. In the cloning step, 20 hybridomas of the 112 hybridomas that remained viable and secreting antibodies presented positive labelling in the Golgi and were recloned. In two hybridomas the secretion stopped, 10 hybridomas' secretion presented labelling on ER, vesicles and Golgi complex, whereas 4 hybridomas' secretion labelled the ER and Golgi complex and 4 hybridomas' secretion labelled exclusively the Golgi complex. Four hybridomas (2 to Golgi complex, 2 to ER and Golgi complex) were selected to grow in large scale. One of these hybridomas died and the supernatants of the other three were purified and originated the antibodies 69·1 and 69·2 (which labelled both ER and Golgi complex) and 20.3 (Golgi complex). In total, 545 hybridomas were produced and all supernatants of the hybridomas cultures were tested by immunofluorescence using T. foetus. Positive reaction was defined in the form of crosses (from zero to five crosses, where zero was no observed labelling and five crosses, a very strong labelling). We have selected only the five crosses labelling. The hybridomas that strongly labelled the Golgi complex were cloned, which led to the final selection of three monoclonal antibodies. One of these mAbs, anti-Golgi 20.3, demonstrated satisfactory labelling of the Golgi complex (Figs 3 and 4) and was used to characterize proteins in the T. foetus Golgi complex. The fluorescent marker C6-NBD-ceramide was used to specifically visualize the T. foetus Golgi complex (Benchimol et al. Reference Benchimol, Ribeiro, Mariante and Alderete2001). The localization of the Golgi complex in cells treated with C6-NBD-ceramide (Fig. 3a and b) was similar to the labelling of anti-Golgi 20.3 found in the anterior and perinuclear regions. Moreover, the co-localization of the mAb 20.3 with the lectin HPA-Alexa 488 by fluorescence demonstrated the specificity of the antibody to the Golgi complex in T. foetus (Figs 3d, f and 4) and electron microscopy (Fig. 5). In addition, anti-Golgi 20.3 labelled both Golgi complexes in cells with duplicated Golgi (Fig. 3f). The quantitative analysis of immunogold labelling revealed that the mAb anti-Golgi 20.3 is highly specific to the Golgi complex. The specific fraction was represented by f(s) = Au(s)/Au(+) = 368/448 = 0·82. To characterize the molecule(s) recognized by the monoclonal antibody, immunoprecipitation was performed and detected proteins with molecular masses of 60 kDa and 66 kDa in the PNS (Fig. 6, lane 1), GF1 (Fig. 6, lane 2) and GF2 (Fig. 6, lane 3). In addition, other proteins of 25, 50 and 73 kDa were detected and may correspond to the light chain and heavy chains of immunoglobulin.

Fig. 3. (a, b) Tritrichomonas foetus stained with C6-NBD-ceramide and DAPI. (a) DIC. (b) Note the fluorescent labelling in the Golgi (G) and nucleus (N). (c–f) DIC (c, e) and immunofluorescence (d, f) labelling of the T. foetus Golgi complex with mAb anti-Golgi 20.3 and DAPI. Note that in (f), the cell is in the process of division because two Golgi complexes (G) are observed.

Fig. 4. (a–d) Tritrichomonas foetus labelled with mAb anti-Golgi 20.3 conjugated with Alexa 546 secondary antibody and with the lectin HPA-Alexa 488 conjugated. (a) DIC; (b) immunofluorescence with mAb anti-Golgi 20.3-Alexa 546; (c) fluorescence with HPA-Alexa 488; (d) Merge. Note that the Golgi complex of T. foetus is labelled with both compounds.

Fig. 5. Immunogold electron microscopy using mAb anti-Golgi 20.3. Positive staining is observed in the cisternae of the Golgi complex.

Fig. 6. (a) Immunoprecipitation of Golgi proteins using the PNS, GF1 and GF2 fractions and mAb anti-Golgi 20.3. After incubating the fractions with mAb anti-Golgi 20.3, the proteins were precipitated using Protein A-Sepharose. The proteins were then separated on 12% SDS gels and stained with Coomassie brilliant blue G-250. (b) Immunoprecipitation control: the anti-Golgi antibody 20.3 was precipitated using Protein A-Sepharose and separated on 10% SDS gel.
Specificity of Golgi proteins for T. foetus
The mAb anti-Golgi 20.3 reacted specifically with 60-kDa and 66-kDa proteins in Western blots. In whole organism homogenates of T. foetus (Fig. 7a) and after immunoprecipitations were performed with the PNS and GF2 fractions (Fig. 7b), two bands (60-kDa and 66-kDa) were detected, whereas in the GF1 fraction, only a 60-kDa band was observed (Fig. 7b).

Fig. 7. Immunoblotting for the detection of Golgi proteins in (a) T. foetus lysates and (b) the PNS, GF1 and GF2 fractions using mAb anti-Golgi 20.3. The parasite pellets and fractions were boiled in SDS sample buffer for 5 min.
Characterization of the Golgi complex proteins in T. vaginalis
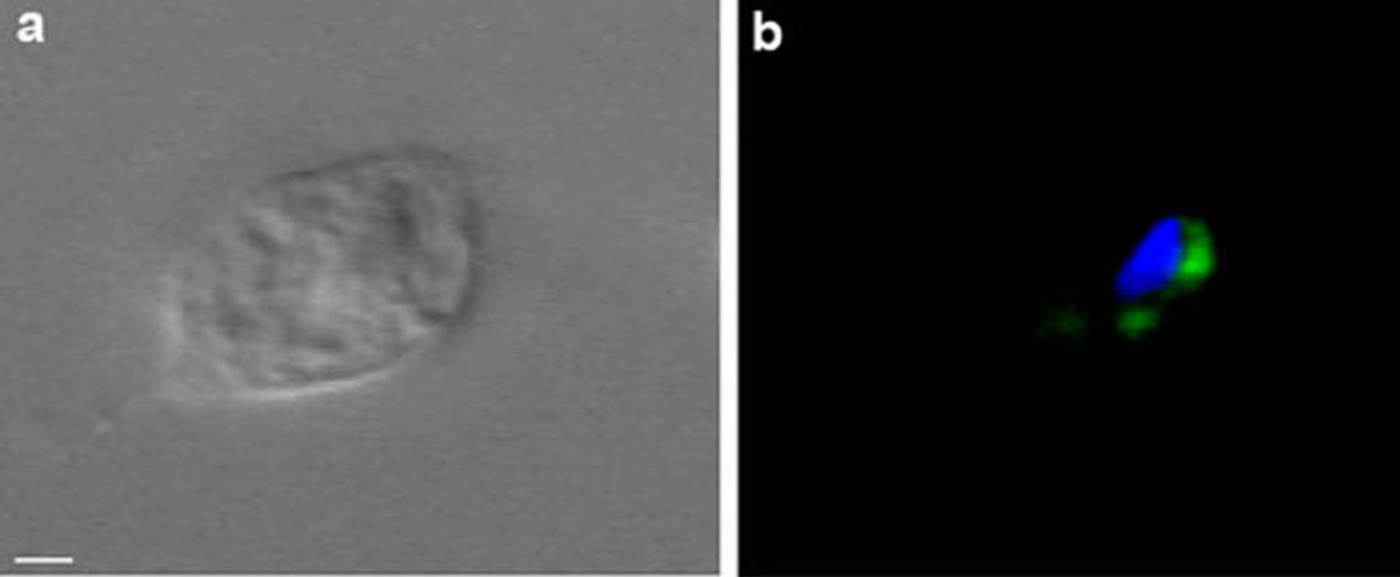
To determine whether the antigens studied in the T. foetus Golgi were conserved in trichomonads, immunofluorescence analysis of T. vaginalis was performed. Trichomonas vaginalis exhibited a labelling pattern similar to that of T. foetus (Fig. 8b).

Fig. 8. DIC (a) and immunofluorescence (b) using mAb anti-Golgi 20.3 in T. vaginalis (a-b), Scale bar, 2 μm.
Identification of the proteins in the Golgi of T. foetus recognized by anti-Golgi 20.3
The proteins from the T. foetus Golgi fractions were immunoprecipitated using mAb anti-Golgi 20.3. After SDS–PAGE separation and CBB-G-250 staining, five distinct protein bands could be observed (Fig. 6). After trypsin digestion and mass spectrometry analysis, the 66-kDa and 60-kDa protein bands were identified (P⩽0·05) as adenosine triphosphatase (NCBI accession no XP_001316717) and putative beta-tubulin (NCBI accession no. EAX71592.1) from T. vaginalis, respectively (Table 1). The 25-, 50- and 73-kDa bands observed here by SDS–PAGE were identified by mass spectrometry as the light chains and heavy chains of mouse immunoglobulin (Table 1). To confirm the presence of these proteins, the genomic DNA from T. foetus was partially sequenced. Two sequences were identified as adenosine triphosphatase (NCBI accession no. JX399870 and JX399871) (Figs S1 and S2), and one sequence was identified as beta-tubulin (NCBI accession no. JX399872) (Fig. S3). The tBLASTn alignment showed that these proteins are conserved between T. vaginalis and T. foetus and are more than 80% identical (Table 1). To evaluate the probability of the monoclonal antibody recognized both proteins adenosine triphosphatase and tubulin, in silico peptide analyses on the primary sequences and tertiary structures were performed. Our results showed that the adenosine triphosphatase and beta-tubulin present few similar antigens (Fig. 9).

Fig. 9. Alignments of primary and tertiary structures between proteins and immunogenic peptides. (a) Primary structure alignment of adenosine triphosphatase with beta-tubulin immunogenic peptides. (b) Primary structure alignment of beta-tubulin with adenosine triphosphatase immunogenic peptides. In (a) and (b), the alignment sequences are marked with yellow, (*) indicates positions which have a fully conserved residue, (:) indicates conservation between groups of strongly similar properties, (.) indicates conservation between groups of weakly similar properties; (c) Tertiary alignment of homology model of adenosine triphosphatase structure (cartoon model) and beta-tubulin (stick model) immunogenic peptides; (d) Tertiary alignment of homology model of beta-tubulin structure (cartoon model) and adenosine triphosphatase (stick model) immunogenic peptides. Regions marked in yellow show the alignment regions on tertiary structure.
Table 1. Peptide: Displays the peptide sequences. MH+: Displays the molecular weight of the peptides. z: Sorts the peptides based upon the charge state in ascending order. P (pro): Displays the probability value for the protein (the probability values will be present only when a unified search file is loaded). P (pep): Displays the probability value for the peptide only if the unified search file was loaded. Sf: Displays the final score (Sf ) that indicates how good the protein match is (the Sf value is calculated using the XCorr, ΔCn, Sp, and RSp values, the peptide mass, the charge state, and the number of matched peptides for the search). Score XC: Displays the cross-correlation value between the observed peptide fragment mass spectrum and the one theoretically predicted. ΔCn: Sorts the peptides based upon the ΔCn value in descending order. MW: Sorts the proteins based upon the molecular weight of the protein in descending order. Sp: Sorts the peptides based upon the Sp value in descending order

DISCUSSION
The Golgi complex is involved in intracellular trafficking and contributes to several important cellular events. Despite its great importance, few publications specifically address the Golgi complex of T. foetus. Structurally, this organism has a large Golgi complex that has a number of membrane fenestrations, small vesicles associated with the lamellae and very thin filaments in the cisternae luminal space (Benchimol et al. Reference Benchimol, Elias and De Souza1982). In contrast to higher eukaryotes, the Golgi of T. foetus does not fragment during cell division (Benchimol et al. Reference Benchimol, Ribeiro, Mariante and Alderete2001) or when the cell is treated with drugs such as colchicine or nocodazole (Madeiro da Costa and Benchimol, Reference Madeiro da Costa and Benchimol2004). Several enzymes, e.g. thiamino-pyrophosphatase and acid phosphatase, have been reported in the T. foetus Golgi (Queiroz et al. Reference Queiroz, Santos, Benchimol and De Souza1991), but the protein composition and the biochemical mechanisms involved in processes of the T. foetus Golgi complex remain elusive.
In this study, monoclonal antibodies capable of recognizing the Golgi complex of T. foetus and T. vaginalis were combined with mass spectrometry analysis to address the protein composition of the Golgi in trichomonads. Two proteins, i.e. adenosine triphosphatase and putative beta-tubulin, were described in the Golgi complex of T. foetus. Previous studies described acid phosphatase activity in ATP biosynthesis in the Golgi complexes of T. vaginalis (Sharma and Bourne, Reference Sharma and Bourne1967; Nielsen, Reference Nielsen1974) and T. foetus (Müller, Reference Müller1973). In addition, the presence of Ca2+ ATPase(s) in Golgi membranes isolated from T. foetus was detected, suggesting that these proteins play a key role in the formation and maintenance of Ca2+ pools in this protozoan (Almeida et al. Reference Almeida, Benchimol, de Souza and Okorokov2003). These Ca2+ATPase(s) of T. foetus are similar to enzymes of the SERCA family (Sagara and Inesi, Reference Sagara and Inesi1991; Lytton et al. Reference Lytton, Westlin, Burk, Shull and MacLennan1992; Carafoli and Brini, Reference Carafoli and Brini2000), indicating that the trichomonad Golgi is equipped with an enzyme similar to that found in the ER of mammalian cells and the Golgi of plants (Lytton et al. Reference Lytton, Westlin, Burk, Shull and MacLennan1992; Ordenes et al. Reference Ordenes, Reyes, Wolff and Orellana2002).
Although putative beta-tubulin was identified by mass spectrometry, no microtubular structure was detected by mAb 20.3 (Figs 3d, f and 7). However, this protein has been described in the Golgi complex of trichomonads and microtubule (alpha- and beta-tubulin) connections were observed between the cisternae of the Golgi complex (Benchimol et al. Reference Benchimol, Ribeiro, Mariante and Alderete2001). In addition, in the NCBI database there are 145 structures showing the interaction between ATPases and tubulins. Although antigenic peptide analysis of the primary and tertiary structures of adenosine triphosphatase and beta-tubulin of T. foetus had presented common sites, the cross-reactivity between these proteins during the immunoprecipitation assays is remote, since these proteins present less than 15% of identity and they have different functions.
Due to absence of a fully sequenced T. foetus genome, one strategy to identify proteins was to use the T. vaginalis database because T. vaginalis is phylogenetically similar and its database contains more than 12 000 entries (Hampl et al. Reference Hampl, Pavlícek and Flegr2001; Carlton et al. Reference Carlton, Hirt, Silva, Delcher, Schatz, Zhao, Wortman, Bidwell, Alsmark, Besteiro, Sicheritz-Ponten, Noel, Dacks, Foster, Simillion, Van de Peer, Miranda-Saavedra, Barton, Westrop, Müller, Dessi, Fiori, Ren, Paulsen, Zhang, Bastida-Corcuera, Simoes-Barbosa, Brown, Hayes, Mukherjee, Okumura, Schneider, Smith, Vanacova, Villalvazo, Haas, Pertea, Feldblyum, Utterback, Shu, Osoegawa, de Jong, Hrdy, Horvathova, Zubacova, Dolezal, Malik, Logsdon, Henze, Gupta, Wang, Dunne, Upcroft, Upcroft, White, Salzberg, Tang, Chiu, Lee, Embley, Coombs, Mottram, Tachezy, Fraser-Liggett and Johnson2007). Choosing a database containing more than 1000 entries prevents the generation of misleading assignments and inaccurate FDR estimates (Knudsen and Chalkley, Reference Knudsen and Chalkley2011). To confirm these data, the T. vaginalis database was used to cross-reference the DNA sequences of the beta-tubulin and adenosine triphosphatase genes from T. foetus. The results showed that beta-tubulin and adenosine triphosphatase are conserved between the species. Two isoforms of the adenosine triphosphatase (accession no. A2F133_TRIVA and A2ES57_TRIVA) were identified on T. vaginalis draft genome using the Uniprot database (Fig. S4a). Although these isoforms present the same length (496 aa), their amino acid sequence composition differs by only one amino acid. The alignment of these sequences demonstrated that the isoform A2ES57_TRIVA presents an alanine in the second position on N-terminal region and the isoform A2F133_TRIVA possesses a serine (Fig. S4a). The beta-tubulin gene has five isoforms (accession no. A2EM81_TRIVA, A2DC16_TRIVA, Q27116_TRIVA, A2HG75_TRIVA and A2FPA6_TRIVA) with different length and molecular weight (Fig. S4b). The alignment of these sequences showed 71 588% of the identity, where among these only 55 amino acids are similar (Fig. S4b). Furthermore, the protein sequence analyses on Uniprot demonstrated that the predicted molecular weights of both adenosine triphosphatase and putative beta-tubulin are lower than those found in this study. These data suggest that these proteins get post-translational modification. One piece of evidence that supports the existence of adenosine triphosphatase with a higher molecular weight was published by another group that worked with Scherffelia dubia, an unicellular green algae. The paper described the isolation of highly purified membranes isolated from the Golgi complex in this organism and the identification of a 66-kDa protein as a subunit A of V-ATPase isolated in this organelle presumably associated with sorting processes at the endocytotic/exocytotic boundary of the Golgi complex (Grunow et al. Reference Grunow, Rüsing, Becker and Melkonian1999).
Until now, identification of the Golgi complex proteins in trichomonads was performed using cytochemical or immunocytochemical methods (Bozner, Reference Bozner1997; Benchimol et al. Reference Benchimol, Ribeiro, Mariante and Alderete2001; Lopes et al. Reference Lopes, Ribeiro and Benchimol2001). This study was the first to demonstrate the presence of ATPase and beta-tubulin, likely forming a complex using genomic and proteomic methodologies. In addition, the localization of these proteins using morphological techniques corroborates the validity of the approaches used in this work.
SUPPLEMENTARY MATERIAL
To view supplementary material for this article, please visit http://dx.doi.org/10.1017/S0031182013001455.
ACKNOWLEDGEMENTS
The authors thank Dr Igor Almeida (Department of Biological Sciences, University of Texas at El Paso, USA) for support with respect to the liquid chromatography–tandem mass spectrometry analysis and Tiana Tasca and Muriel Primon de Barros (Laboratório de Pesquisa em Parasitologia Universidade Federal do Rio Grande do Sul, Porto Alegre, RS, Brazil) for help with cell culture for isolation of genomic DNA.
FINANCIAL SUPPORT
This work was supported by the Conselho Nacional de Desenvolvimento Científico e Tecnológico (CNPq), the Fundação Carlos Chagas Filho de Amparo à Pesquisa do Estado do Rio de Janeiro (FAPERJ), the Coordenação de Aperfeiçoamento de Pessoal de Nível Superior (CAPES), the Programa de Núcleos de Excelência (PRONEX) and the Associação Universitária Santa Úrsula (AUSU). The project as also partially supported by Grant Number 5G12RR008124 (to the Border Biomedical Research Center (BBRC)/University of Texas at El Paso) from the National Center for Research Resources (NCRR), a component of the National Institutes of Health (NIH). The contents presented here are solely the responsibility of the authors and do not necessarily represent the official views of NCRR or NIH.