


INTRODUCTION
Phenology contributes to the reproductive success of populations, influencing plant fitness. Understanding mechanisms that underlie seasonal phenology of tropical species and communities is increasingly important to illuminate how plant populations respond to more frequent weather abnormalities like droughts (Cox et al. Reference COX, HARRIS, HUNTINGFORD, BETTS, COLLINS, JONES, JUPP, MARENGO and NOBRE2008, IPCC 2007), and phenological evolution (Elzinga et al. Reference ELZINGA, ATLAN, BIERE, GIGORD, WEIS and BERNASCONI2007). Temperature and photoperiod are often the most studied climatic cues influencing tropical plant phenology (Stevenson et al. Reference STEVENSON, CASTELLANOS, CORTÉS and LINK2008) and have been hypothesized to affect seed output (Kelly & Sork Reference KELLY and SORK2002). Climatic variables are clear cues for some species (Díaz & Granadillo Reference DÍAZ and GRANADILLO2005, Kelly et al. Reference KELLY, HARRISON, LEE, PAYTON, WILSON and SCHAUBER2000), but remain inconsistent for others (Piovesan & Adams Reference PIOVESAN and ADAMS2001, Sork & Bramble Reference SORK and BRAMBLE1993). Low minimum temperatures signal bud development in Peninsular Malaysia and Sarawak (Ashton et al. Reference ASHTON, GIVNISH and APPANAH1988) while dry-season severity (reviewed by Kozlowski & Pallardy Reference KOZLOWSKI and PALLARDY2002) and rainfall patterns trigger flowering of other tropical species (reviewed in van Schaik et al. Reference VAN SCHAIK, TERBORGH and WRIGHT1993).
Drivers of plant fitness can vary from site to site within the area occupied by a single population or community (Chapman et al. Reference CHAPMAN, CHAPMAN, STRUHSAKER, ZANNE, CLARK and POULSEN2005, Svenning et al. Reference SVENNING, ENGELBRECHT, KINNER, KURSAR, STALLARD and WRIGHT2006, Webb & Peart Reference WEBB and PEART2000) due to edaphic factors and topography (Harms et al. Reference HARMS, CONDIT, HUBBELL and FOSTER2001, Svenning et al. Reference SVENNING, KINNER, STALLARD, ENGELBRECHT and WRIGHT2004), and differences in species composition (Kilgore et al. Reference KILGORE, LAMBERS and ADLER2010, Royo & Carson Reference ROYO and CARSON2008), among others. The importance of habitat variability for plant growth, maintenance and reproduction is reflected in the predominance of classifications such as forest type – a term we use to distinguish localized heterogeneity in our study site.
Individual characteristics are also important determinants of flowering and subsequent seed production. Since plants accumulate resources over time, size, as expressed by tree diameter, can be positively correlated with seed production (Kainer et al. Reference KAINER, WADT and STAUDHAMMER2007, Naito et al. Reference NAITO, KANZAKI, NUMATA, OBAYASHI, KONUMA, NISHIMURA, OHTA, TSUMURA, OKUDA, LEE and MUHAMMAD2008) though these relationships vary among species (Hirayama et al. Reference HIRAYAMA, ITOH and YAMAKURA2004), and a weak or absent relationship between tree diameter and production has been reported in some tropical species (Newbery et al. Reference NEWBERY, CHUYONG and ZIMMERMANN2006, Norghauer et al. Reference NORGHAUER, NOCK and GROGAN2011). Conversely, crown liana loads can reduce fruit production (Kainer et al. Reference KAINER, WADT, GOMES-SILVA and CAPANU2006, Stevens Reference STEVENS1987) and suppress tree growth (Clark & Clark Reference CLARK and CLARK1990, Grauel & Putz Reference GRAUEL and PUTZ2004), though this suppression may have a more negative effect on some species than others (Schnitzer & Carson Reference SCHNITZER and CARSON2010).
This study explicitly examines reproductive phenology and seed production as influenced by multiple interacting factors across scales. We predicted that: (1) climatic cues would be most important in determining population-level phenology and seed production due to potential for large-scale resource limitation; (2) seed production would be significantly higher in occasionally inundated forests based on previous research indicating species preference for swamp forest (McHargue & Hartshorn Reference MCHARGUE and HARTSHORN1983a); (3) tree attributes such as diameter and liana load would be strongly implicated in determining individual seed production potential and would be consistent across forest types. We chose Carapa guianensis as a model species because it is a tropical tree that demonstrates pronounced temporal variability in seed production (McHargue & Hartshorn Reference MCHARGUE and HARTSHORN1983a).
METHODS
Study species
Carapa guianensis Aubl. (Meliaceae) is a tropical tree found in diverse forest types in the West Indies, Central America south of Honduras, many parts of the Amazon region, and tropical Africa (McHargue & Hartshorn Reference MCHARGUE and HARTSHORN1983a, Pennington Reference PENNINGTON, Smith, Mori, Henderson, Stevenson and Heald2004). Mature individuals can reach heights of 30 m (Ferraz et al. Reference FERRAZ, CAMARGO and SAMPAIO2002) and diameters of 2 m (Fournier Reference FOURNIER and Vozzo2003), though size does not reliably predict tree age (Vieira et al. Reference VIEIRA, TRUMBORE, CAMARGO, SELHORST, CHAMBERS, HIGUCHI and MARTINELLI2005). This species has economic value for both its timber and the repellant properties of its seed oil (Shanley & Medina Reference SHANLEY and MEDINA2005), though no harvests of either product occurred in our study site. This species exhibits predominantly prolonged synchronous flowering (Hall et al. Reference HALL, ORRELL and BAWA1994, though see Maués Reference MAUÉS2006) with timing and length varying by region (Leite Reference LEITE1997). Pollinators include stingless bees (Apidae) and butterflies (Riodinidae and Lycaenidae) (Maués Reference MAUÉS2006). Seeds are enclosed in a dehiscent capsule that normally breaks open upon impact with the ground, freeing seeds for germination or dispersal via water or frugivores (McHargue & Hartshorn Reference MCHARGUE and HARTSHORN1983a). Although seeds are subject to attack by Hypsipyla ferrealis moth larvae that eat the endosperm, the larvae may or may not consume enough to prevent germination or cause seedling mortality (McHargue & Hartshorn Reference MCHARGUE, HARTSHORN and Janzen1983b).
Rough estimates of seed production range from 50 to 200 kg of seeds per tree (Shanley & Medina Reference SHANLEY and MEDINA2005). Each C. guianensis fruit contains 4–20 seeds, weighing 20–40 g each (Cloutier et al. Reference CLOUTIER, KANASHIRO, CIAMPI and SCHOEN2007a). Mean (± SD) seed wet mass in our study site was 13.5 ± 3.2 g; mean seed dry mass was 7.1 ± 2.1 g (following 24 h in a 105 °C drying oven). Other published seed production estimates are based on samples of fewer than ten trees (Guedes et al. Reference GUEDES, SOUTO, CORREA, GOMES and Wadt2008, McHargue & Hartshorn Reference MCHARGUE and HARTSHORN1983a, Plowden Reference PLOWDEN2004), though more comprehensive production surveys were recently conducted in forests of Amazonian floodplains (Londres Reference LONDRES2009), terra firme and occasionally inundated sites (Tonini et al. Reference TONINI, KAMINSKI, DA COSTA, SCHWENGBER and Wadt2008). Annual variability in seed production, however, is still poorly understood, including the proportion of trees that periodically suspend production. Local variation in seed production by forest type also occurs (Klimas et al. Reference KLIMAS, KAINER and WADT2007, Londres Reference LONDRES2009).
Study site and forest types
The study was executed in the 1200-ha forest reserve of the Brazilian Agricultural Research Corporation (EMBRAPA) (10°01′28″S, 67°42′19″W), in the south-western portion of the State of Acre, Brazil. We established four 400 × 400-m (16-ha) plots within the reserve: two in areas of predominantly terra firme (upland) forest, and two in occasionally inundated forest (see Klimas et al. Reference KLIMAS, KAINER and WADT2011 for differences in forest composition and soils) with adjacent plot corners at least 500 m apart (Klimas et al. Reference KLIMAS, KAINER and WADT2007). Occasionally inundated forests are potentially flooded for a short period during the rainy season and differ from floodplain forests where most C. guianensis research has been conducted (Guariguata et al. Reference GUARIGUATA, CLAIRE and JONES2002, Plowden Reference PLOWDEN2004). Finally, our study region is close to the south-western limit of C. guianensis distribution in Amazonia where average annual temperature is 24.5 °C with a dry season from June to August (Instituto Nacional de Meteorologia unpubl. data).
Tree attributes and climatic variables
For each C. guianensis tree ≥10 cm dbh in the three plots (of the four installed, Klimas et al. Reference KLIMAS, KAINER and WADT2007), we recorded spatial coordinates, canopy position (dominant, co-dominant, intermediate or suppressed) following Smith et al. (Reference SMITH, LARSON, KELTY and ASHTON1997), diameter at breast height (dbh), total tree height, crown cross-sectional area, liana loads, tree abnormalities and reproductive status (Klimas et al. Reference KLIMAS, KAINER and WADT2007). With the exception of reproductive status, variables were recorded once between June and July 2004. The latter three variables were assigned binary values. Trees with ≥75% of their crowns loaded with lianas were given a value of one, whereas trees with < 75% were assigned a value of zero. Tree abnormalities were defined as any characteristic that could negatively affect tree function, such as evidence of a previous burn, or damaged or absent crown sections. Reproductive status was determined based on evidence of seed production either on or below the tree. Crown cross-sectional area was measured to the nearest 0.5 m along two axes: maximum crown diameter and a second diameter at a right angle to maximum diameter. Axes were measured from the ground, looking up. An ellipsoid formula was used to convert axis diameters to crown area (Kainer et al. Reference KAINER, WADT and STAUDHAMMER2007). Total tree height (distance from the base of the stem to the top of the crown) was measured with a SUUNTO optical height meter PM-5/1520 (clinometer), using a surveyor's tape to determine distance from clinometer to tree. We also calculated plot-level density of conspecific individuals >10 cm dbh to assess import of this variable.
Rainfall and temperature data were collected daily at noon at the Federal University of Acre approximately 8 km from our study site. Monthly mean temperature was averaged from the daily integrated mean temperatures for a given month. Maximum and minimum temperatures were also calculated monthly (Instituto Nacional de Meteorologia unpubl. data).
Phenology
We monitored reproductive activity of C. guianensis from September 2005 to June 2009 for a random sample of trees stratified by diameter class in the three plots (two in occasionally inundated forest and one in terra firme). Conspecifics with overlapping crowns and those whose seeds fell into waterways were excluded from the sample and replaced by another randomly selected individual. Initially, we observed 53 trees located in occasionally inundated forest and 23 in terra firme. After the first year, we included 28 additional randomly selected trees in terra firme forest, for a total of 51 trees. Diameter classes were 15 cm ≤ dbh ≤ 20 cm; 20 cm < dbh ≤ 30 cm; 30 cm < dbh ≤ 40 cm; and 40 cm > dbh. Sample sizes per class ranged from seven to 18 trees depending on natural density and probability of reproduction (Klimas et al. Reference KLIMAS, KAINER and WADT2007).
We used binoculars to conduct crown observations twice a month, beginning in September 2005. We recorded presence/absence of new leaves, flowers and falling fruits. If we observed flowers either on the ground below or in the canopy, the individual was classified as flowering. Carapa guianensis flowers are small and ground observations served both to validate binocular observations and identify trees where canopy flowers were hidden from view. Once three or more individuals from the entire sample population initiated flowering, we intensified monitoring from twice a month to weekly, which continued until the end of fruitfall. Beginning September 2007 to June 2009, we monitored all the sampled population weekly, regardless of phenological state (Table 1).
Table 1. The number of Carapa guianensis trees in Acre, Brazil, monitored for annual estimates of seed production and the time period in which production was quantified for each year of the 5-y study.

Below-tree seed counts
We quantified seed production per tree by collecting fallen seeds under a randomly selected subset of the phenology study population. Because selected trees did not overlap crowns with conspecifics and were not located immediately adjacent to water dispersal corridors, we assumed that gravity was the primary form of seed dispersal in the weekly period between visits and searched the entire area beneath tree crowns. The measurement period and number of sample trees in each environment varied annually. For our study, annual seed production refers to ecological seed production which can extend from November of one calendar year to June of the following in this region. Number of trees monitored and measurement period varied in each of the five study years (Table 1). Each time sample sizes were increased, they included all trees previously sampled for seed production, except for two trees measured in the second year and not in subsequent ones. We visited sampled trees weekly on the same day or within a 2-d period if rain or inclement weather delayed seed collection. Within 24 h of collection, seeds were taken to an on-site laboratory to record individual tree production by both seed count and total fresh weight. Seeds were subsequently dried at 105 °C, and after 24 h, we recorded seed dry weight and calculated water content of seeds as a percentage of fresh weight.
Measured seed production for the first 3 y likely underestimated total annual seed production due to non-continuous sampling. Thus, we estimated percentage seed production by ecological year that occurred outside observed 5- and 17-wk peaks during 2007–2008 and 2008–2009, respectively. We then added the average off-peak seed production (converted to seed number and weight) to estimate total annual seed production measured for 2004–2007. These calculations assumed that we captured the true peak of seedfall, an assumption corroborated by our year-round phenological observations. An estimated average of 1% and 18% of total seedfall in 2007–2009 occurred outside the 17-wk peak period in occasionally inundated and terra firme forest, respectively. An average of 24% and 40% of total seedfall in 2007–2009 fell outside of the 5-wk peak period in occasionally inundated and terra firme forest, respectively.
Seed removal and infestation
Seed counts below trees did not include seeds that had been potentially removed during the week-long interval between collection visits via predation or secondary dispersal (Vander Wall et al. Reference VANDER WALL, KUHN and BECK2005). In addition to our weekly quantification of seed production, in 2007–2009 we used a second method to estimate seed production by collecting and counting all fruit husks (pods) below parent trees. The entire area beneath the tree crowns was searched for fruit husks. Fruit-husk counts may better represent actual seedfall in species with high seed removal: the fibrous capsules decompose slowly, and each mature seed leaves a clear mark within the husk (Forget Reference FORGET1996). To estimate fruit numbers, we counted the total number of fruit husks (including those for intact fruits) and divided by four because the fruit is commonly described as a four-valved woody capsule (Fournier Reference FOURNIER and Vozzo2003, Pennington Reference PENNINGTON, Smith, Mori, Henderson, Stevenson and Heald2004). To estimate number of seeds per fruit, we counted the number of seeds for all intact fruits or seed imprints for those whose husks could be fitted together like a puzzle to recreate intact fruits in the laboratory (Forget Reference FORGET1996). We obtained 315 such intact fruits in 2007–2008 and 341 in 2008–2009. The mean number of seeds per fruit was multiplied by the husk-based fruit counts to estimate seed production per tree prior to removal; this comparison was done without separation by forest type. This number was compared with measured below-tree seed counts to estimate the extent of weekly seed removal.
Hypsipyla ferrealis Hampson (Pyralidae) moth larvae commonly attack C. guianensis seeds. Infested seeds have holes of 1–3 mm in diameter created when larvae enter and exit the seeds (McHargue & Hartshorn Reference MCHARGUE, HARTSHORN and Janzen1983b). In some cases, larvae were found in relatively intact seeds, and in other cases, complete consumption of the endosperm was observed. Collected seeds were carefully examined for evidence of Hypsipyla ferrealis. Seeds with entrance holes were classified as infested, irrespective of hole size or stage of infestation.
Data analysis
Modelling variation in seed production per tree. We modelled seed production per tree using a Poisson regression as a function of multiple predictor variables using the SAS procedure PROC GLIMMIX (version 9.2). Quantitative tree variables tested included dbh, tree height and crown cross-sectional area. Dbh2 was also tested as a potential predictor variable based on the quadratic relationship between dbh and fruit production observed for Bertholletia excelsa (Kainer et al. Reference KAINER, WADT and STAUDHAMMER2007). Class variables included forest type (occasionally inundated vs. terra firme), density (conspecific individuals ≥10 cm dbh within each 16-ha plot), liana load (< 25% or ≥75%) and abnormalities (0 or 1). Since forest types were not contiguous, there were no nested factors in the model other than the random effect of measurement dates. Quantitative climate predictor variables tested included total annual rainfall (of the year that flowering and fruit development occurred), rainfall during the annual 3-mo dry season from June to August prior to flowering, rainfall during the 5-mo wet season from January to May that preceded flowering, and annual mean maximum and minimum temperature, calculated as the mean of the monthly minimum and maximum temperatures, respectively. Since we measured weekly seed production of each tree, a repeated-measures structure, with the variance-covariance matrix structure specifically accounting for within-tree correlation of observations, was indicated. As trees in the same plot were likely more correlated than those in different plots, a within-plot structure was also indicated. Either our computers or SAS Version 9.2, however, did not have the computing power to estimate a generalized linear mixed model with Poisson response that included both a random effect to account for possible correlation between trees located in the same plot and a random effect to account for the repeated-measures nature of the data. Preliminary analyses were therefore performed in a general linear mixed modelling framework (normal response) and indicated that the magnitude of the random effect associated with trees within the same plot was negligible (less than one tenth) compared with that of the random effect for repeated measures. Consequently, we present an approximate model which explicitly accounts for the effect of repeated measurements over time. Further, we adjusted degrees of freedom associated with annually measured data in the model (e.g. wet-season rain and minimum temperature) to more accurately reflect the number of independent data points available for analysis. We examined the chi-square-versus-degrees-of-freedom statistic, or dispersion parameter, to evaluate the fit of models, and plotted Pearson-adjusted residuals to verify the assumptions of Poisson regression. In all cases, homoscedasticity and normality of the residuals were verified. Non-significant variables were dropped sequentially (based on P-values), using a backward stepwise model selection procedure to determine our final model. We also ran the model using 5-wk peak seedfall periods each year to confirm that the different temporal measurement periods between years did not affect results. If results were significant in both models (all data, and an alternate 5-wk peak seedfall model) and the direction of the effect was the same, we assumed that significance of results was not an artifact of sampling methodology. If this was not the case, or results were only marginally significant, we verified the direction and magnitude of interactions by examining least square mean plots and performing multiple comparison tests using Scheffe's method. Prior to model estimation, we used the SAS procedure PROC CORR to identify and potentially eliminate correlated model variables to avoid potential multicollinearity problems. Tree height was correlated with dbh (Pearson correlation coefficient (PCC) = 0.64), dbh2 (PCC = 0.60) and crown cross-sectional area (PCC = 0.59), and was thus eliminated from the model. Moreover, dbh is easily and commonly measured more accurately whereas height measurement is problematic in dense tropical forest. Total yearly rainfall also was dropped from the model. It was correlated with both dry-season rainfall (PCC = 0.66) and rainfall during the 5-mo rainy season (PCC = 0.71), the latter two being more biologically relevant drivers in determining flowering and fruiting than the more general yearly mean. Finally, we dropped mean temperature which was correlated with maximum (PCC = 0.86) and minimum temperatures (PCC = 0.76).
Synchronicity in fruiting. We also calculated three measures of seed production variability (Kelly & Sork Reference KELLY and SORK2002). First, to estimate variability in individual tree seed production (xCVi), we calculated the coefficient of variation (CV) of seeds per tree (based on actual seed counts) for each tree over the 5-y study period. We then took the mean of these individual tree CVs and calculated variability in seed production at the population level (CVp) by taking the mean number of seeds per tree (based on seed counts) for all sample trees over the 5-y period. Finally, we calculated synchronicity by calculating the Pearson correlation coefficients for all possible pairs of trees in the sample and calculating the mean of these CVs (xPCC) (Snook et al. Reference SNOOK, CÁMARA-CABRALES and KELTY2005), using the entire sample population from both forest types.
RESULTS
Phenology
Carapa guianensis individuals displayed two flowering peaks over a 12-mo period in 2007–2009. One peak initiated during the height of the dry season and concluded at the start of the rainy season, followed by a second smaller peak (lower percentage of trees flowering) during the rainy season (Figure 1). As the first set of flowers matured into fruits over 4 mo, some individuals flowered again, joined by trees that had not yet flowered that year (Figure 1). Trees in terra firme forest comprised the majority of individuals flowering and fruiting during this second peak (Figure 1). The percentage of flowering individuals increased in concert with rainy-season initiation in all years (Figure 1). In 2006, the greatest percentage of flowering individuals in occasionally inundated forest occurred 1-mo after the peak in terra firme forest. For all other years, we observed the greatest number of individuals with flowers in the two forest types concurrently (Figure 1).
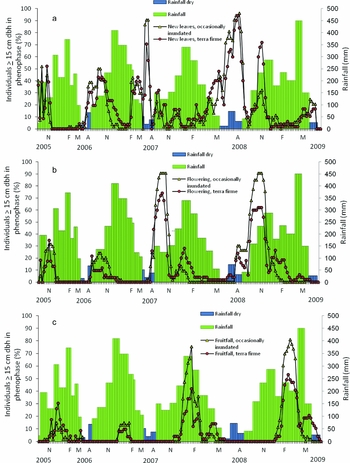
Figure 1. Percentage of monitored Carapa guianensis individuals in two forest types (occasionally inundated and terra firme) with evidence of reproductive activity superimposed on monthly precipitation values (mm): percentage of individuals ≥10 cm dbh with evidence of new leaves (a), flowers (b) and fruitfall (c). The blue-shaded precipitation bars represent the dry season in Acre, Brazil, which extends from June to August. The months of November (N), February (F), March (M), and August (A) are labelled on the x-axis within each of the years monitored.
Fruitfall commenced 4 mo after the onset of flowering, near the end of the rainy season, and mirrored the dual peaks observed in flowering (Figure 1). Timing of peak percentage of individuals with falling fruit was consistently close to annual peak in rainfall, with the exception of an anomalous high rainfall period at the end of the first fruitfall peak in 2009 (Figure 1). We observed no difference in fruiting peaks between forest types.
Seed production and synchrony
Seed production, or average number of seeds produced per tree, varied greatly by year with the highest years producing over nine times more than the lowest years (Figures 1 and 2). While seeds were collected over more months in 2007–2008 and 2008–2009, even when off-peak seed production estimates were added to the measured seed production for the first three years, the average number of seeds produced per tree was much greater in 2007–2008 and 2008–2009 (Figure 2, Table 3). This was true in both occasionally inundated and terra firme forests. Variability in seed production was moderate at the population level (CVp = 1.25) and individual level (xCVi = 1.24). The mean pairwise Pearson correlation coefficient, however, indicated low seed production synchrony in this population of C. guianensis (xPCC = 0.276).
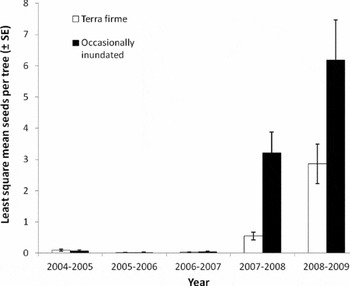
Figure 2. Least square mean values (± SE) of annual Carapa guianensis seed production in Acre, Brazil based on quantification during 5-wk peak seedfall.
Forest type, density, various tree attributes and several climatic cues explained seed production variation for our 5-y study. Total seed production was significantly different between forest types (P = 0.0008) (Table 2) with higher seed production in occasionally inundated forest. However, results from the alternative 5-wk peak seedfall model indicated that forest type was not a significant predictor of seed production (P < 0.369). When we further explored effects of forest type in this 5-wk model, we found significantly higher seed production in occasionally inundated forests, but only in years 2007–2008 and 2008–2009. Seed production in 2008–2009 in both forest types was higher than in other years, and trends corroborated that trees in occasionally inundated forest produced more seeds per tree than those in terra firme forest (Figure 2). The proportion of trees producing seeds was also higher in occasionally inundated forest (over 80%) in 2007–2009.
Table 2. Parameter estimates and tests of significance for Poisson regression model explaining variation in seed production of Carapa guianensis during the 5-y study in relation to predictor variables across multiple scales (regional climate cues, local heterogeneity and tree attributes) in Acre, Brazil. The second set of parameter estimates and tests of significance are from the Poisson model when only 5-wk peak seedfall periods were used for all years.
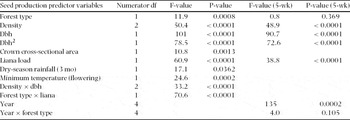
Table 3. Number of individuals sampled and average seed mass per tree (x) and standard error (SE) for Carapa guianensis. This table includes only measured seedfall; data shown do not include estimates of off-peak seed production not measured in the first 3 y of this study.

Diameter at breast height, dbh2, crown cross-sectional area, liana load, density, dry-season rainfall, wet-season rainfall and mean maximum temperature also explained seed production variation (Table 2). Dry-season rainfall was significant in explaining seed production variation (P = 0.0362) in the absence of wet-season rainfall. Wet-season rainfall was a slightly stronger predictor (P = 0.0145) in the absence of dry season rainfall. The two variables, however, were correlated (PCC = 0.333) and due to the potential biological implications of changes in dry-season rainfall, this variable was retained in the model. The chi-square-versus-degrees-of-freedom statistic for this model was 0.66, indicating that there was a small amount of under-dispersion with the model. Tree crown cross-sectional area had a slightly positive impact on seed production (P = 0.0014), though this relationship was not significant in the alternative model that used only 5-wk peak seedfall (Table 2). The chi-square-versus-degrees-of-freedom statistic for this latter model was 0.8, indicating a good fit. We assumed that this relationship would have been stronger without the confounding effect of non-producing trees; however, removing non-productive trees resulted in a weaker relationship. Dbh also explained seed production (P < 0.0001), displaying a quadratic relationship. Seed production increased with dbh until 40–50 cm, then decreased (Figure 3a). The interaction between dbh and density was significant with production peaking around 45 cm when densities were high (426 individuals per 16-ha plot). At lower densities, production increased to about 45 cm dbh and then tapered off at a slower rate, though this difference has low precision due to limited sample sizes of larger-dbh individuals (Figure 3b). Liana load demonstrated a negative relationship with seed production, but only in terra firme forests (forest type × liana P = 0.0011), such that those trees with ≥75% crown liana load produced significantly fewer seeds (P < 0.0001) (Figure 4). Mean maximum temperature also demonstrated a negative relationship with seed production. Conversely, rain measured during the region's 3-mo dry season was positively correlated with seed production.
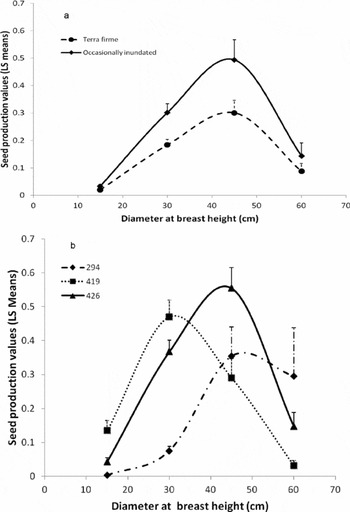
Figure 3. Relationship between per capita Carapa guianensis seed production and predictor values using least squared mean values (+ SE) in Acre, Brazil: relationship between dbh and seed production (a), and relationship between dbh and seed production at different plot-level densities of 294, 419 and 426 conspecifics (b). We used Excel to create a best-fit curve through the least square mean values using a Bezier curve for smoothing.
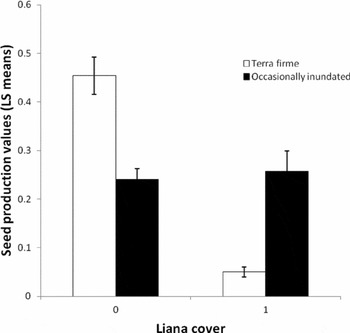
Figure 4. Relationship between per capita Carapa guianensis liana cover and seed production using least squared mean values in Acre, Brazil. Trees with ≥75% of their crowns loaded with lianas were given a value of one, whereas trees with < 75% were assigned a value of zero.
Seed removal and infestation
Based on the number of fruit husks and an average seed number per fruit of 8.9 ± 3.7 (SD), we estimated a 2007–2008 pre-removal seedfall of 26 010 ± 10 754 seeds. The actual number of seeds collected and weighed that year was 28 373. Similarly, the average 2008–2009 seed number per fruit was 8.8 ± 3.2, but estimated pre-removal seedfall was almost double: 51 541 ± 18 742 seeds. The actual number of seeds collected in 2008–2009 was 53 557, within the range of variation of our husk-based estimates of seedfall. A potential explanation for these low estimates was our assumption and use of four valves per fruit, based on C. guianensis botanical descriptions (Fournier Reference FOURNIER and Vozzo2003, Pennington Reference PENNINGTON, Smith, Mori, Henderson, Stevenson and Heald2004). Indeed, we observed variation in the number of fruit husk segments per fruit, but did not quantify it. While this may have affected our husk-based production estimates, high variation around average seed number per fruit provided a broad range of seed production.
Seed infestation by H. ferrealis in 2007–2008 was 14.6% and 15.5% for occasionally inundated forest and terra firme, respectively. In 2008–2009, infestation was 12.0% and 11.6% for occasionally inundated forest and terra firme, respectively. These values are per cent infestation results for all seeds sampled and pooled by forest type.
DISCUSSION
Using the tropical tree Carapa guianensis as a model species, this study demonstrates that multiple variables interact at different scales to influence seed production. At the largest scale, climatic cues (rainfall and temperature parameters) were central to setting overall patterns in reproductive phenology and seemed to best explain why years of high seed production were consistent across both forest types. Changes in precipitation, particularly in the dry season, are probably the most critical determinant of the climatic fate of the Amazon (Malhi et al. Reference MALHI, ROBERTS, BETTS, KILLEEN, LI and NOBRE2008). Between 30–50% of 23 climate models predict > 20% reduction in dry season rainfall for our study region (Malhi et al. Reference MALHI, ROBERTS, BETTS, KILLEEN, LI and NOBRE2008). As dry-season rainfall was positively correlated with seed production, reduced dry-season rainfall may indicate a decrease in C. guianensis fitness under future climatic conditions.
Annual patterns in flowering and fruitfall
Our findings corroborate other research that flowering peaks in seasonally dry forests tend to come at the transition between dry and rainy seasons (reviewed in van Schaik et al. Reference VAN SCHAIK, TERBORGH and WRIGHT1993); reproductive events generally occur during low photosynthetic activity or after high rates of reserve accumulation (Fenner Reference FENNER1998). This timing may be conducive to pollination, and is strategic for reproductive success. Only 4 mo separated the first evidence of flowers to initiation of fruitfall (though see Fournier Reference FOURNIER and Vozzo2003). Germinating seeds were well-positioned for water dispersal and enjoyed ample soil moisture for seedling development, though excessive rains can increase seedling mortality through fungal rot (Rigamonte-Azevedo Reference RIGAMONTE-AZEVEDO2010).
Our dataset showed annual consistency in flowering times. Individual trees, however, concurrently supported buds, flowers and developing fruits. The relative lack of synchrony points to tree water status as a possible driver of asynchrony (Borchert Reference BORCHERT1994). Tree moisture stress may be exacerbated in both forest types with reduced dry-season rainfall as predicted by climatic models (Malhi et al. Reference MALHI, ROBERTS, BETTS, KILLEEN, LI and NOBRE2008). Episodic rains prior to onset of heavier rains may have been the actual impetus for flowering; several species in Venezuela responded to episodic rains with water potential increases, flower initiation and new leaf production (Díaz & Granadillo Reference DÍAZ and GRANADILLO2005). From the work of Borchert (Reference BORCHERT1980) and Borchert et al. (Reference BORCHERT, RIVERA and HAGNAUER2002, Reference BORCHERT, MEYER, FLEGER and PORTER-BOLLAND2004) the most likely mechanism behind flowering is declining leaf water potential at the end of the wet season, which causes the formation of buds with new shoots. While climate models predict a substantial decline (>20%) in dry-season rainfall for this region, they also predict a smaller possibility of decreased wet-season rainfall (>0%) (reviewed in Malhi et al. Reference MALHI, ROBERTS, BETTS, KILLEEN, LI and NOBRE2008), complicating straightforward predictions of bud and shoot initiation. For C. guianensis, timing of flowering is likely also related to timing of vegetative phenology: initiation of flowering coincided with the peak in the number of individuals with new leaves. Reproductive events require substantial carbon reserves and the increased photosynthetic capacity of plants after leaf flush may help provide the necessary reserves for seed production.
Variation in seed production by forest type
We found significantly higher seed production per tree in occasionally inundated forest. Unmeasured micro-environmental characteristics, such as soil moisture or nutrient availability, may partially explain forest-type differences in seed production. Stand-level tree densities, however, might be a dominant and underlying cause of habitat-level seed production differences. High-density aggregations of flowering conspecifics may translate into higher individual reproductive success via increased pollen deposition and fruit production (Burd Reference BURD1994). Floral neighbourhoods differ based on aggregations of reproductive conspecifics, and these neighbourhoods are thought to have a major influence on individual reproductive success (Agren Reference AGREN1996, Feinsinger et al. Reference FEINSINGER, TIEBOUT and YOUNG1991 though see Bruna et al. Reference BRUNA, KRESS, MARQUES and DA SILVA2004). Increased spacing among terra firme trees may lower pollination visitation, thus reducing seed set and subsequent seed production – though Cloutier et al. (Reference CLOUTIER, HARDY, CARON, CIAMPI, DEGEN, KANASHIRO and SCHOEN2007b) found mean pollen flow distances of 69–355 m with no evidence of pollen-flow limitation at low C. guianensis densities. It is possible that C. guianensis densities at this site are above the threshold for pollen-flow limitation, though differences in flowering time may reduce the effective flowering neighbourhood, which would have a greater effect in lower-density terra firme forests.
Carapa guianensis seed production per tree varied moderately between years and between individuals, though seed output CVs are less reliable with fewer than 10 y of data (Kelly Reference KELLY1994). The CVp for C. guianensis was higher than the median value of 1.10 for 108 tropical species (Wright et al. Reference WRIGHT, JARAMILLO, PAVON, CONDIT, HUBBELL and FOSTER2005), but below the CVp of a strict masting species (i.e. 1.6) (Kelly Reference KELLY1994), which suspend population-level seed production in some years. Large oscillations of seed output by individuals between high- and low-production years may be the rule among polycarpic plants (Herrera et al. Reference HERRERA, JORDANO, GUITIÁN and TRAVESET1998), though some species show relatively constant population-level seed production between years, even with high individual variation (Kainer et al. Reference KAINER, WADT and STAUDHAMMER2007). These oscillations are important for determining annual regeneration. For Cecropia obtusifolia, a species with rapid germination, more than 90% of regeneration in a given year depended on seed rain for that year (Murray Reference MURRAY1988, Schupp et al. Reference SCHUPP, HOWE, AUGSPURGER and LEVEY1989). As C. guianensis seeds germinate within 3 mo (Klimas, pers. obs.), we expect that annual seed rain is also the predominant cause of same-year regeneration, though the longevity of this species has the potential to buffer it against increased climate-induced variability in vital rates (e.g. reproduction) (Morris et al. Reference MORRIS, PFISTER, TULJAPURKAR, HARIDAS, BOGGS, BOYCE, BRUNA, CHURCH, COULSON, DOAK, FORSYTH, GAILLARD, HORVITZ, KALISZ, KENDALL, KNIGHT, LEE and MENGES2008).
Part of the annual variation interaction may be explained by a fire in 2005 in the terra firme plot that stressed trees, reduced stored reserves available for reproduction, and increased mortality. This fire, however, coincided with an especially severe Amazonian drought that affected both forest types. Indeed, percentage of individuals flowering and total seed production were low in both forest types in 2005 and the subsequent year. Phillips et al. (Reference PHILLIPS, ARAGAO, LEWIS, FISHER, LLOYD, LOPEZ-GONZALEZ, MALHI, MONTEAGUDO, PEACOCK, QUESADA, VAN DER HEIJDEN, ALMEIDA, AMARAL, ARROYO, AYMARD, BAKER, BANKI, BLANC, BONAL, BRANDO, CHAVE, DE OLIVEIRA, CARDOZO, CZIMCZIK, FELDPAUSCH, FREITAS, GLOOR, HIGUCHI, JIMENEZ, LLOYD, MEIR, MEDOZA, MOREL, NEILL, NEPSTAD, PATINO, PENUELA, PRIETO, RAMIREZ, SCHWARZ, SILVA, SILVEIRA, THOMAS, TER STEEGE, STROPP, VASQUEZ, ZELAZOWSKI, DAVILA, ANDELMAN, ANDRADE, CHAO, ERWIN, DI FIORE, HONORIO, KEELING, KILLEEN, LAURANCE, CRUZ, PITMAN, VARGAS, RAMIREZ-ANGULO, RUDAS, SALAMAO, SILVA, TERBORGH and TORRES-LEZAMA2009) found a highly significant decrease in biomass immediately after the 2005 drought in 55 basin-wide plots as compared with the previous multiple decades (though see Huerte et al. Reference HUERTE, DIDAN, SHIMABUKURO, RATANA, SALESKA, HUTYRA, YANG, Nemani and MYNENI2006, Saleska et al. Reference SALESKA, DIDAN, HUERTE and DA ROCHA2007). Similarly, Samantha et al. (Reference SAMANTHA, GANGULY, HASHIMOTO, DEVADIGA, VERMONTE, KNYAZIKHIN, NEMANI and MYNENI2010) reported reductions in both PAR and surface shortwave radiation during the drought, further limiting species potential to rebuild stored reserves. Because we did not collect pre-drought data, we cannot distinguish whether our results represent natural variability or whether they are partially tree responses to severe drought stress. What we do know is that increased moisture stress is a dominant feature of some modelled 21st-century climate scenarios for Amazonia, particularly for southern Amazonia (Cox et al. Reference COX, HARRIS, HUNTINGFORD, BETTS, COLLINS, JONES, JUPP, MARENGO and NOBRE2008, IPCC 2007). This suggests less time for plants to recover biomass and reserves important to maintain previous flowering and fruiting levels.
Variation by tree attributes
Scaling down, individual tree attributes, particularly size, were also important in explaining variation in seed production. Indeed, the impact of dbh on seed production was greater than any other predictor variable. We found a quadratic relationship between seed production and dbh; trees in the middle diameter classes (30 < dbh < 50) were better producers than both smaller and larger trees (Figure 3a), a relationship also reported for Bertholletia excelsa (Kainer et al. Reference KAINER, WADT and STAUDHAMMER2007). In contrast, Swietenia macrophylla fruiting was erratic and unpredictable in populations, but generally more consistent in trees >75 cm dbh (Snook et al. Reference SNOOK, CÁMARA-CABRALES and KELTY2005). Two other tropical trees showed a more linear increase in seed production with increasing diameter (Nabe-Nielsen et al. Reference NABE-NIELSEN, KOLLMANN and PEÑA-CLAROS2009), though logging had removed larger individuals, distorting lifelong production patterns.
Our data revealed an expected negative association between liana load and seed production in terra firme forests (Stevens Reference STEVENS1987), a finding consistent for other tropical species (Kainer et al. Reference KAINER, WADT, GOMES-SILVA and CAPANU2006, Nabe-Nielsen et al. Reference NABE-NIELSEN, KOLLMANN and PEÑA-CLAROS2009, Wright et al. Reference WRIGHT, JARAMILLO, PAVON, CONDIT, HUBBELL and FOSTER2005), but see Londres (Reference LONDRES2009). Interestingly, this effect was not consistent between forest types, perhaps because of a higher percentage of liana cover in the 40–50-cm dbh class (one of the two most productive 10 cm diameter classes) in terra firme forest (Figure 5). Mechanical stress from lianas forces trees to increase stem diameter at the expense of height (Schnitzer et al. Reference SCHNITZER, KUZEE and BONGERS2005, but see Toledo-Aceves & Swaine Reference TOLEDO-ACEVES and SWAINE2008), which may reduce available light for photosynthesis and subsequent resources for reproduction. Lianas may be rising in abundance and density in forests worldwide (Phillips et al. Reference PHILLIPS, MARTINEZ, ARROYO, BAKER, KILLEEN, LEWIS, MALHI, MENDOZA, NEILL, VARGAS, ALEXIADES, CERON, DI FIORE, ERWIN, JARDIM, PALACIOS, SALDIAS and VINCETI2002, Wright et al. Reference WRIGHT, CALDERON, HERNANDEZ and PATON2004) due to elevated CO2 or changes in land use, forest productivity, or rainfall (Körner Reference KÖRNER2006, Schnitzer Reference SCHNITZER2005). How these global trends, however, might affect our study population or C. guianensis populations elsewhere remains unclear.
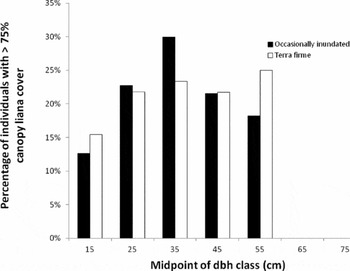
Figure 5. Percentage of Carapa guianensis individuals with liana cover ≥75% of canopy stratified according to diameter class in Acre, Brazil.
Influence of climate cues
While mean annual maximum temperature was negatively correlated with seed production, temperature may not have acted independently of other factors. The three years with the highest annual mean maximum temperature also had the least dry-season rainfall. Indeed, very few studies have demonstrated that phenological patterns are triggered by temperature and not by covariates, such as cloud cover, day length and solar elevation (Stevenson et al. Reference STEVENSON, CASTELLANOS, CORTÉS and LINK2008) which generate substantial seasonal variation in tropical irradiance (van Schaik et al. Reference VAN SCHAIK, TERBORGH and WRIGHT1993) and thus, potentially phenological patterns (Wright et al. Reference WRIGHT, CARRASCO, CALDERÓN and PATON1999, Zimmerman et al. Reference ZIMMERMAN, WRIGHT, CALDERON, PAGAN and PATON2007). Indeed, 2005 was characterized by lower available sunlight due, in part, to atmospheric aerosols because of biomass burning (Bevan et al. Reference BEVAN, NORTH, GREY, LOS and PLUMMER2009) from a region-wide drought (Marengo et al. Reference MARENGO, NOBRE, TOMASELLA, OYAMA, SAMPAIO DE OLIVEIRA, DE OLIVEIRA, CAMARGO, ALVES and BROWN2008).
Dry-season rainfall was positively correlated with seed production. Slightly higher than normal dry-season rains may allow trees access to a seasonally scarce resource, increasing stored reserves available for flowering and fruiting. For Microberlinia bisculata, masting occurred when the dry season before fruiting was drier and the wet season wetter, than average (Newbery et al. Reference NEWBERY, CHUYONG and ZIMMERMANN2006). The dry season is also when trees can accumulate new carbon resources by photosynthesis, and in our study, dry-season rainfall coincided with leaf production (Figure 1a).
Against a backdrop of drier conditions induced by climatic changes, rainfall is also influenced by the occurrence of the El Niño southern oscillation; El Niño events bring warm, dry, sunny conditions to the wet tropics. Wright et al. (Reference WRIGHT, CARRASCO, CALDERÓN and PATON1999) twice observed high fruit production during El Niño events followed by low-level fruit production a year later during a mild dry season in Panama, perhaps due to sunny conditions. Conversely, a significant drop in Bertholletia excelsa fruit production coincided with low rainfall in an El Niño year (Wadt and Kainer unpubl. data; Zuidema & Boot Reference ZUIDEMA and BOOT2002). There may be a similar pattern with data from our study: the El Niño years 2004–2005 and 2006–2007 were associated with low fruitfall while the La Niña year of 2007–2008 was associated with high levels of seed production. The El Niño year in 2005 coincided with the severe Amazonian drought (Marengo et al. Reference MARENGO, NOBRE, TOMASELLA, OYAMA, SAMPAIO DE OLIVEIRA, DE OLIVEIRA, CAMARGO, ALVES and BROWN2008). If results from these species are an indication of basin-wide trends, El Niño or drought years may be associated with further decreased seed production for some tropical species, though less severe droughts may enhance fruit production (Wright et al. Reference WRIGHT, CARRASCO, CALDERÓN and PATON1999).
This study provides an instructive approach toward understanding which factors may most strongly determine patterns in reproductive phenology, though we recommend further study of temporal seed production trends and variability as we captured only a snapshot in the life of this long-lived species. Our multi-scale approach can help tease out which production controls are most likely to be affected by anticipated climate change or ongoing changing precipitation patterns in the tropics. Patterns and processes that manifest at one scale can be completely different, or even counteractive at broader or finer scales (Levin Reference LEVIN1992, Sagarin & Pauchard Reference SAGARIN and PAUCHARD2010), and exploring these detailed scalar differences facilitates understanding and predictions of expected impacts of environmental changes at species, community and landscape levels.
ACKNOWLEDGEMENTS
During data collection and preparation of this paper, C. Klimas was supported by a College of Agricultural and Life Sciences Research Assistantship at the University of Florida (UF), a U.S. Environmental Protection Agency Science to Achieve Results (STAR) fellowship, UF Working Forests in the Tropics Integrative Graduate Education and Research Traineeship (IGERT), and a Tropical Conservation and Development Graduate Assistantship. The IGERT, STAR, a Woods Hole Field Research Grant, Garden Club of America Caroline Thorn Kissel Summer Environmental Studies Scholarship, an Institute of Food and Agricultural Sciences travel grant, an Agricultural Women's Scholarship and the Explorer's Club provided funds for research and travel in Brazil. E. Bruna, W. Cropper and D. Carter provided helpful comments on the manuscript. The Brazilian Agricultural Research Corporation (Embrapa) provided technical assistance and institutional support for data collection. I sincerely appreciate all the employees who assisted with data collection.


