


NOMENCLATURE:
- ax , ay , az
-
accelerations along x, y and z body axes, m/s2
- a 1
-
static stall characteristic parameter
-
 $\bar{c}$
-
mean aerodynamic chord, m
- CD, CL
-
coefficients of drag and lift force, respectively
- C D 0 , C L 0
-
coefficients of drag and lift force at zero angle-of-attack
- C L α
-
lift curve slope, per radian
- Cm
-
coefficients of pitching moment
- C Lq , C mq
-
lift and pitching moment coefficient derivatives with regard to pitch rate
- CD X, CmX
-
drag and pitching moment coefficient derivatives with regard to flow separation point
- g
-
acceleration due to gravity, m/s2
- Ix , Iy , Iz
-
moment of inertia about x, y and z body axes, respectively, kg·m2
- J
-
cost function
- k
-
induced drag correction factor
- m
-
aircraft mass, kg
- p, q, r
-
roll, pitch and yaw rates, respectively, rad/s
- s
-
wing planform area, m2
- T
-
thrust of the engine, N
- u, v, w
-
airspeed components along x, y and z axis of aircraft, m/s
- V
-
airspeed, m/s
- X
-
flow separation point
- Z
-
measured flight data
- α, β
-
angle-of-attack and angle of slide slip, degrees
- δ a , δ e , δ r
-
aileron, elevator and rudder deflection angles, degrees
- ϕ, θ, ψ
-
angles of roll, pitch and yaw, degrees
- ρ
-
density, kg/m3
- Θ
-
vectors of unknown parameters
- α*
-
break point, degree
- τ1, τ2
-
transient and hysteresis time constants, respectively, seconds
- λ
-
taper ratio

1.0 INTRODUCTION
System identification is the process of identifying an adequate mathematical model for the system under consideration(Reference Jategaonkar1). Parameter estimation is the subset of system identification process which involves estimation of various parameters that contained in the selected mathematical model to represent the system(Reference Jategaonkar1,Reference Hamel and Jategaonkar2) . The parameters that exist in the mathematical model are estimated by minimizing the error between computed response and measured variables. These measurements include state variables and control inputs that characterize the behaviour of the system. In general, parameter estimation of atmospheric flight vehicles focus on quantifying various aerodynamic stability and control derivatives (parameters) that are used to represent the aerodynamic model structure of the system(Reference Jategaonkar1,Reference Hamel3) . The early design stage estimation techniques such as analytical methods, computational techniques and wind-tunnel measurements also provide reasonable estimates, but their reliability is limited. Some of the reasons may be attributed to the availability of historical databases, mathematical approximations, boundary conditions, scale effects and Reynolds number duplication as well as sting and wall interferences, respectively. Parameter estimation from flight data will overcome these limitations and also provides the respective confidence level of the estimates.
One of the reasons for uncertainty in the estimates from the flight data of the manned aircraft is due to the insufficient excitation of control input forms(Reference Hamel and Jategaonkar2,Reference Klein and Morelli4) . For example, in order to identify the dynamic stall characteristic parameters using parameter estimation techniques, the flight data used for estimation should consist of the entire uncontrolled stall envelope, which is generally very difficult to achieve in manned flights. Although most manned fighter aircrafts serve the purpose, deploying unmanned vehicles to perform high angle-of-attack manoeuvers will complement the application of manned fighter aircraft and are also less damaging during distress due to the absence of an onboard pilot. The current research is an attempt to address this problem by performing the flight tests at low and moderately high angles of attack using the designed un-manned configuration. Since these unmanned flights were remotely operated, the high angle-of-attack manoeuvers were performed with much greater ease, comfort and safety compared to manned flights.
In the recent decades, the application of these unmanned planforms in the defence sector has enormously increased. Military drone designs started adopting the delta wing/highly swept wing configurations due to the desire for low observability or stealth during reconnaissance as well as combat. Research on high angle-of-attack flight has been mainly focused on the aerodynamic modelling of manned fighter aircraft. Many scholars carried out detail research on the non-linear modelling of conventional fixed wings, delta wings and swept wings from different perspectives. Goman and Khrabrov(Reference Goman, Khrabrov, Goman and Khrabrov5) have developed a state space representation of aerodynamic characteristics of an aircraft at high angle-of-attack; the problem related to unsteady aerodynamic model identification of a delta wing at high angles of attack was also addressed. Leishman and Nguyen(Reference Leishman and Nguyen6) modelled the unsteady aerodynamic behaviour of the aerofoil using state space representation. Nelson and Pelletier(Reference Nelson and Pelletier7) have used the Non-linear Indicial Response (NIR) method to represent the aerodynamic functions in the non-linear regime of F-18 and X-31 aircraft. Researchers have also used fuzzy and neural-based methods for identification of non-linear models of F-18 and X-31 aircraft as well as helicopters(Reference Anton, Botez and Popescu8-Reference Boëly and Botez11). Fischenberg and Jategaonkar(Reference Fischenberg and Jategaonkar12) have presented the quasi-steady-stall modelling modelling of C-160 military transport aircraft and also discussed the parameter estimation of the aerodynamic coefficients of the proposed steady-stall model. Chowdhary and Jategaonkar(Reference Chowdhary and Jategaonkar13) have carried out parameter estimation from flight data using an unscented Kalman filter. Ghoreyshi and Cummings(Reference Ghoreyshi and Cummings14) have applied a time-dependent surrogate method to model the unsteady aerodynamics for various aircraft manoeuvers. Gabor et al have presented aerodynamic optimization at high angles of attack of unmanned aerial vehicles using a morphing wing approach(Reference Sugar Gabor, Simon, Koreanschi and Botez15). Kumar et al(Reference Kumar and Ghosh16,Reference Kumar, Misra and Ghosh17) have performed the non-linear aerodynamic modelling of cascade fins at near-stall angles of attack for various gap-to-chord ratios (g/c) using a steady-state stall model. It is generally observed from the contemporary research that the main focus is on non-linear aerodynamic modelling of fighter aircraft and the flight vehicles related to military applications. The research on high angle-of-attack modelling of the unmanned aerial systems is currently attracting more attention.
Aerodynamics pertaining to the static attached flow conditions can be adequately modelled by using the time-invariant aerodynamic parameters and linear models. However, the postulation of an exact non-linear aerodynamic model is another issue that needs attention. Extensive investigations in the field of non-linear aerodynamics associated with aerodynamic stall at high angles of attack have recently been undertaken using computational fluid dynamic methods, wind-tunnel tests and semi-empirical methods. The present research work uses Kirchhoff's flow separation model(Reference Jategaonkar1) to perform the high angles of attack aerodynamic modelling of the designed unmanned configuration. It is generally observed that the classical Maximum Likelihood (ML) method has been used extensively to estimate the parameters from high angle-of-attack flight data(Reference Jategaonkar1,Reference Goman, Khrabrov, Goman and Khrabrov5,Reference Leishman and Nguyen6) . However, in recent times, neural-based methods such as Neural Gauss Newton (NGN) have also been used for aerodynamic characterization of manned aircraft from low as well as high angle-of-attack flight data(Reference Kumar, Misra and Ghosh18-Reference Dhayalan21). The present research work highlights the application of ML and NGN methods for parameter estimation of unmanned aerial vehicle in low and high angle-of-attack flight regimes. For this purpose, an unmanned aerial vehicle with a cropped delta planform and rectangular cross section (flat plate) has been designed and fabricated in-house at a flight laboratory at the Indian Institute of Technology Kanpur (IITK). The designed unmanned cropped delta flat plate (CDFP) configuration has been instrumented to acquire flight data during the flight tests(Reference Saderla22,Reference Saderla, R and Ghosh23) .
2.0 FLOW SEPARATION MODEL—KIRCHHOFF'S THEORY
For stationary attached flow conditions, the aerodynamic behaviour of the system can be described with a set of time-invariant parameters and linear models(Reference Jategaonkar1). However, for a flight vehicle undergoing high angle-of-attack manoeuvers, the aerodynamic model structure becomes highly non-linear due to flow separation and unsteady effects. During these manoeuvers, the lift generated by the flight vehicle will be strongly influenced by the unsteady effects. These effects are dominant in the post-stall region, and the type of flow separation differs from one configuration to other. Postulating this complex flow phenomenon in an analytical form suitable for parameter estimation is very difficult. Researchers have followed an alternate approach based on Kirchhoff's theory of flow separation to analytically describe the flow separation point, including the hysteresis as a function of internal state variables(Reference Jategaonkar1). Based on Kirchhoff's theory of flow separation points, for an asymmetrical profile, the total lift acting on the wing can be modelled as a function of angle-of-attack (α) and flow separation point (X).
 $$\begin{equation}
{C_L}\left( {\alpha ,\ X} \right) = \ {C_{{L_0}}}\ + \ {C_{{L_\alpha }}}{\left\{ {\frac{{1 + \ \sqrt X }}{2}} \right\}^2}\alpha
\end{equation}$$
$$\begin{equation}
{C_L}\left( {\alpha ,\ X} \right) = \ {C_{{L_0}}}\ + \ {C_{{L_\alpha }}}{\left\{ {\frac{{1 + \ \sqrt X }}{2}} \right\}^2}\alpha
\end{equation}$$
where C L α is the lift curve slope.
The position of the flow separation point in Equation (1) can be described by using the following single ordinary differential equation(Reference Jategaonkar1):
 $$\begin{equation}
{\tau _1}\ \frac{{dX}}{{dt}} + X = \ \frac{1}{2}\left\{ {1 - {\rm{tanh}}\left[ {{{\rm{a}}_1}\left( {\alpha - {\tau _2}\dot{\alpha } - \ {\alpha ^*}} \right)} \right]} \right\}
\end{equation}$$
$$\begin{equation}
{\tau _1}\ \frac{{dX}}{{dt}} + X = \ \frac{1}{2}\left\{ {1 - {\rm{tanh}}\left[ {{{\rm{a}}_1}\left( {\alpha - {\tau _2}\dot{\alpha } - \ {\alpha ^*}} \right)} \right]} \right\}
\end{equation}$$
where τ1 and τ2 are transient and hysteresis time constants, respectively. The terms a1 and α* correspond to the static stall characteristic of the aerofoil and break point, respectively. The non-dimensional term X (0 ⩽ X ⩽ 1) represents the instantaneous location of idealized flow separation point on the upper surface of the wing(Reference Jategaonkar1).
Equation (2) is a generalized mathematical model used to estimate the flow separation point including the hysteresis and unsteady effects. In order to estimate the parameters a1, α*, τ1 and τ2, the flight manoeuvers should contain a dynamic stall manoeuver, which is in general a difficult task to perform. As an alternative, the execution of a quasi-steady-stall manoeuver is relatively less difficult and risky than the dynamic stall manoeuver. Therefore, a simplified approach accounting for quasi-steady-stall characteristics (a1, α* and τ2) has been used for the estimation from flight data(Reference Jategaonkar1). Accordingly, the transient effects were neglected by setting τ1 to zero in Equation (2). Therefore, the following mathematical model is sufficient to adequately model the stall hysteresis.
 $$\begin{equation}
X = \ \frac{1}{2}\left\{ {1 - {\rm{tanh}}\left[ {{{\rm{a}}_1}\left( {\alpha - {\tau _2}\dot{\alpha } - \ {\alpha ^*}} \right)} \right]} \right\}
\end{equation}$$
$$\begin{equation}
X = \ \frac{1}{2}\left\{ {1 - {\rm{tanh}}\left[ {{{\rm{a}}_1}\left( {\alpha - {\tau _2}\dot{\alpha } - \ {\alpha ^*}} \right)} \right]} \right\}
\end{equation}$$
Further to estimate the static stall characteristic parameters from the aerodynamic database generated through wind-tunnel testing, the hysteresis term (τ2) in Equation (3) is set to zero. This is due to the fact that most of generated static wind-tunnel data do not include the hysteresis effects. Hence, by performing the above modifications in Equation (3), Kirchhoff's steady state flow separation point can be modelled as follows(Reference Jategaonkar1):
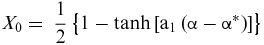 $$\begin{equation}
{X_0} = \ \frac{1}{2}\left\{ {1 - {\rm{tanh}}\left[ {{{\rm{a}}_1}\left( {\alpha - {\alpha ^*}} \right)} \right]} \right\}
\end{equation}$$
$$\begin{equation}
{X_0} = \ \frac{1}{2}\left\{ {1 - {\rm{tanh}}\left[ {{{\rm{a}}_1}\left( {\alpha - {\alpha ^*}} \right)} \right]} \right\}
\end{equation}$$
With this backdrop, Kirchhoff's steady-state stall model and quasi-steady-stall models have been used to model the non-linear aerodynamic behaviour of CDFP configuration from an aerodynamic database generated through wind-tunnel testing and flight data, respectively.
3.0 METHODS FOR PARAMETER ESTIMATION
The aerodynamic characterization of the CDFP configuration from high angles-of-attack flight data was performed by using a conventional ML method and a neural-based NGN method. A brief explanation of each method used is presented in the following subsections.
3.1 Maximum likelihood method
For more than three decades, Maximum Likelihood parameter estimators have been successfully applied for the estimation of the aircraft parameters (stability and control derivatives) using flight data(Reference Jategaonkar1,Reference Mehra, Stepner and Tyler24) . The application of the ML method to the flight data of an aircraft requires the postulation of a suitable aerodynamic model. Application of the ML method to the flight data with measurement noise has been accepted as a standard approach for the estimation of aircraft parameters. However, in the presence of process noise, an ML estimator might lead to convergence problems and other practical difficulties. In particular, the output error method will provide poor estimation results in the presence of process noise, whereas with the filter error method will account for process noise in the estimation process at the cost of additional complexity in the computation of the estimates. The main advantage of the ML method is that the estimates are asymptotically normal, which is an advantage when estimating the same set of parameters from multiple sets of flight test data. The method also provides a measure of accuracy in terms of the Cramér-Rao bounds as a part of the ML algorithm(Reference Jategaonkar1,Reference Mehra, Stepner and Tyler24) . The cost function is the function of difference between the measured and computed time histories. For a known measurement noise covariance matrix, Equation (5) presents the cost function to be minimized using ML method:
 $$\begin{equation}
{\rm{J}}\left( {\rm{\Theta }} \right) = \left( {1/2} \right)\mathop \sum \limits_{{\rm{i}} = 1}^{\rm{N}} \left\{ {{{\left[ {{\rm{Z}}\left( {{{\rm{t}}_{\rm{i}}}} \right) - {{\rm{Z}}_{\rm{\Theta }}}\left( {{{\rm{t}}_{\rm{i}}}} \right)} \right]}^{\rm{T}}}{{\left( {{\rm{G}}{{\rm{G}}^{\rm{T}}}} \right)}^{ - 1}}\left[ {{\rm{Z}}\left( {{{\rm{t}}_{\rm{i}}}} \right) - {{\rm{Z}}_{\rm{\Theta }}}\left( {{{\rm{t}}_{\rm{i}}}} \right)} \right]} \right\}
\end{equation}$$
$$\begin{equation}
{\rm{J}}\left( {\rm{\Theta }} \right) = \left( {1/2} \right)\mathop \sum \limits_{{\rm{i}} = 1}^{\rm{N}} \left\{ {{{\left[ {{\rm{Z}}\left( {{{\rm{t}}_{\rm{i}}}} \right) - {{\rm{Z}}_{\rm{\Theta }}}\left( {{{\rm{t}}_{\rm{i}}}} \right)} \right]}^{\rm{T}}}{{\left( {{\rm{G}}{{\rm{G}}^{\rm{T}}}} \right)}^{ - 1}}\left[ {{\rm{Z}}\left( {{{\rm{t}}_{\rm{i}}}} \right) - {{\rm{Z}}_{\rm{\Theta }}}\left( {{{\rm{t}}_{\rm{i}}}} \right)} \right]} \right\}
\end{equation}$$
where N is number of time points, GGT is measurement noise covariance matrix, and Z Θ(ti ) is the computed response estimate of Z at ti (ti is the ith data point) for a given value of the unknown parameter vector Θ. The matrix GGT can be approximated by a diagonal matrix. The detailed description of the ML method can be found in Refs. Reference Jategaonkar1 and Reference Mehra, Stepner and Tyler24.
3.2 Neural Gauss Newton method
Neural-Gauss-Newton method is a new approach for parameter estimation of a flight vehicle using Artificial Neural Networks (ANN). The NGN method uses Feed-Forward Neural Networks (FFNN) to establish a neural model that could be used to predict subsequent time histories given the suitable measured initial conditions(Reference Kumar and Ghosh16,Reference Peyada and Ghosh20,Reference Dhayalan21) . The neural model in this case develops point-to-point mapping of input and output data. Thus, it could be referred to as a flight dynamic model in the restricted sense. The Gauss-Newton method is then used to obtain optimal values for the aerodynamic parameters by minimizing a suitable error cost function. Unlike most classical parameter estimation methods, the NGN method does not require mathematical description of the system (i.e. the equations of motion). It also bypasses the requirement of solving equations of motion. This feature of the NGN method may have significance in handling process noise.
With the NGN method, the measured compatible flight data is used to train the neural model. The algorithm uses FFNNs to create a neural model using time histories of motion and control variables of aircraft in flight. Once the neural model is validated, it can be used to compute responses for any arbitrary control input. However, the trained neural model does not represent a generic flight dynamic model. This neural model can only be used to predict time histories of motion variables at (k +1)th instant given the measured initial conditions corresponding to kth instant (where k = 1 to n: and n is the total number of discrete data points). It has been shown that for all practical purposes for parameter estimation, this approach helps in building a flight dynamic model (in a restricted sense) using measured input-output data(Reference Kumar and Ghosh16,Reference Peyada and Ghosh20,Reference Dhayalan21,Reference Kumar and Ghosh25) .
Figure 1 presents the schematic of the neural architecture for the longitudinal flight dynamics during training. The input vector, U(k), and the output vector, Z(k+1), for the neural training are formed with the help of measured state variables.
 $$\begin{equation}
U\left( k \right) = {\left[ {\begin{array}{*{20}{c}} {\begin{array}{*{20}{c}} {\alpha \left( k \right)}&{\theta \left( k \right)}&{q\left( k \right)} \end{array}}&{\begin{array}{*{20}{c}} {V\left( k \right)}&{{C_D}\left( k \right)}&{{C_L}\left( k \right)} \end{array}}&{{C_m}\left( k \right)} \end{array}} \right]^T}\ ,\\
\end{equation}$$
$$\begin{equation}
U\left( k \right) = {\left[ {\begin{array}{*{20}{c}} {\begin{array}{*{20}{c}} {\alpha \left( k \right)}&{\theta \left( k \right)}&{q\left( k \right)} \end{array}}&{\begin{array}{*{20}{c}} {V\left( k \right)}&{{C_D}\left( k \right)}&{{C_L}\left( k \right)} \end{array}}&{{C_m}\left( k \right)} \end{array}} \right]^T}\ ,\\
\end{equation}$$
 $$\begin{equation}
Z\left( {k + 1} \right) = {\left[ {\begin{array}{*{20}{c}} {\begin{array}{*{20}{c}} {\alpha \left( {k + 1} \right)}&{\theta \left( {k + 1} \right)}&{q\left( {k + 1} \right)} \end{array}}&{\begin{array}{*{20}{c}} {V\left( {k + 1} \right)}&{{a_x}\left( {k + 1} \right)}&{{a_z}\left( {k + 1} \right)} \end{array}} \end{array}} \right]^T}\ ,
\end{equation}$$
$$\begin{equation}
Z\left( {k + 1} \right) = {\left[ {\begin{array}{*{20}{c}} {\begin{array}{*{20}{c}} {\alpha \left( {k + 1} \right)}&{\theta \left( {k + 1} \right)}&{q\left( {k + 1} \right)} \end{array}}&{\begin{array}{*{20}{c}} {V\left( {k + 1} \right)}&{{a_x}\left( {k + 1} \right)}&{{a_z}\left( {k + 1} \right)} \end{array}} \end{array}} \right]^T}\ ,
\end{equation}$$

Figure 1. Neural architecture for longitudinal flight dynamic model during training.
 $$\begin{equation}
{C_X}\left( k \right) = \left( {m{a_{{X_{CG}}}}\left( k \right) - T} \right)/\bar{q}\left( k \right)S,
\end{equation}$$\\
$$\begin{equation}
{C_X}\left( k \right) = \left( {m{a_{{X_{CG}}}}\left( k \right) - T} \right)/\bar{q}\left( k \right)S,
\end{equation}$$\\
 $$\begin{equation}
{C_Z}\left( k \right) = \ m{a_{{Z_{CG}}}}\left( k \right)/\bar{q}\left( k \right)S\ ,
\end{equation}$$\\
$$\begin{equation}
{C_Z}\left( k \right) = \ m{a_{{Z_{CG}}}}\left( k \right)/\bar{q}\left( k \right)S\ ,
\end{equation}$$\\
 $$\begin{equation}
{C_L}\left( k \right) = {C_X}\left( k \right)\sin \alpha \left( k \right) - {C_z}\left( {\rm{k}} \right)\cos \alpha \left( k \right),
\end{equation}$$\\
$$\begin{equation}
{C_L}\left( k \right) = {C_X}\left( k \right)\sin \alpha \left( k \right) - {C_z}\left( {\rm{k}} \right)\cos \alpha \left( k \right),
\end{equation}$$\\
 $$\begin{equation}
{C_D}\left( k \right) = - {C_X}\left( k \right)\cos \alpha \left( k \right) - {C_Z}\left( k \right)\sin \alpha \left( k \right),
\end{equation}$$\\
$$\begin{equation}
{C_D}\left( k \right) = - {C_X}\left( k \right)\cos \alpha \left( k \right) - {C_Z}\left( k \right)\sin \alpha \left( k \right),
\end{equation}$$\\
 $$\begin{equation}
{C_m}\left( k \right) = [{I_y}\dot{q}\left( k \right) + {I_{xz}}\left( {{p^2}\left( k \right) - {r^2}\left( k \right)} \right) - \left( {{I_z} - {I_x}} \right)p\left( k \right)r\left( k \right)]*1/\bar{q}\left( k \right)S\bar{C}\ ,
\end{equation}$$
$$\begin{equation}
{C_m}\left( k \right) = [{I_y}\dot{q}\left( k \right) + {I_{xz}}\left( {{p^2}\left( k \right) - {r^2}\left( k \right)} \right) - \left( {{I_z} - {I_x}} \right)p\left( k \right)r\left( k \right)]*1/\bar{q}\left( k \right)S\bar{C}\ ,
\end{equation}$$
In Equations (8)-(12), it is assumed that thrust line is aligned with the x axis of the body and passing through the centre of gravity of the system. Since the neural mapping uses measured motion variables, the performance and applicability of the proposed method can also be influenced by data quality. Special care must be taken in selecting tuning parameters to avoid overtraining. In particular, the selection of the number of iterations and the number of neurons in the hidden layer play an important role during neural modelling while handling flight data with noise(Reference Kumar and Ghosh16,Reference Saderla22,Reference Saderla, R and Ghosh23) . Once the neural model is ready for prediction of motion variables, it is used to compute system output (Y) corresponding to assumed aerodynamic model (Θ) and measured initial conditions. Next, the difference between the measured response Z and system output Y is computed to estimate the noise covariance matrix R. Finally, the error cost function J(Θ) is minimized with respect to Θ by applying a Gauss-Newton optimization algorithm. The detailed description of the NGN method is presented in Refs. Reference Ghoreyshi and Cummings14-Reference Kumar and Ghosh16.
4.0 GENERATION OF AERODYNAMIC DATABASE
4.1 Model description
In order to perform the aerodynamic characterization at high angles of attack from flight data, an unmanned cropped delta configuration has been designed, fabricated, instrumented and flight tested in-house at flight laboratory of IITK. As mentioned earlier, the current unmanned configuration has a cropped delta planform geometry with a rectangular cross section (flat plate) as shown in Fig. 2(a). The present flight vehicle is a blended wing configuration with no horizontal tail or separate fuselage. The Cropped Delta Flat Plate configuration (CDFP) is provided with a high-aspect-ratio, all-movable vertical tail. For the current configuration, this vertical stabilizer itself serves the purpose of the rudder. The cross section of the vertical tail is NACA 0012, a symmetric aerofoil.

Figure 2. (a) Schematic planform view of CDFP(Reference Saderla22). (b) Schematic side view of the unmanned CDFP configuration(Reference Saderla22).
The geometric characteristics of the current unmanned configuration are presented in Table 1. The longitudinal and lateral control is achieved with the help of the elevons located at the trailing edge of the designed configuration and is shown in Fig. 2(a). These elevons act as elevators when deployed symmetrically and as ailerons when applied with asymmetric deflections.
Table 1 Geometric and design parameters of the current configuration

4.2 Wind-tunnel testing
As a part of the experimental work, exhaustive full-scale wind-tunnel tests were performed on the current configuration at National Wind Tunnel Testing Facility (NWFT) at IIT-Kanpur.
NWTF is a low-speed closed circuit wind tunnel with a test section of cross-section 3.0 m × 2.25 m. The tunnel is able to produce flow with velocity ranging from 5-80 m/sec at a turbulence level of less than 0.1%(Reference Chandra, Gupta and Sharma27). The pressure inside the tunnel is measured by means of pitot-static probes fixed on the walls of the test section. With the help of these probes, the stagnation pressure and hence the air velocity is measured with an accuracy of 0.05%(Reference Chandra, Gupta and Sharma27). The test section is equipped with a β-mechanism, a simple cantilever structure that rests in between the two coaxial turn tables of the test section, as shown in Fig. 3. The longitudinal aerodynamic data base of the CDFP configuration is generated by varying the angle-of-attack from –5° to 50° with the help of the β-mechanism sweep mode at an angular rate of 0.1° per second. At least three data points are collected between two consecutive angles and are made consistent throughout the tests. During these wind-tunnel tests, a constant velocity of 8 m/s has been maintained, and the corresponding Reynolds number during the tests is 3.45 × 10⁵ (based on wing mean aerodynamic chord). The generated aerodynamic force and moment coefficients are presented in Fig. 4.

Figure 3. Model mounting in side test section of NWTF(Reference Saderla22).

Figure 4. Generated Longitudinal aerodynamic force and moment coefficients of CDFP.
4.3 Flight tests
In order to perform the parameter estimation from the flight data, various motion variables must be recorded during the flight tests. Hence the CDFP configuration has been instrumented to record linear accelerations (ax , ay , az ), angular rates (p, q, r), Euler angles (ϕ, θ, ψ), velocity (V ∞), flow angularity (α, β) and control surface deflections (δ a , δ e , δ r ), during the flight tests. The data acquisition system is equipped with 9 degrees-of-freedom inertial measurement unit (IMU to record ax , ay , az , p, q, r, ϕ, θ, ψ), differential pressure sensor (to measure V ∞), and GPS unit. The acquisition system can simultaneously record five analogue inputs, five digital inputs and six PWM signals. The system is capable of both on-board logging and telemetry to the ground station. The velocity of the flight is obtained with the help of a differential pressure sensor attached to the in-house-fabricated mini pitot and static tubes. A prior calibration of this pressure sensor was performed to convert the obtained voltage signal to the corresponding velocity of flight.
The angle-of-attack and sideslip angles (α, β) were obtained from in-house-manufactured vane-type flow angularity sensors mounted at the tip chord of the unmanned configurations (Fig. 5). The data acquisition system is embedded with a two-quad-core ARM (advanced RISC machines) processors capable of performing onboard logging at 20 Hz and telemetry at 11 Hz. A dedicated Graphical User Interface (GUI) has been developed using the Lab-View platform to perform data logging at the ground station. Figure 5 shows a photograph of the instrumented (ready for flight) CDFP configuration. Flight data for aerodynamic characterization studies of the CDFP configuration is generated by performing various flight test manoeuvers at flight laboratory in IITK. Precise measurement of control surface deflections is one of the vital tasks for parameter estimation from flight experiments. Using UAVs measuring these deflections, which are used as inputs in estimation algorithm, is a challenging task due to the limitation in size and weight of the sensors. For the CDFP configuration, during the wind-tunnel tests these control surface deflections were measured by means of multi-turn potentiometers attached to the ends of the hinge rods(Reference Saderla, Rajaram and Ghosh28). During flight tests, these deflections were measured by tapping the Pulse-Width Modulation (PWM) signal that is feed to the high-torque (9 kg/cm at 4.8V) servos, which are used as actuators for controls surface deflections. A prior calibration of these controls surface deflections for various PWM inputs was made under various static load conditions. It is observed that the calibration plots remained consistent even up to a load of 10 N on each control surface.

Figure 5. Photograph representing instrumented prototype of the CDFP configuration(Reference Saderla22).
Initially, the pilot trimmed the aircraft at a comfortable altitude (usually 50-70 m) from the ground station. From this trim condition, predetermined control inputs were applied in an attempt to excite various modes of flight. These flight tests were performed during the day with moderately calm weather. As such, it is assumed that there is no significant effect of wind on the acquired flight data. Figure 6(a) presents the obtained high angle-of-attack (near-stall) flight data of the CDFP configuration during flight tests. For the sake of comparison, one set of flight data pertaining to longitudinal dynamics in the linear domain (low angle-of-attack) has been considered for parameter estimation. The generated high-angle-of-attack flight data is designated as UFP_STL1 (UFP meaning unmanned flat plate configuration and STL meaning stall data) and the numeric figure at the end refers to data set 1. The longitudinal flight data in linear domain is designated as UFP_LG1 and is presented in Fig. 6(b).

Figure 6. Generated flight data of the CDFP configuration: UFP_STL1, UFP_LG1.
The acquired flight data is susceptible to corruption by systematic errors like scale factors, zero shift biases and time shifts. These errors may introduce data incompatibility; for example, the measured incidence angles may not be in agreement with those reconstructed from the accelerometer and rate gyro measurements. In order to perform aerodynamic characterization of a flight vehicle, more variables are usually measured and recorded during flight tests.
Thus, it is imperative that a data compatibility check is carried out before using the data for aerodynamic modelling and parameter estimation. In other words, the data compatibility check, which is also called Flight Path Reconstruction (FPR), is an integral part of aircraft parameter estimation(Reference Jategaonkar1). The main aim of a data compatibility check is to ensure that the measurements used for subsequent aerodynamic model identification are consistent and error-free as possible. The following set of unknown parameters were considered adequate for reconstructing the longitudinal dynamics of the CDFP configuration for purposes of a data compatibility check(Reference Jategaonkar1). The following vector Θ represents the set of unknown longitudinal biases and scale factors that have to be estimated.
 $$\begin{equation}
{\rm{\Theta }} = {\left[ {{\rm{\Delta }}{a_x}\ {\rm{\Delta }}{a_y}\ {\rm{\Delta }}{a_z}\ {\rm{\Delta }}p\ {\rm{\Delta }}q\ {\rm{\Delta }}r\ {K_\alpha }\ {\rm{\Delta }}\alpha } \right]^T}
\end{equation}$$
$$\begin{equation}
{\rm{\Theta }} = {\left[ {{\rm{\Delta }}{a_x}\ {\rm{\Delta }}{a_y}\ {\rm{\Delta }}{a_z}\ {\rm{\Delta }}p\ {\rm{\Delta }}q\ {\rm{\Delta }}r\ {K_\alpha }\ {\rm{\Delta }}\alpha } \right]^T}
\end{equation}$$
The ML method was used to estimate the compatibility factors from the longitudinal flight data (UFP_STL1 and UFP_LG1) of the CDFP configuration. The estimated compatibility factors obtained during the data compatibility check using the ML method are given in Table 2.
Table 2 Data compatibility check for the CDFP configuration: UFP_STL1, UFP_LG1

() Cramér-Rao bound.
It can be observed from Table 2 that, even for high-angle-of-attack flight data, the biases are almost negligible and the scale factors (K_α) appeared to be close to the expected value (around 1). The lower values of Cramér-Rao bounds for these systematic errors show significant confidence in the estimated compatibility parameters. The scale factor close to unity, negligible biases and very low values of Cramér-Rao bounds establish a higher accuracy level in the acquired flight data of CDFP configuration. The measured and computed response of motion variables obtained during the data compatibility check are presented in Figs. 7(a) and 7(b) for UFP_STL1 and UFP_LG1, respectively.

Figure 7. Data compatibility checks of the CDFP configuration: UFP_STL1, UFP_LG1.
5.0 HIGH-ANGLE-OF-ATTACK AERODYNAMIC MODELLING
The ML method was used to estimate the longitudinal aerodynamic and stall characteristic parameters from static wind-tunnel data, whereas the ML and NGN methods were used to perform aerodynamic characterization from high-angle-of-attack (near-stall) flight data (UFP_STL1) of the CDFP configuration. As mentioned earlier, one set of longitudinal flight data pertaining to low angles of attack (UFP_LG1) has been used to estimate the parameters using the linear aerodynamic model. This exercise is performed to compare the parameters estimated from UFP_STL1 flight data. At high angles of attack , the models become highly non-linear and the linear models used for identification using flight data at low angles of attack become unsuitable for accurate estimation. Therefore, Kirchhoff's flow separation theory was used to incorporate the non-linearity in the aerodynamic model in terms of flow separation point and stall characteristic parameters.
5.1 Steady-state stall modelling
Recalling Equations (1) and (4) from Kirchhoff's theory of steady-state flow separation, the lift coefficient and flow separation point can be expressed as follows.
 $$\begin{equation*}
{C_L}\left( {\alpha ,\ {X_0}} \right) = \ {C_{{L_0}}}\ + \ {C_{{L_\alpha }}}{\left\{ {\frac{{1 + \ \sqrt {{X_0}} }}{2}} \right\}^2}\alpha \quad \quad (1)
\end{equation*}$$
$$\begin{equation*}
{C_L}\left( {\alpha ,\ {X_0}} \right) = \ {C_{{L_0}}}\ + \ {C_{{L_\alpha }}}{\left\{ {\frac{{1 + \ \sqrt {{X_0}} }}{2}} \right\}^2}\alpha \quad \quad (1)
\end{equation*}$$
 $$\begin{equation*}
X = \ {X_0} = \ \frac{1}{2}\left\{ {1 - {\rm{tanh}}\left[ {{{\rm{a}}_1}\left( {\alpha - {\alpha ^*}} \right)} \right]} \right\}\quad \quad (4)
\end{equation*}$$
$$\begin{equation*}
X = \ {X_0} = \ \frac{1}{2}\left\{ {1 - {\rm{tanh}}\left[ {{{\rm{a}}_1}\left( {\alpha - {\alpha ^*}} \right)} \right]} \right\}\quad \quad (4)
\end{equation*}$$
Since the above-mentioned equation is a continuous function over the entire range and has only two unknown parameters, a 1 and α*, this can be solved by using parameter estimation methods. The parameter estimation technique will minimize the error between the measured data and the estimated data obtained using initial estimated values. The estimated data of static steady-state flow separation points can be computed from Equation (4) with the initial estimated values of a 1 and α*. Since the flow separation point is not measured during the wind-tunnel tests, the measured flow separation point is computed by rearranging Equation (1) as follows(Reference Jategaonkar1).
 $$\begin{equation}
{X_{{0_{WT}}}} = \ {\left\{ {2^*\ \sqrt {\left( {{C_L} - \ {C_{{L_0}}}} \right)/\left( {{C_{{L_\alpha }}}\alpha } \right)} - \ 1} \right\}^2}
\end{equation}$$
$$\begin{equation}
{X_{{0_{WT}}}} = \ {\left\{ {2^*\ \sqrt {\left( {{C_L} - \ {C_{{L_0}}}} \right)/\left( {{C_{{L_\alpha }}}\alpha } \right)} - \ 1} \right\}^2}
\end{equation}$$
For the rest of this paper, the derived flow separation point from wind-tunnel data (X 0 WT ) is referred as the measured static steady-state flow separation point (X 0measured ). The non-linear aerodynamic modelling of CDFP configuration has been performed by estimating the values of a 1 and α* using the ML method. The maximum likelihood function minimizes the error between the measured flow separation point (X 0measured ) () and estimated flow separation point (X 0Estimated ) by updating the initial estimated values of the unknown parameters. In Fig. 8, it is observed that X 0Estimated has a good match with X 0measured both in linear as well as in the high-angle-of-attack domain. The lower values of the Cramér-Rao bound (Table 3) shows significant confidence in the estimated steady-state stall characteristic parameters.

Figure 8. Variation of static flow separation point and lift coefficient with angle-of-attack: CDFP.
Table 3 Estimated parameters using the ML method of CDFP configuration: UFP_STL1, UFP_LG1

() Cramér-Rao bound.
5.2 Quasi-steady-stall modelling
The nonlinear longitudinal aerodynamic modelling from flight data (near stall) is performed by using the ML and NGN method with Kirchhoff's quasi-steady-stall model. The following equations were used to postulate the aerodynamic model for estimation of longitudinal stall characteristic parameters(Reference Jategaonkar1).
 $$\begin{equation}
{C_L}\left( {\alpha ,X,q,{\delta _e}} \right) = {C_{{L_0}}} + \ {C_{{L_\alpha }}}{\left\{ {\frac{{1 + \ \sqrt X }}{2}} \right\}^2}\alpha + \ {C_{{L_q}}}\frac{{q\bar{c}}}{{2V}}\ + \ {C_{{L_{{\delta _e}}}}}{\delta _e}
\end{equation}$$\\
$$\begin{equation}
{C_L}\left( {\alpha ,X,q,{\delta _e}} \right) = {C_{{L_0}}} + \ {C_{{L_\alpha }}}{\left\{ {\frac{{1 + \ \sqrt X }}{2}} \right\}^2}\alpha + \ {C_{{L_q}}}\frac{{q\bar{c}}}{{2V}}\ + \ {C_{{L_{{\delta _e}}}}}{\delta _e}
\end{equation}$$\\
 $$\begin{equation}
{C_D} = \ {C_{{D_0}}} + \ k\ {C_L}^2\left( {\alpha ,X,q,{\delta _e}} \right) + \ \frac{{\partial {C_D}}}{{\partial X}}\left( {1 - X} \right)\
\end{equation}$$\\
$$\begin{equation}
{C_D} = \ {C_{{D_0}}} + \ k\ {C_L}^2\left( {\alpha ,X,q,{\delta _e}} \right) + \ \frac{{\partial {C_D}}}{{\partial X}}\left( {1 - X} \right)\
\end{equation}$$\\
 $$\begin{equation}
{C_M} = \ {C_{{m_0}}} + \ {C_{{m_\alpha }}}\alpha + \ {C_{{m_q}}}\frac{{q\bar{c}}}{{2V}} + \ {C_{{m_{{\delta _e}}}}}{\delta _e} + \ \frac{{\partial {C_m}}}{{\partial X}}\left( {1 - X} \right)\
\end{equation}$$
$$\begin{equation}
{C_M} = \ {C_{{m_0}}} + \ {C_{{m_\alpha }}}\alpha + \ {C_{{m_q}}}\frac{{q\bar{c}}}{{2V}} + \ {C_{{m_{{\delta _e}}}}}{\delta _e} + \ \frac{{\partial {C_m}}}{{\partial X}}\left( {1 - X} \right)\
\end{equation}$$
The flow separation point in the above three equations is estimated using Equation (3). The three parameters a 1 (aerofoil static stall characteristics), τ2(time constant) and α* (break point) are adequate to model the stall hysteresis(Reference Jategaonkar1). Since it is not possible to measure the aerodynamic force and moment coefficients (CL , CD , Cm ) during the flight tests, these coefficients have been reconstructed from the measured accelerations and flow angles. For the rest of this paper, the reconstructed CL , CD , Cm coefficients from flight data are considered as measured aerodynamic force and moment coefficients. Along with these stall characteristics, the following vector (ΘSTL) represents the parameters that are estimated from the flight data pertaining to high angles of attack (UFP_STL1). The parameters in Equation (16) are estimated using the ML and NGN methods by minimizing the error between measured CL , CD , Cm and the estimated CL , CD , Cm using Equations 15(a)-15(c) with some initial estimated values.
 $$\begin{equation}
{{\rm{\Theta }}_{{\rm{STL}}}} = {\rm{\ }}{\left[ {\begin{array}{*{20}{c}} {\begin{array}{*{20}{c}} {{C_{{L_0}}}}&{{C_{{L_\alpha }}}}&{{C_{{L_q}}}} \end{array}}&{\begin{array}{*{20}{c}} {{C_{{L_{{\delta _e}}}}}}&{{C_{{D_0}}}}&{{C_{{m_0}}}} \end{array}}&{\begin{array}{*{20}{c}} {{C_{{m_\alpha }}}}&{{C_{{m_q}}}}&{\begin{array}{*{20}{c}} {{C_{{m_{{\delta _e}}}}}}&{{a_1}}&{\begin{array}{*{20}{c}} {{{\rm{\alpha }}^{\rm{*}}}}&{{{\rm{\tau }}_2}}&{\begin{array}{*{20}{c}} {{{\rm{C}}_{\rm{D}}}_{\rm{X}}}&{{{\rm{C}}_{{{\rm{m}}_{\rm{X}}}}}} \end{array}} \end{array}} \end{array}} \end{array}} \end{array}} \right]^{\rm{T}}}
\end{equation}$$
$$\begin{equation}
{{\rm{\Theta }}_{{\rm{STL}}}} = {\rm{\ }}{\left[ {\begin{array}{*{20}{c}} {\begin{array}{*{20}{c}} {{C_{{L_0}}}}&{{C_{{L_\alpha }}}}&{{C_{{L_q}}}} \end{array}}&{\begin{array}{*{20}{c}} {{C_{{L_{{\delta _e}}}}}}&{{C_{{D_0}}}}&{{C_{{m_0}}}} \end{array}}&{\begin{array}{*{20}{c}} {{C_{{m_\alpha }}}}&{{C_{{m_q}}}}&{\begin{array}{*{20}{c}} {{C_{{m_{{\delta _e}}}}}}&{{a_1}}&{\begin{array}{*{20}{c}} {{{\rm{\alpha }}^{\rm{*}}}}&{{{\rm{\tau }}_2}}&{\begin{array}{*{20}{c}} {{{\rm{C}}_{\rm{D}}}_{\rm{X}}}&{{{\rm{C}}_{{{\rm{m}}_{\rm{X}}}}}} \end{array}} \end{array}} \end{array}} \end{array}} \end{array}} \right]^{\rm{T}}}
\end{equation}$$
The linear aerodynamic model used to estimate the parameter from the UFP_LG1 flight data is obtained by substituting X = 1 (completely attached) in Equations 15(a)-15(c). The following vector (ΘLG) represents the parameters estimated from UFP_LG1 using the ML and NGN methods.
 $$\begin{equation}
{{\rm{\Theta }}_{{\rm{LG}}}} = {\rm{\ }}{\left[ {\begin{array}{*{20}{c}} {\begin{array}{*{20}{c}} {{C_{{L_0}}}}&{{C_{{L_\alpha }}}}&{{C_{{L_q}}}} \end{array}}&{\begin{array}{*{20}{c}} {{C_{{L_{{\delta _e}}}}}}&{{C_{{D_0}}}}&{{C_{{m_0}}}} \end{array}}&{\begin{array}{*{20}{c}} {{C_{{m_\alpha }}}}&{{C_{{m_q}}}}&{{{\rm{C}}_{{{\rm{m}}_{{{\rm{\delta }}_{\rm{e}}}}}}}} \end{array}} \end{array}} \right]^{\rm{T}}}
\end{equation}$$
$$\begin{equation}
{{\rm{\Theta }}_{{\rm{LG}}}} = {\rm{\ }}{\left[ {\begin{array}{*{20}{c}} {\begin{array}{*{20}{c}} {{C_{{L_0}}}}&{{C_{{L_\alpha }}}}&{{C_{{L_q}}}} \end{array}}&{\begin{array}{*{20}{c}} {{C_{{L_{{\delta _e}}}}}}&{{C_{{D_0}}}}&{{C_{{m_0}}}} \end{array}}&{\begin{array}{*{20}{c}} {{C_{{m_\alpha }}}}&{{C_{{m_q}}}}&{{{\rm{C}}_{{{\rm{m}}_{{{\rm{\delta }}_{\rm{e}}}}}}}} \end{array}} \end{array}} \right]^{\rm{T}}}
\end{equation}$$
Parameter vectors presented in Equations (16) and (17) have been estimated by ML and NGN methods using Kirchhoff's quasi-steady-state stall model and linear aerodynamic model from the flight data UFP_STL1 and UFP_LG1, respectively. Figure 9 presents the comparison of the measured and estimated response of state variables of CDFP configuration from UFP_STL1 using the ML and NGN methods.

Figure 9. Parameter estimation of CDFP configuration: UFP_STL1.
In Fig. 9, it is observed that the manoeuver lasts for about 3 s. During this high angle-of-attack manoeuver the elevator deflection has been varied smoothly from –10° to –17° over 1.25 s and then decreased to –10°. During this excitation, the unmanned vehicle has reached a maximum angle-of-attack close to 22°. It can be inferred from Fig. 9 that the estimated response of the state variables using the ML and NGN methods closely match the measured data. The match for the lift coefficient estimated from the ML method with the measured data shows some discrepancies compared to the NGN method in the regime close to the maximum angles of attack.
Since the lift coefficient is modelled as a function of instantaneous flow separation point (X), the sharp variation of X might have resulted in the overshoot of CL during the ML estimation, whereas in the case of NGN, the variation of X is smooth, which may be due to the pattern-following ability of the trained neural network using point-to-point mapping of all the flight data. Figure 10 presents the variation of measured and estimated CL with α during the high angle-of-attack manoeuver using the ML and NGN methods.

Figure 10. Measured and estimated CL of CDFP configuration: UFP_STL1.
The competence of Kirchhoff's flow separation model is evident from the hysteresis in the estimated lift coefficient, as presented in Fig. 10. It is also noticed that both the ML and NGN methods were able to reproduce the hysteresis quite satisfactorily using Kirchhoff's quasi-steady-stall model. Figure 11 presents the measured and estimated responses of motion variables of the CDFP configuration in a relatively low angle-of-attack regime using the ML and NGN methods.

Figure 11. Parameter estimation of the CDFP configuration: UFP_LG1.
In Fig. 11, it is evident that the estimated longitudinal state variables match the measured data using the ML and NGN methods. The estimated parameters are presented in Table 3, and for the sake of completeness, the parameters obtained from wind-tunnel testing are also presented(Reference Saderla22). It is noticed that most of the estimated derivatives using the ML and NGN methods (in both the cases (UFP_STL1 and UFP_LG1) are reasonably accurate with lower values of Cramér-Rao bound and are also comparable to the wind-tunnel-derived values.
The estimated aerodynamic parameters, from quasi steady stall model (from UFP_STL1) such as C Do , C L α and C m α are consistent and in an acceptable agreement with the obtained values from the linear aerodynamic model (UFP_LG1). The parameters such as C L 0 and C mo of the CDFP configuration are slightly different from the wind-tunnel values and their estimated values are almost negligible. It can also be observed that the aerodynamic parameters C L δe and C m δ e slightly departed from the expected values. This can be due to the reason that the minimum excitations of the elevator during these stall manoeuvers. The lower values of the estimates C Lq and C mq for a conventional two seater trainer aircraft the typical order of these dynamic derivatives are about 3 and –9, respectively, and may due to the absence of a dedicated horizontal tail. To further enhance the confidence in these derivatives, more data sets must be verified.
6.0 CONCLUSIONS
The current research work addresses the non-linear aerodynamic modelling at high angles of attack (near stall) of the designed unmanned cropped delta flat plate configuration. Flight tests pertaining to various manoeuvers have been performed on the instrumented CDFP configuration in the in-house at flight laboratory of IITK. The results obtained from the compatibility check (biases close to zero and scale factors close to unity) of UFP_STL1 and UFP_LG1 show significant confidence in the generated flight data. Kirchhoff's steady-stall model is able to capture the non-linear variation of the lift coefficient (CL ) at high angles of attack generated from wind-tunnel testing of CDFP configuration. The lower values of Cramér-Rao bound of the estimated stall characteristic parameters (a 1 and α* from wind-tunnel data) using the ML method shows significant confidence in the estimates. The estimated stall characteristic parameters from flight data using both ML and NGN methods are quite satisfactory. Further, the estimated hysteresis using ML and NGN methods closely match the measured data. As expected, the estimated values of the damping derivative (Cmq ) turn out to be very low from both linear and high-angle-of-attack flight data. This is likely due to the absence of a dedicated horizontal tail, resulting in a shorter distance between the centre of gravity and neutral point compared to conventional aircraft configurations. The NGN method, which doesn't involve solving equations of motion, was able to perform on a par with the classical ML method. However, the consistency of the NGN method has to be verified with a higher number of high-angle-of-attack flight data sets.
ACKNOWLEDGEMENTS
The authors would like to thank the government of India for allowing us to perform flight tests at the Flight Laboratory of Indian Institute of Technology Kanpur (IITK). I would also like to extend my sincere thanks to BK21 Plus programme (Brain Korea 21 Program for Leading Universities & Students) for funding my post-doctoral fellowship.


