1. Introduction
With the global warming, the development and utilisation of the Arctic Northeast Passage has received increasing attention, but sea ice remains a major challenge to navigation in these waters. Comparing with traditional commercial routes, the Northeast Passage can save 15%–50% of the voyage distance (He et al., Reference He, Ping and Zhang2013), and its important economic and strategic value is valued by relevant countries and enterprises. However, dynamic sea ice conditions have always influenced the navigability of the Northeast Passage and the safety of ships. For example, in 2016, when the ship Tianxi and ship Xianghekou owned by the China Ocean Shipping Group Company (COSCO) passed through the Sannikov Strait in the Northeast Passage, they were trapped at the inner side of the strait in the route recommended by the Russian administration.
Therefore, it is vital to acquire the knowledge of the navigation risk posed by sea ice when operating in Arctic waters.
Regarding the navigation risk of the Arctic passages, the dynamic changes of sea ice and its influence on navigation have always been a focus for those who travel these waters. Arctic sea ice extent had shown a significant decrease in the past 40 years, with the fastest decrease occurring in the month of September (Xue et al., Reference Xue, Guan, Dong and Chen2014). The average sea ice thickness near the end of the melt season in six regions decreased by 2⋅0 m or some 66% over six decades (Kwok, Reference Kwok2018). The estimated inversion of sea ice thickness and volume better reflected the dynamic changes of Arctic sea ice (Laxon et al., Reference Laxon, Giles, Ridout, Wingham, Willatt, Cullen, Kwok, Schweiger, Zhang, Hass, Hendricks, Krishfield, Kurtz, Farrell and Davidson2013). From the perspective of kinematics, the average speed of Arctic sea ice had increased significantly in the past 40 years, and the increase in average speed of sea ice in winter was obviously stronger than in summer (Zuo et al., Reference Zuo, Gao, Cheng and Xu2016). Recently, the trend in the Arctic Oscillation (AO) toward the high-index polarity observed over the Arctic waters resulted in the thinning of sea ice (Rigor et al., Reference Rigor, Wallace and Colony2002). Regarding the influence of sea ice on navigation, Ma et al. (Reference Ma, Wang, Liu and Li2018a;Reference Ma, Li, Chen and Lib) used sea ice concentration data to obtain the navigable windows of the Northeast Passage in mid-to-late July to mid-to-late October, using the data to detail the influence of sea ice on navigability. The shortest navigable period of the Northwest Passage was 69 days, and the critical legs affecting the navigation were determined (Liu et al., Reference Liu, Ma, Wang, Wang and Wang2017). Ma et al. (Reference Ma, Liu, Li and Wang2018c), Meng et al. (Reference Meng, Li, Tian and Zhang2013) and Zhang et al. (Reference Zhang, Huang, Cao, Wang, Sun and Yang2019) utilised sea ice data to reveal the critical waters of the Arctic passages which severely affect and limit the navigability of the Arctic waters.
Scholars mainly used environmental elements to evaluate the navigation risk of the Arctic passages. The fuzzy analytic hierarchy process (AHP) model was used to discern key factors influencing the building of Arctic shipping routes (Shyu and Ding, Reference Shyu and Ding2016). The potential risk influencing factors (RIFs) were identified from human, technical (ship), environmental and organisational aspects for the Arctic Maritime Transportation System (AMTS) (Fu et al., Reference Fu, Yan, Zhang and Zhang2018). Among these factors, sea ice density, wind, visibility and temperature were important environmental risk factors (Fu et al., Reference Fu, Zhang, Zhang and Yan2017). Sahin and Kum (Reference Sahin and Kum2015) and Liu et al. (Reference Liu, Li and Chen2018) also identified and analysed the navigation risk factors and corresponding numerical weights of the Arctic passages using the fuzzy AHP. Wang et al. (Reference Wang, Li, Wu and Sun2019) evaluated the navigation safety of the Arctic passages by integrating environmental factors, such as natural elements, human factors and navigational aids. In addition, some scholars modelled the navigation risk of the Arctic passages. Hu et al. (Reference Hu, Xuan, Liu, Fu and Xi2019) conducted dynamic risk simulation on ships sailing in the Northeast Passage during the summer season, and determined that navigation risk in the Northeast Passage was as low, and the area was reasonably navigable. The risk level continuously changed with time, showing an overall M-type curve trend. Kum and Sahin (Reference Kum and Sahin2015) analysed the causes of ship accidents in the Arctic waters and constructed a fault tree model for ship collision and grounding accidents. Khan et al. (Reference Khan, Khan, Veitch and Yang2018), Baksh et al. (Reference Baksh, Abbassi, Garaniya and Khan2018) and Afenyo et al. (Reference Afenyo, Khan, Veitch and Yang2017) used a Bayesian network to predict the probability of collisions between ice and ships in the Arctic waters, and assessed the navigation risk.
Past studies showed that a basic understanding of sea ice conditions in the Arctic waters had been established, and it is of great practical value to study the navigation risk faced by ships in the Arctic waters from the perspective of a navigable window. The routes taken by ships in the Arctic waters experienced different hydrometeorological environments, and the different legs along the route could pose different navigation risks on ships of a specific ice class. However, there has been little relevant research conducted to quantify such navigation risk and give ship manoeuvring recommendations under different navigation risks along the route.
Based on the Polar Operational Limit Assessment Risk Indexing System (POLARIS) introduced by the International Maritime Organisation (IMO), this study quantitatively analysed the navigation risk of the route taken by the ship Yongsheng in its maiden voyage of the Arctic Northeast Passage using the sea ice condition data from 2011 to 2020. Two ship-operating situations were considered: independent sailing and icebreaker escort. In addition, the navigation risk of the route for ice class 1A ships was further examined by the navigable windows of the route and the critical waters affecting the safety of ships. In the end, the recommendations on ship's navigation and manipulation along this route and recommendations for stakeholders are provided.
2. Study area and data
2.1 Study area
The route taken by the Yongsheng in its maiden voyage of the Arctic Northeast Passage in 2013 extended from the Bering Strait in the east to the Nordkapp in the west. This route is also the common commercial route for ships in the Northeast Passage (i.e. the ‘customary route’). Considering that the sea ice conditions in the Barents Sea and the Chukchi Sea are lighter, and the navigable periods are much longer compared with other legs along the route, the route from the De Lang Strait in the east to the Novaya Zemlya in the west (Figure 1) were selected to quantitatively analyse its navigation risk. This part extends from 176°E in the east to 75°E in the west, passing through the East Siberian Sea, the Laptev Sea, the Vilkitsky Strait, and the Kara Sea.

Figure 1. Study part (black solid line)
2.2 Data
The data used in this study included sea ice condition data and route data, which were vector format. The sea ice condition data were provided by the U.S. National Ice Center (NIC) covering the period from 2011 to 2020. During 2011 to 2013, the sea ice condition data were provided every 14 days, and every seven days during 2014 to 2020, totalling 442 files for the 10 years. The sea ice condition data were organised using SIGRID-3 format, and the coordinate system was WGS_1984_Stereographic_North_Pole. The sea ice condition data provided the total sea ice concentrations of the statistical unit (i.e. Field CT in Figure 2), and the concentration information of the thickest, second and third thickness sea ice (i.e. Fields CA, CB and CC in Figure 2) in the same unit, and the corresponding sea ice development stage information (i.e. Fields SA, SB and SC in Figure 2). The route data was drawn based on the location log from the Yongsheng, and its coordinate system was North_Pole_Lambert_Azimuthal_Equal_Area.

Figure 2. The fields of sea ice condition data (the first week of 2016)
3. Method and technology roadmap
3.1 Method
POLARIS has been developed by IMO to calculate the RIO in combination with the ship's ice class and the sea ice conditions, which combined represent the navigation risk faced by ships on the specific route. POLARIS also provides limitations and recommendations for ships operating in the Arctic waters based on the calculated RIO.
3.1.1 Calculation of RIO
For ship operating independently, the RIO was calculated using

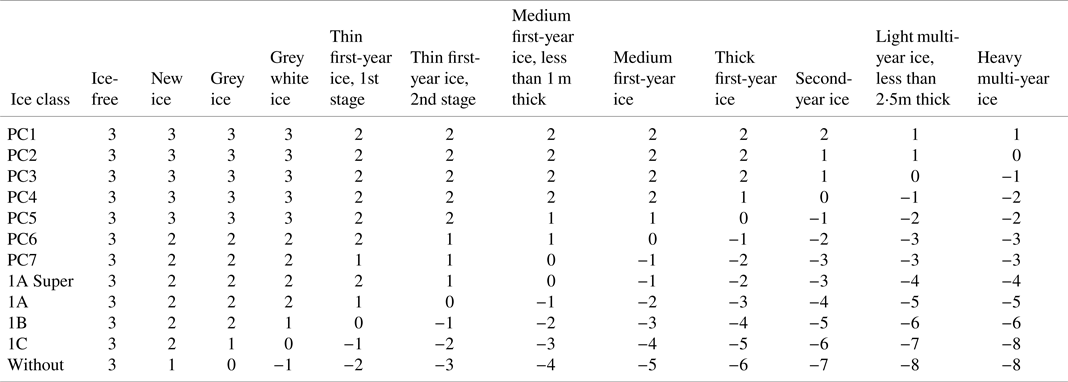
where C1 … Cn were the sea ice concentrations (in tenths) of each sea ice development stage in one statistical unit, and RIV1 … RIVn were the corresponding risk index values for each sea ice development stage. The higher value of the RIO meant the ship faced lighter sea ice conditions and less navigation risk.
Ships navigating in waters with different sea ice development stages (the first row in Table 1) have been assigned risk index values (RIVs) according to their ice class (the first column in Table 1).
Table 1. Risk index values

3.1.2 Limitations and recommendations for ship operating in Arctic waters
According to the RIO for ships operating independently in Arctic waters, POLARIS had identified three levels of operation and put forward operational limitations and recommendations. For a ship with a specific ice class, the corresponding level of operation can be determined according to the RIO value of its statistical unit, as listed in Table 2.
Table 2. Risk index outcome criteria

1 Elevated operational risk*: This is common for ships with a specific ice class navigating in ice regimes where thin or medium first-year ice is predominant. Ships should perform elevated-risk operations. The speed of the ship should be limited to the values indicated in Table 3. The recommended speed limit can be calibrated according to the actual manoeuvrability of the ship. Operational measures also include the provision of additional watch-keeping or icebreaker escort. When the speed reduction may impair the ship manoeuvrability, the operation should be avoided.
2 Operation subject to special consideration**: This is common when ships with specific ice class or ships not assigned an ice class are navigating in ice regimes where thick first-year ice or multi-year ice is predominant. Ships should perform operations subject to special consideration. Ships should operation under icebreaker escort. The master and officers in charge of a navigational watch should operate with extreme caution. For voyage planning purposes, ships should avoid ice regimes where the RIO identifies operations subject to special consideration.
Table 3. Recommended speed limits for elevated risk operations

Note that these limitations and recommendations assume that mariner are sufficiently cautious, and such factors as changes in weather and visibility are considered.
3.2 Technology roadmap
Figure 3 shows the technical route we designed with reference to the navigation risk quantification model in POLARIS.
1) Data used included the sea ice condition data and the route data taken by the Yongsheng in its maiden voyage of the Arctic Northeast Passage in 2013 in vector format (hereafter, the route vector), through which navigation risk faced by the Yongsheng was evaluated.
2) Data preprocessing mainly contained two steps: projection transformation to unify coordinate systems and data rasterisation. The coordinate system adopted North_Pole_Lambert_Azimuthal_Equal_ Area. The sea ice concentration information and sea ice development stage information were rasterised. The pixel size of the raster was set as 1 km * 1 km.
3) Quantification of navigation risk of the Northeast Passage: by overlaying the route vector and the RIO of the Arctic waters, the RIO of the route was obtained and was converted into raster format. Using the RIO of the route results from 2011 to 2020, the statistical values of RIO values for 10 * 52 weeks, that is the maximum, minimum and average value for each week during these 10 years, were calculated.
4) Based on the statistical values of RIO of the route, the navigation risk of the Northeast Passage was quantitatively analysed. The navigable windows of the route under different sea ice conditions were determined and the critical waters affecting the safety of ships were identified. The relevant recommendations on ship's navigation and manipulation were given based on POLARIS.

Figure 3. Technology roadmap
4. Navigation risk of the Northeast Passage
4.1 The RIO of the Northeast Passage
In this study, two ship-operating situations were considered: independent sailing and icebreaker escort. The RIO of the Arctic waters and the RIO of the route from 2011 to 2020 was calculated and analysed combined with the ice class of the Yongsheng.
4.1.1 The RIO of the route for ships sailing independently
Combined with the ice class of the Yongsheng (ice class 1A), the RIO of the Arctic waters was calculated using the sea ice condition data. The RIO of the route for ships sailing independently was obtained by overlaying the route vector and the RIO of the Arctic waters. The different statistical values of the RIO of the route for 10 * 52 weeks were then calculated.
4.1.1.1 The RIO of the Arctic waters
In this study, the sea ice concentration information and corresponding sea ice development-stage information were extracted from the sea ice condition data and rasterised. According to the RIVs of different sea ice development stages in Table 1, the rasterised RIO of the Arctic waters was calculated by Equation (1).
Figure 4 shows the rasterised RIO of the Arctic waters during week 30 and week 40 of 2015 and 2016. It could be seen that the RIO of the Arctic waters had changed significantly between different weeks and different years, and the navigation risks faced by the ships with specific ice class were also different. For more intuitive visualisation, the rasterised RIO attribute values were reclassified into 4 categories:
1) RIO ≥ 0, corresponding to normal operations;
2) −10 ≤ RIO < 0, corresponding to elevated risk operations;
3) RIO ≤ −10, corresponding to operations subject to special consideration, among which, when −20 ≤ RIO ≤ −10, the ship need elevated risk operations under icebreaker escort, and when RIO ≤ −20, the navigation risk under icebreaker escort conditions was still high, and it was not recommended to sail.

Figure 4. The rasterised RIO of the Arctic waters after reclassification (Week 30 and Week 40 of 2015 and 2016)
4.1.1.2 The statistical values of RIO of the route
The RIO of the route was obtained by overlaying the route vector and the RIO of the Arctic waters. The RIO of the route were rasterised to calculate the statistical values of RIO of the route for 10 * 52 weeks.
The week was used as the basic time unit to calculate the statistical values of the RIO of the route for 10 * 52 weeks, that is the weekly maximum RIO, minimum RIO and average RIO of the route for 52 weeks, which respectively corresponded to three sea ice conditions (light sea ice conditions, severe sea ice conditions and normal sea ice conditions). Under different sea ice conditions, the percentage of the route corresponding to each operation level was calculated based on data in Table 2.
Figure 5 shows the percentage of the route (vertical axis) with different operation level per week (horizontal axis) under different sea ice conditions (light sea ice conditions, severe sea ice conditions and normal sea ice conditions). Note that with different sea ice conditions each week, legs with different navigation risk had different proportions along the route and required ships to perform different level operations according to Table 2.

Figure 5. The percentage of the route corresponding to different operation levels for ships sailing independently
For ice class 1A ships sailing independently, ships could operate normally during week 1 and from week 29 to week 52 under light sea ice conditions. Under severe sea ice conditions, only week 40, the route was closed to navigation, however 33% of the route required elevated risk operations. Under normal sea ice conditions, the route could be sailed normally from week 33 to week 45, and about 10% of the route encountered elevated risk operations during week 32 and week 46.
4.1.2 The RIO of the route for ships under icebreaker escort
According to POLARIS recommendations, the RIO values for ships under icebreaker escort were obtained by summing the RIO values for ships sailing independently and one constant (i.e. 10, provided by POLARIS). The RIO of the route under icebreaker escort was obtained by overlaying the route vector and the RIO of the Arctic waters. The RIO of the route were rasterised. Using the week as the basic time unit, the statistical values of the RIO of the route under icebreaker escort for 10 * 52 weeks were calculated, which was similar to Section 4.1.1. Under different sea ice conditions, the percentage of the route corresponding to each operation level was calculated based on data in Table 2.
Figure 6 shows the percentage of the route with different operation level per week for ships under icebreaker escort under different sea ice conditions. Compared with Figure 5, note that for ice class 1A ships under icebreaker escort, the route could be sailed normally from week 1 to week 10 and from week 28 to week 52 under light sea ice conditions. Under severe sea ice conditions, the route could be only sailed normally during week 40, and about 15% of the route required elevated risk operations from week 39 to week 42. Under normal sea ice conditions, the route could be sailed normally from week 32 to week 48, and about 10% of the route required elevated risk operations during week 31 and week 49.

Figure 6. The percentage of the route corresponding to different operation levels for ships under icebreaker escort
4.2 Navigation risk in the Northeast Passage
The navigation risk of the Northeast Passage was quantitatively analysed using the statistical values of RIO of the route for ships sailing independently. Based on the statistical values of weekly maximum RIO (light sea ice conditions), weekly minimum RIO (severe sea ice conditions) and weekly average RIO (normal sea ice conditions), respectively, the corresponding navigable windows and critical waters of the route were identified to further examine and recognise the navigation risk of the route.
4.2.1 Navigable windows of the Northeast Passage
The navigable window of the route is the start date of ship sailing, end date of ship sailing and the navigable period while the sea ice conditions do not affect the safety of ships in the waters of the route (Ma et al., Reference Ma, Wang, Liu and Li2018a). When the RIO of all pixels along the route was ≥0, ships could operate normally, that is the route was navigable.
The sea ice condition data only provided sea ice concentration information and development-stage information of the first three thicknesses of ice, which could cause errors when determining the navigable window. Therefore, for a ship sailing independently, if the number of pixels with RIO < 0 occupied less than 5% of all the pixels of the route, the route could be considered navigable. Taking 95% of pixels with RIO ≥ 0 as the threshold value, the navigable windows of the Northeast Passage for an ice class 1A ship sailing independently were extracted. Under three scenarios of sea ice conditions, the statistical values of RIO from 2011 to 2020 were used to determine navigable windows of the route, respectively. Figures 7–9 show the navigable windows for these three scenarios.

Figure 7. The navigable window of the Northeast Passage under light sea ice conditions for ice class 1A ships

Figure 8. The navigable window of the Northeast Passage under severe sea ice conditions for ice class 1A ships

Figure 9. The navigable window of the Northeast Passage under normal sea ice conditions for ice class 1A ships
Figure 7 shows the navigable window under light sea ice conditions obtained from the weekly maximum RIO value of the route from 2011 to 2020. Note that under light sea ice conditions, the start week of ship sailing was week 29 (07⋅16–07⋅22), and the end week of ship sailing was week 1 of the following year (01⋅01–01⋅07), with a navigable period of approximately 175 days.
Figure 8 shows the navigable window under severe sea ice conditions obtained from the weekly minimum RIO value of the route from 2011 to 2020. Note that under severe sea ice conditions, ice class 1A ships were not navigable on this route throughout the year. Only during week 40 (10⋅01–10⋅07) was the navigation risk relatively less, and 33% of the route could be sailed with elevated-risk operations.
Figure 9 shows the navigable window under normal sea ice conditions obtained from the weekly average RIO value of the route from 2011 to 2020. Note that under normal sea ice conditions, the start week of ship sailing was week 33 (08⋅13–08⋅19), and the end week of ship sailing was week 45 (11⋅05–11⋅11). The average navigable period was about 91 days.
4.2.2 Critical waters of the Northeast Passage
The critical waters of the route are those with complex sea ice conditions that have a significant impact on the safety of ships (Ma et al., Reference Ma, Liu, Li and Wang2018c). The identification of critical waters was based on the changes of the waters’ navigable windows under different sea ice conditions, which referred to the light sea ice conditions and the normal sea ice conditions because ice class 1A ships were not navigable on this route throughout the year under severe sea ice conditions.
Using weekly maximum RIO and average RIO statistical values, the weeks when the route could be navigable under light sea ice conditions but not under normal sea ice conditions (later referred to as ‘navigation change weeks’) were determined, that is week 1, weeks 29–32 and weeks 46–52. Under normal sea ice conditions, the legs of the route whose RIO of the pixels is <0 in navigation change weeks were analysed. The critical waters of the route that have short navigable windows, complex ice conditions were identified.
The identified critical waters along the route were: the waters from the northeastern part of the New Siberian Islands to the central part of the East Siberian Sea (weeks 30–32, weeks 46–47 and weeks 49–51), the northern waters of the Laptev Sea (week 47 and week 50), and the waters from the Vilkitsky Strait to the Sergei Kirov Islands (weeks 30–32, week 47 and week 51), as shown in Figure 10. The geographic information of the critical waters and navigable windows under different sea ice conditions are listed in Table 4.

Figure 10. Critical waters of the route (critical waters indicated by thick solid-line legs)
Table 4. Critical waters of the Northeast Passage

Table 4 provides the navigable windows of critical waters under different sea ice conditions. Among them, the navigable conditions in the northern waters of the Laptev Sea were the best, extending from (76⋅99°N, 130⋅41°E) to (77⋅50°N, 115⋅88°E). The navigable conditions in the waters from the Vilkitsky Strait to the Sergei Kirov Islands were in the middle of three critical waters, extending from (77⋅85°N, 107⋅18°E) to (77⋅49°N, 90⋅70°E). The waters with the more variable navigable conditions were concentrated on the western side of the Vilkitsky Strait. The worst navigable conditions were in the waters from the northeastern part of the New Siberian Islands to the central part of the East Siberian Sea, extending from (71⋅53°N, 165⋅55°E) to (75⋅30°N, 153⋅09°E). The sea ice conditions in the central and western parts of the Arctic waters were more complicated and severe. The trend of the navigable windows was more consistent with the entire route navigable windows, so the waters had the greatest impact on the navigable windows of the route.
4.3 Recommendations on ship's navigation and manipulation in the Northeast Passage
Combined with the navigable windows and critical waters of the Northeast Passage under different sea ice conditions from 2011 to 2020 for ice class 1A ships sailing independently, the corresponding recommendations on ship's navigation and manipulation were provided. The recommendations were based on the RIO criteria and three levels of operational restrictions and recommendations given by POLARIS to ensure the safety of ships in the Northeast Passage.
4.3.1 Operation recommendations for different operation levels of ice class 1A ships
When ice class 1A ships sail along legs requiring elevated-risk operations, the speed should be limited to less than 3 knots without affecting the manoeuvrability of the ships. Other measures include the provision of additional watch-keeping or the use of icebreaker escort. At the same time, contingency plans should be in place and documented in the Polar Waters Operation Manual (PWOM), and normal operations should be performed under the assistance of icebreaker.
When sailing on legs requiring operations subject to special consideration, ice class 1A ships need to use icebreaker escort. The ship master and officers in charge of a navigational watch should operate with extreme caution. Course alteration/rerouting, further reduction in speed and other special measures should be exercised. At the same time, procedures for reducing ship risk should be contained in the PWOM and implemented.
For legs where −20 ≤ RIO ≤ −10, ships could perform elevated-risk operations under icebreaker escort; legs where RIO ≤ -20 should be avoided for voyage planning purposes. Considering the safety of ships, it was not recommended by POLARIS that ships navigate in these legs.
4.3.2 Operation recommendations of different navigation risk legs under different sea ice conditions
The route in this study was divided into 12 legs according to the geographical location and sea ice conditions, indicated by the letters A–L (Table 5 and Figure 11).

Figure 11. Legs’ geographical location along the route
Table 5. Legs’ division of the route

Under normal sea ice conditions, for the navigable weeks and some navigation change weeks, the percentage and geographical locations of different navigation risk legs, and recommendations on ships’ navigation and manipulation were shown in Table 6 (legs not listed could be operated normally). Under icebreaker escort, the route also had better navigability for ice class 1A ships during weeks 31–32 and week 46.
Table 6. Different navigation risk legs and recommendations for the navigable weeks and navigation change weeks

Under light sea ice conditions, ice class 1A ships could operate normally from week 29 to week 1 of the following year. The route had the navigable possibility during week 27, week 28 and weeks 2–4 of the following year with icebreaker escort. In about 30% of the route, elevated-risk operations should be performed during these week, in the critical waters of the route, that is in legs B–D, G, H–J, and ships could operate normally under icebreaker escort. In addition, in about 10% of the route, operations subject to special consideration should be performed during week 27 and week 28, in legs C, D, I and J. Under icebreaker escort, in 8% of the route operations were still not permitted in legs C and D during week 27. Legs I and J could accept elevated-risk operations under icebreaker escort.
Under severe sea ice conditions, 33% of the route require elevated-risk operations during week 40, in legs C, D, I and J. Ships could operate normally under icebreaker escort. During week 39, in 17% of the route elevated-risk operations should be performed in leg C, and 21% of the route required operations subject to special consideration in legs D, I and J. Under icebreaker escort, 8% of the route in leg D still did not permit ship operation. During week 41 and week 42, 21% and 12% of the route required operations subject to special consideration, in legs C, D, I and J. Among them, legs where operations were not permitted accounted for 4⋅7% and 1⋅6%, concentrated in legs D and J, respectively.
4.3.3 Recommendations for stakeholders of ships sailing on the Northeast Passage
Combining the navigable windows under different sea ice conditions and critical waters obtained by quantifying the navigation risk of the Northeast Passage, the corresponding recommendations for the stakeholders of ships sailing on the Northeast Passage were given.
First of all, for flag states and shipping companies, before formulating ship sailing plans, this model could be used to quantitatively analyse the navigation risk of the Northeast Passage based on near real-time ice data combined with ship ice class, and to determine ice conditions to extract the route navigable windows used as a reference to arrange the voyage reasonably. For legs with navigational risk that require elevated-risk operations or operations subject to special consideration, ice navigation strategies should be formulated in advance in accordance with the ice navigation guidelines. For elevated-risk operation legs, it was recommended to use icebreakers to escort, and for legs where operations subject to special consideration, there must be an icebreaker escort. Pay attention to avoid the waters with RIO ≤ −20 during navigation planning.
For port states and coastal states, the icebreaker icebreaking and escort plan should be formulated in advance in accordance with the needs of commercial ships to use icebreakers, especially in the three critical waters where the ice conditions of the Northeast Passage were complex and the navigation risk was severe. The 12 legs divided in the study had different geographic locations and sea ice conditions could be the reference of dividing several legs according to the water area. The sea ice conditions and the navigation risk of each leg should be judged through near real-time data, and the corresponding search and rescue plans for each leg should be formulated in advance.
5. Discussion
5.1 Navigable windows of the Northeast Passage
Based on the POLARIS introduced by IMO, the navigable windows of the Northeast Passage under different sea ice conditions for ice class 1A ships were determined using the sea ice condition data of the Northeast Passage from 2011 to 2020. Under normal sea ice conditions, the navigable window of the route was from week 33 (08⋅13–08⋅19) to week 45 (11⋅05–11⋅11), and was about 91 days. Compared with the results obtained by Ma et al. (Reference Ma, Wang, Liu and Li2018a), the average navigable period of the Northeast Passage under normal sea ice conditions in this study was basically the same. It should be noted that the average start date and the end date obtained by Ma et al. (Reference Ma, Wang, Liu and Li2018a) were earlier than those under normal sea ice conditions in this study. The main reason was not only the sea ice concentration information, but also sea ice development-stage information considered to calculate the RIO value for each pixel on the route in this study. The route was considered navigable when more than 95% of the pixels’ RIO values were ≥ 0. Compared with previous studies, the changes in the navigable windows under different sea ice conditions were considered, which provided a more comprehensive understanding of the navigable windows of the Northeast Passage.
Part of the research on the navigability of the Northeast Passage used a graphical path search algorithm to obtain the optimal route considering ice conditions (Lee et al., Reference Lee, Roh and Kim2021). At the same time, factors such as ship fuel consumption, sailing time and power were also considered to obtain the optimal sailing route for the corresponding waters. In contrast, the navigable windows of the Northeast Passage were analysed based on the common commercial route (i.e. the ‘customary route’) in this study. This route was the most commonly used route for merchant ships sailing in the Northeast Passage. Compared with other waters, the sea ice conditions and navigability were better. The navigability of the Northeast Passage under different sea ice conditions in the past 10 years in combination with the ships’ ice class was the main focus in this study, as were the navigation risk of the Northeast Passage and recommendations on ships’ navigation and manipulation for different legs. For the needs of relevant countries and enterprises to rationally arrange shipment dates and sailing plans based on different ice classes of ships, the results of this study are more practical and provide navigation risk visualisation, navigable windows and operation recommendations for different legs of known commercial routes.
5.2 Critical waters
Three critical waters of the Northeast Passage were identified, and the navigation conditions of different waters were analysed. In order of the best to the worst navigation conditions, they were the northern waters of the Laptev Sea, the waters from the Vilkitsky Strait to the Sergei Kirov Islands, and the waters from the northeastern part of the New Siberian Islands to the central part of the Eastern Siberian Sea. The critical waters of the Northeast Passage had been verified by Ma et al. (Reference Ma, Liu, Li and Wang2018c) and Meng et al. (Reference Meng, Li, Tian and Zhang2013).
Among the critical waters, the northern waters of the Laptev sea (in leg G) are shallow in the south and deep in the north, the Lena River in the south has a large runoff (Li et al., Reference Li, Zhao and Zhu2009), causing an earlier melting time in the south. The waters are in the end of the Arctic Transpolar Current and have complex sea ice circulation in summer (from July to September), the sea ice extent changes off-seasonally (Krumpen, Reference Krumpen2013) and the sea ice condition have no obvious correlation with overall the Arctic sea ice conditions (Plotnikov and Pustoshnova, Reference Plotnikov and Pustoshnova2012). From the east side of the Vilkitsky Strait to 76°N (in leg H), there is a Taymyr ice pack area (China Maritime Safety Administration, 2014). From November to May of the following year, the largest coastal ice area in the Arctic will form and impact the navigability of the Northeast Passage. The waters from the Vilkitsky Strait to the Sergei Kirov Islands (in legs I and J) are severely affected by wind and sea ice drift on the west side of the Severnaya Zemlya Islands (Johannessen et al., Reference Johannessen, Sandven, Pettersson, Lundhaug, Dalen and Alexandrov2001). Here, the sea ice conditions are more concentrated and complicated. The navigable period on the north side of the New Siberian Islands (in leg E) is relatively long, and the sea ice conditions of the eastern side (in legs C, D) are more complicated and affected by sea surface temperature and air pressure. The high pressure of East Siberia results in more rainy weather and a slower melting of sea ice (Cui et al., Reference Cui, Qiao and Shu2015). The navigable window changes in the waters are highly consistent with the navigable windows of the route, resulting in the greatest impact on the navigability of the route.
5.3 Limitations and perspective for future work
This study used the POLARIS introduced by IMO and historical sea ice condition data to quantify and analyse the navigation risk of the Northeast Passage. There were certain limitations in this study. First, POLARIS mainly considered the two factors of sea ice concentration and sea ice development stage in the navigation risk quantification, and lacked consideration of factors that may affect the safety of ships, such as wind, current, visibility and water depth. In future studies, the impact of factors on navigation safety should be integrated, and a more comprehensive and specific quantitative analysis of navigation risk could be carried out.
Secondly, this study was mainly based on ice class 1A ships, considering the navigable windows of the Northeast Passage under different sea ice conditions for ships sailing independently. Regarding the quantification of navigation risk under icebreaker escort conditions, the corresponding RIO calculation was calculated by adding the RIO values for ships sailing independently and one constant (i.e. 10, provided by POLARIS). It should be noted that this constant was only an average value. Regarding the changes in the navigable windows of the Northeast Passage after using icebreaker escort, this study only gave recommendations on the use of icebreaker escort for different navigation risk legs and the improvement of the operation levels, and lacked a combination of actual operating costs and navigation risk to determine a suitable threshold of leg proportion using icebreaker escort. The threshold was used to expand the navigable windows of the Northeast Passage by using icebreaker escorts on the basis of ensuring the economy of ship navigation. In future research, we would combine different ship ice classes and different icebreaker icebreaking capabilities to systematically quantify navigation risk, and combine actual voyages and operating costs to conduct more specific research on the expansion of the route navigable windows under icebreaker escort.
6. Conclusions
In the face of the continuous increase of Arctic shipping, it is of great practical significance to carry out research on the navigation risk of the Northeast Passage. Based on the POLARIS, the RIO of the Arctic waters and the RIO of the route taken by the Yongsheng in its maiden voyage of the Arctic Northeast Passage were calculated to quantitatively analyse the navigation risk of the Northeast Passage using sea ice condition data from 2011 to 2020.
The results showed that under normal sea ice conditions, the navigable window of the Northeast Passage for ice class 1A ships sailing independently was from week 33 to week 45, and the average navigable period was about 91 days. Under light sea ice conditions, the navigable window was from the week 29 to the first week of the following year. The navigable period was about 175 days. And it was only close to navigation during week 40 under severe sea ice conditions. The three critical waters of the Northeast Passage were identified in this study, and the navigation conditions of different critical waters were analysed. In order of the best to the worst navigation conditions, they were the northern waters of the Laptev Sea, the waters from the Vilkitsky Strait to the Sergei Kirov Islands, and the waters from the northeastern part of the New Siberian Islands to the central part of the Eastern Siberian Sea. Based on the three levels of operational restrictions and recommendations given by POLARIS, combined with navigable windows of the Northeast Passage and critical waters under different sea ice conditions, the recommendations on ship navigation and manipulation and recommendations for stakeholders of ships sailing were given under different sea ice conditions.
This study proved that according to the POLARIS, combining with relevant sea ice condition data, the navigation risk of the Arctic waters can be quantitatively analysed. This method used the concentration and development stage information of different sea ice types to calculate RIO, which provided the quantitative description for the navigability and navigation risk of the Northeast Passage. The research results provided reference and support for the assessment of the navigation risk of the Northeast Passage, the formulation of navigation plans and safety operations, which had good practical application value. For the needs of relevant countries and enterprises to rationally arrange shipment dates and sailing plans based on different ice classes of ships, it is more practical and reference to provide navigation risk visualisation, navigable windows, and operation recommendations for different legs of known commercial routes.