INTRODUCTION
Fire activity has increased in the western United States (US) over recent decades as a result of earlier spring onset and longer fire seasons (Westerling et al., Reference Westerling, Hidalgo, Cayan and Swetnam2006; Abatzoglou and Williams Reference Abatzoglou and Williams2016) and the accumulation of fuels resulting from decades of fire suppression (Schoennagel et al., Reference Schoennagel, Balch, Brenkert-Smith, Dennison, Harvey, Krawchuk and Mietkiewicz2017). Our understanding of fire activity prior to Euro-American settlement and land use comes from tree-ring data and lake-sediment charcoal studies (Kitzberger et al., Reference Kitzberger, Brown, Heyerdahl, Swetnam and Veblen2007; Heyerdahl et al, Reference Heyerdahl, Morgan and Riser2008; Falk et al., Reference Falk, Heyerdahl, Brown, Farris, Fulé, McKenzie, Swetnam, Taylor and VanHorne2011; Marlon et al., Reference Marlon, Bartlein, Gavin, Long, Anderson, Briles and Brown2012). These records show the predominant role of climate in shaping vegetation dynamics over time scales of centuries to millennia, but some studies also register the influence of Native American fire-management practices in modifying vegetation at the local scale (Arno, Reference Arno1976; Roos et al., Reference Roos, Sullivan and McNamee2010; Walsh et al., Reference Walsh, Marlon, Goring, Brown and Gavin2015). Clarifying the long-term role of climate and people in shaping the development of forested ecosystems in the northwestern US remains a major challenge. Additionally, fire histories for the topographically and climatically heterogeneous mixed-coniferous forests of the US Northern Rocky Mountains (NRM) are not well understood.
Mixed-coniferous forests are the dominant forest type of the NRM at middle elevations (1000–1800 m above sea level [asl]), extending from Montana to Idaho and Washington (Jain et al., Reference Jain, Battaglia, Han, Graham, Keyes, Fried and Sandquist2012; Vance and Luna, Reference Vance and Luna2017). Forest composition of mixed-coniferous forests varies considerably depending upon local climate, elevation, and topography; xerophytic and mesophytic conifer taxa typically grow in close proximity and form a mosaic. In the NRM, they are dominated by Pseudotsuga menziesii, Larix occidentalis, Pinus contorta, and Pinus ponderosa and lesser amounts of Picea engelmannii, Abies grandis, Tsuga heterophylla, and Thuja plicata (Jain et al., Reference Jain, Battaglia, Han, Graham, Keyes, Fried and Sandquist2012). Today, mixed-coniferous forests are maintained by frequent fires (10–13 episodes 1000 yr–2) of different severity, intensity and size, often referred to as a mixed-severity fire regime (Arno et al., Reference Arno, Parsons and Keane2000; Jain et al., Reference Jain, Battaglia, Han, Graham, Keyes, Fried and Sandquist2012). The juxtaposition of infrequent high-severity fires and frequent low-severity fires creates a diverse and complex mosaic of open and closed forest stands.
Following decades of fire suppression, and with current management efforts aimed at decreasing fire danger in the NRM (United States Forest Service, 2014), fuel biomass has increased in many mixed-coniferous forests, resulting in larger and, in some cases, more severe fires (Hessberg et al., Reference Hessburg, Churchill, Larson, Haugo, Miller, Spies and North2015; Seidl et al., Reference Seidl, Spies, Peterson, Stephens and Hicke2016; Schoennagel et al., Reference Schoennagel, Balch, Brenkert-Smith, Dennison, Harvey, Krawchuk and Mietkiewicz2017). Given this shift, there is a need to better understand the vegetation and fire dynamics of mixed-coniferous forests. Most of the pollen and charcoal studies from the NRM come from sites in high-elevation subalpine forests or near lower treeline (Mehringer et al., Reference Mehringer, Arno and Petersen1977a; Mack et al., Reference Mack, Rutter, Bryant and Valastro1978a, Reference Mack, Rutter, Valastro and Bryant1978c; Brunelle et al., Reference Brunelle, Whitlock, Bartlein and Kipfmueller2005; Power et al., Reference Power, Whitlock and Bartlein2011), while few records are available from the mixed-coniferous forests at middle elevations (but see Mack et al., Reference Mack, Rutter, Valastro and Bryant1978b, Reference Mack, Rutter and Valastro1983; Whitlock, Reference Whitlock1992; Whitlock et al., Reference Whitlock, Briles, Fernandez and Gage2011). To add to our understanding of the history of these forests, we describe the vegetation and fire history from Twin Lakes (47°14.33'N, 113°54.40'W, 1236 m asl) located in the southern Mission Range of northwestern Montana. We compare the Twin Lakes record with other records in the region (Fig. 1) to reconstruct the paleoenvironmental history along a moisture gradient from eastern Washington to western Montana (~120–113°W) and a latitudinal gradient from north-to-south within the NRM (~44–49°N).
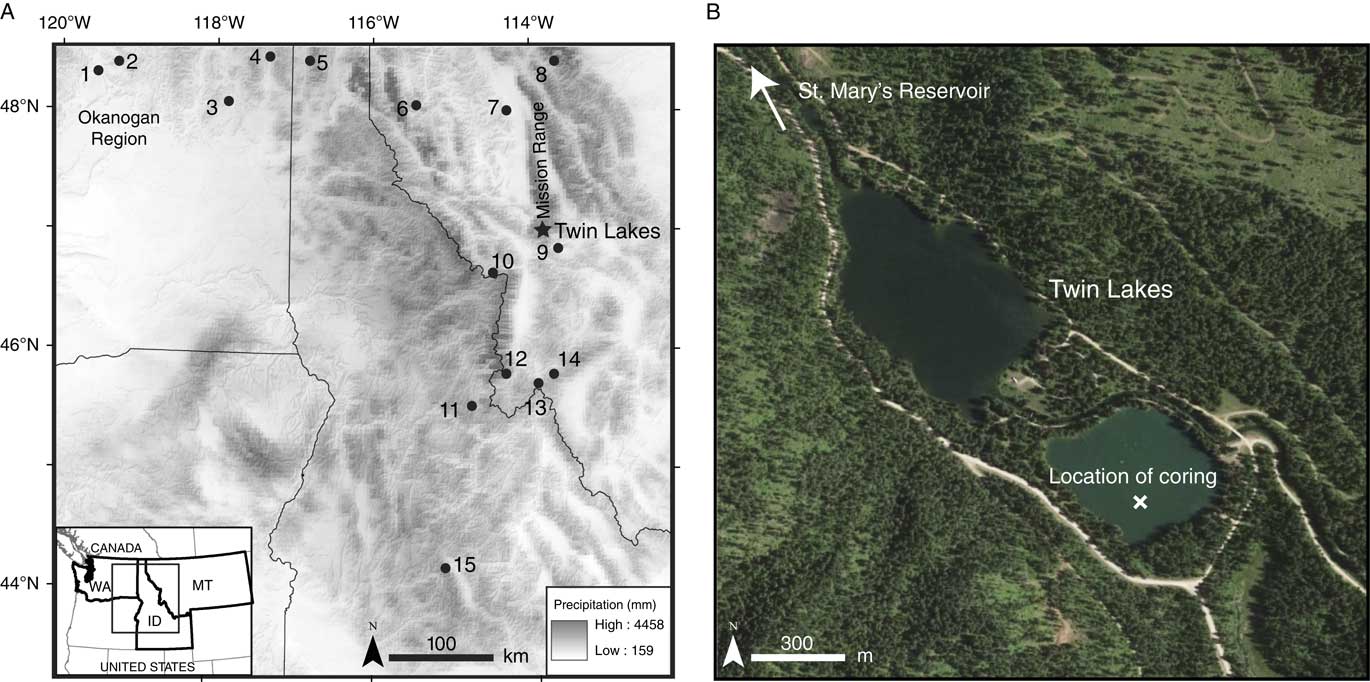
Figure 1 (color online) (A) Map of Twin Lakes and regional study sites in the Northern Rocky Mountains and Pacific Northwest over a base map showing average annual precipitation from 1981–2010 (PRISM Climate Group, 2015): 1, Mud Lake (Mack et al., Reference Mack, Rutter and Valastro1979); 2, Bonaparte Meadows (Mack et al., Reference Mack, Rutter and Valastro1979); 3, Waits Lake (Mack et al., Reference Mack, Rutter, Bryant and Valastro1978c); 4, Big Meadow (Mack et al., Reference Mack, Rutter, Bryant and Valastro1978a); 5, Hager Pond (Mack et al., Reference Mack, Rutter, Valastro and Bryant1978b); 6, Tepee Lake (Mack et al., Reference Mack, Rutter and Valastro1983); 7, Foy Lake (Power et al., Reference Power, Whitlock and Bartlein2011); 8, Johns Lake (Whitlock, Reference Whitlock1992); 9, Sheep Mountain Bog (Mehringer et al., Reference Mehringer1985); 10, Pintler Lake (Brunelle et al., Reference Brunelle, Whitlock, Bartlein and Kipfmueller2005); 11, Hoodoo Lake (Brunelle et al., Reference Brunelle, Whitlock, Bartlein and Kipfmueller2005); 12, Burnt Knob (Brunelle et al., Reference Brunelle, Whitlock, Bartlein and Kipfmueller2005); 13, Lost Trail Pass Bog, (Mehringer et al., Reference Mehringer, Arno and Petersen1977a); 14, Baker Lake (Brunelle et al., Reference Brunelle, Whitlock, Bartlein and Kipfmueller2005); 15, Decker Lake (Whitlock et al., Reference Whitlock, Briles, Fernandez and Gage2011); (map source, ESRI). (B) Close-up of Twin Lakes, including location of coring (map source, Google Earth).
Twin Lakes is an ideal location for examining climate and possible human influence on fire activity. The Mission Range is currently home to the Salish, Kootenai, and Pend d’Oreille tribes (Confederated Salish and Kootenai Tribes, CSKT), and indigenous peoples have occupied the region for thousands of years (Malouf, Reference Malouf1974). Indigenous peoples in the region used fire as a tool to promote particular resources and maintain travelways (Barrett and Arno, Reference Barrett and Arno1999; Williams Reference Williams2002; Trauernicht et al., Reference Trauernicht, Brook, Murphy, Williamson and Bowman2015), and Twin Lakes lies on a well-known trade route for early passage over the Mission Range (CSKT, 2005). More recently, twentieth-century forest management and fire suppression has resulted in dramatic changes to forest patch structure and fuel conditions, including an increase in tree density and ladder fuels in the Mission Mountains (CSKT, 2005), yet the impact of these changes on fire activity is not well understood.
Site description
Twin Lakes consists of two small (4–5 ha) lakes located at the southwestern end of the Mission Range (Fig. 1), and this study focuses on the eastern lake. The Mission Range is a north-south trending mountain range in western Montana, bordered on the west by Flathead Lake and the Mission Valley, and on the east by Swan Valley. The axis of the range is ~90 km in length, and the highest peak, McDonald Peak, reaches 2990 masl. During the last glaciation (26,000–19,000 cal yr BP; Clark et al., Reference Clark, Dyke, Shakun, Carlson, Clark, Wohlfarth, Mitrovica, Hostetler and McCabe2009), the Flathead Lobe of the Cordilleran Ice Sheet extended to the northern margin of the Mission Range, and alpine glaciers existed throughout the range (Davis, Reference Davis1916; Alden, Reference Alden1953). Small cirque glacier, such as Gray Wolf and McDonald glaciers, still persist in the middle and southern portion of the range.
Today, the climate of the Mission Range is influenced by air masses from the Pacific Ocean and continental polar region. Precipitation primarily arrives via Pacific storm systems in winter, and while the northeastern Pacific subtropical high-pressure system suppresses precipitation in summer, local convectional storms bring modest rainfall to the range in spring and summer. Average annual precipitation is 380 mm in the Mission Valley and 1500 mm at higher elevations (Parrett, Reference Parrett1997). Twin Lakes receives an annual average of 710 mm of precipitation, with slightly more arriving in winter than in summer (December–February, 210 mm; March-May, 200 mm; June–August, 140 mm; September–November, 160 mm). Mean annual temperature at Twin Lakes is 5°C; mean maximum summer temperature (June–August) is 23°C; and mean minimum summer temperature is 8°C. Mean minimum winter (December–February) temperature is –8°C and the maximum is 0°C. Climate data are 30-year averages from 1981–2010 (PRISM Climate Group, 2015).
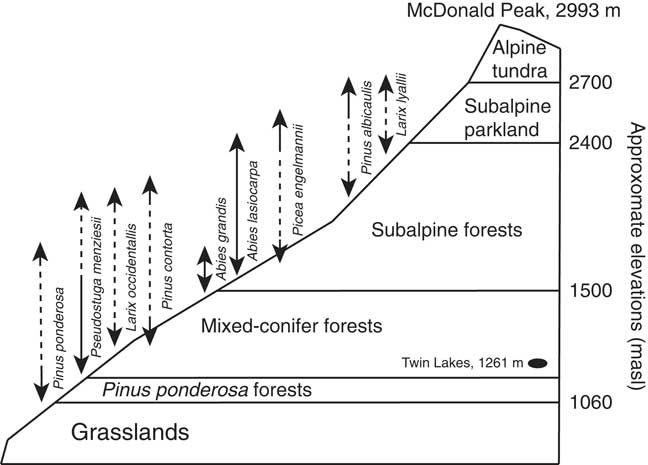
Present-day vegetation types vary along elevational and aspect gradients (Fig. 2). The valley (<1060 m asl) supports perennial grasses and forbs, and Pinus ponderosa and Pseudotsuga menziesii forests dominate the lower mountain slopes (1060–1500 masl). Mesic settings, such as north-facing low-elevation slopes, also contain Larix occidentalis, Picea engelmannii, Pinus contorta, Thuja plicata, Abies grandis, and Pinus monticola (Arno, Reference Arno1979; Burns and Honkala, Reference Burns and Honkala1990; Swaney, Reference Swaney2005). Abies grandis, Picea engelmannii, Abies lasiocarpa, and Pinus albicaulis forests are found at higher elevations and in cool, wet settings (1500–2400 masl), and subalpine parkland of Pinus albicaulis and Larix lyallii grow from 2400–2700 masl, above which is alpine tundra (Pfister et al., Reference Pfister, Kovalchik, Arno and Presby1977).

Figure 2 Generalized vegetation zones of the Mission Range showing approximate elevations of different forest types. Vertical arrows represent the elevational range of each species (adapted from Arno, Reference Arno1979; Pfister, Reference Pfister, Kovalchik, Arno and Presby1977).
Twin Lakes is surrounded by forests dominated by Pseudotsuga menziesii, Pinus ponderosa, Larix occidentalis, and Pinus contorta, with lesser amounts of Picea engelmannii, Abies grandis, and Thuja plicata. Riparian areas support Populus tremuloides, Populus balsamifera ssp. trichocarpa, and Salix spp. Common understory plants in the watershed include Acer glabrum, Holodiscus discolor, Prunus virginiana, Rosa woodsii, Physocarpus malvaceus, Xerophyllum tenax, and Vaccinium globulare. Species of Poaceae, Carex, Isoetes, Scirpus, and Typha grow along lake margins and in the lake.
Low-elevation dry forests of Pseudotsuga and Pinus ponderosa grow in south-to-west aspects of the Mission Range and are maintained by frequent low-severity (i.e., surface) fires (Swaney, Reference Swaney2005). Low-to-middle elevation (1060–1500) mixed-coniferous forests of Pseudotsuga, Larix occidentalis, Pinus ponderosa, and Pinus contorta have historically supported both low- and high-severity fires (Swaney, Reference Swaney2005; Baker, Reference Baker2009). At higher elevations (>1500 masl), subalpine forests of fire-sensitive taxa Abies grandis, Abies lasiocarpa, and Picea engelmannii are associated with high-severity (e.g., stand-replacement) fires (Agee, Reference Agee1993). Because of the steep topography and microclimates of the Mission Range, fire-adapted taxa often persist in close proximity to fire-sensitive mesic species, creating a complex pattern of burning and diverse forest structure.
METHODS
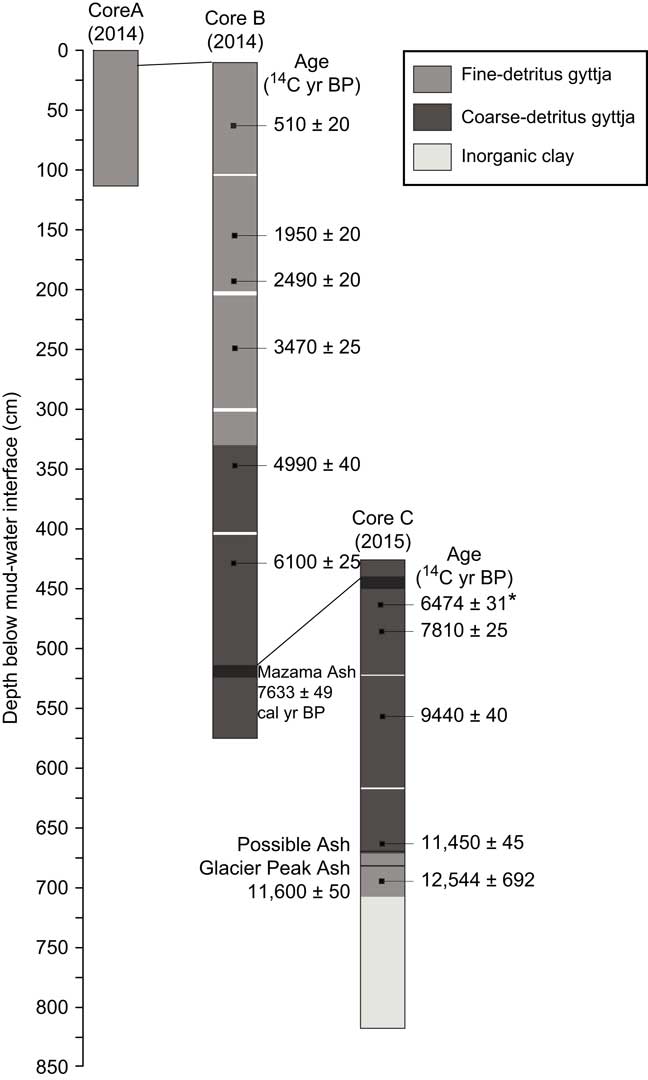
Three sediment cores were obtained from a platform anchored in the deepest part of Twin Lakes (4 m water depth): a 120-cm-long core (core A) was retrieved with a polycarbonate tube (Klein corer), and a 564-cm-long core (core B) and 391-cm-long core (core C) were taken with a modified Livingstone square-rod piston coring device (Wright et al., Reference Wright, Mann and Glaser1983). Cores A and B included the mud-water interface, and core C was taken 450 cm below the mud-water interface to extend the record to glacial silts and clays. The cores were extruded, wrapped in plastic wrap and aluminum foil, and refrigerated at Montana State University. In the laboratory, they were cut longitudinally, inspected for macrofossils, and lithological changes were described (Fig. 3). Macrofossils or bulk sediment (where macrofossils were not present) were taken from every meter of cores B and C and submitted for accelerator mass spectrometry (AMS) radiocarbon dating (Table 1).

Figure 3 Lithology diagram of the three cores from Twin Lakes, showing the stratigraphic position of uncalibrated radiocarbon dates and ash layers. *, rejected age.
Table 1 Radiocarbon ages for Twin Lakes.

Pollen analysis
Samples of 0.5 and 1 cm3 volume were taken at ~10-cm intervals above the inorganic clay for pollen analysis which resulted in a mean sample resolution of ~200 yr. Pollen was processed following procedures outlined by Bennett and Willis (Reference Bennett and Willis2001), and a Lycopodium tablet of known concentration was added to each sample in order to calculate pollen concentrations per sample (grains cm–3) and pollen accumulation rates (PAR; grains cm–2 yr–1). Pollen residues were mounted onto slides with silicon oil, and a minimum of 300 terrestrial pollen grains was counted per slide at 400 to 1000×magnifications. Pollen reference slides and keys (McAndrews et al., Reference McAndrews, Berti and Norris1973; Faegri and Iverson, Reference Faegri and Iversen1989; Kapp et al., Reference Kapp, Davis and King2000) were used to identify grains to the lowest possible taxonomic level. Terrestrial pollen counts were converted to percentages based on the terrestrial pollen sum, and aquatic pollen counts were converted based on the combined sum of terrestrial and aquatic pollen. Cyperaceae was considered an aquatic species at this site and included in the aquatic pollen sum. Arboreal pollen (AP) is the sum of all tree and shrub species excluding Artemisia, and non-arboreal pollen (NAP) is the sum of Artemisia, herbs, and grasses. The AP:NAP ratio was calculated with the formula (AP–NAP)/(AP+NAP). Tilia software (written by E. Grimmn) was used to create a pollen diagram. The record was divided into pollen zones based on the visual inspection of changes in vegetation assemblages.
Several species of Pinus grow in the Mission Range, and their pollen grains were separated into haploxylon and diploxylon types. The former (identified by the presence of verrucae on the distal membrane) were attributed to P. albicaulis, P. monticola and/or P. flexilis, and the latter to P. ponderosa and/or P. contorta. Pinus grains missing distal membranes were counted as undifferentiated Pinus. Abies grains were attributed to A. grandis and/or A. lasiocarpa, and Cupressaceae pollen was assigned to Juniperus communis, J. scopulorum, and/or T. plicata. Pseudotsuga menziesii, L. occidentalis, and L. lyallii grow in the Mission Range, and their grains are undistinguishable; therefore, their pollen was identified as Pseudotsuga/Larix.
Charcoal analysis
The top 20 cm of core A and top 50 cm of core B were subsampled at 0.5-cm contiguous intervals for high-resolution charcoal analysis of the most recent few centuries, and the remainder of core B and all of core C were subsampled at 1-cm contiguous intervals for charcoal analysis. Following procedures outlined by Whitlock and Larsen (Reference Whitlock and Larsen2001), 2 cm3 samples at each interval were soaked in a mixture of bleach and sodium metaphosphate (NaPO3) for 24 hours to deflocculate the sediment. The remnants were wet-screened through a 125-µm sieve, and charcoal particles larger than 125 µm were counted using a stereomicroscope as previous studies have shown that particles larger than this size reflect local fire events (Whitlock and Larsen, Reference Whitlock and Larsen2001).
CharAnalysis (https://sites.google.com/site/charanalysis/) was used to perform a statistical analysis of the charcoal counts and reconstruct a fire history for Twin Lakes according to the methods described by Higuera et al. (Reference Higuera, Brubaker, Anderson, Hu and Brown2009). Charcoal counts were converted into charcoal accumulation rates (CHAR; particles cm–2 yr–1) and the time series was interpolated to 17-yr time steps (the median deposition time per sample) to minimize differences in charcoal accumulation due to changes in deposition rate. A 700-yr lowess smoother, robust to outliers, was used to distinguish the long-term background trends (BCHAR), because it optimized the signal-to-noise ratio (SNI>3; Kelly et al., Reference Kelly, Higuera, Barrett and Hu2011). Positive deviations from BCHAR were counted as both fire peaks and noise. After applying a Poisson minimum count test, charcoal peaks that exceeded a 95% threshold were identified as fire episodes (one or more fires occurring during the time span of the peak), and the time in between fire episodes was smoothed with a 1000-yr window to produce a fire episode frequency record (episodes 1000 yr–1).
Regional analysis
Twelve published pollen records from low-to-mid elevation sites in eastern Washington, Idaho, and Montana were compared with the Twin Lakes data to evaluate regional and local trends in vegetation history within the elevational range where mixed-coniferous forests occur. Because many of these chronologies were based on uncalibrated 14C dates, new calibrated age-depth models were created using Clam software v2.2 (Blaauw, Reference Blaauw2010). Radiocarbon ages from the original records were characterized as high or low quality based on their relation to tephra layers of known age, magnitude of uncertainty, and whether uncertainty was suspected in the original analysis. Low-quality radiocarbon ages were not used in the new age-depth models.
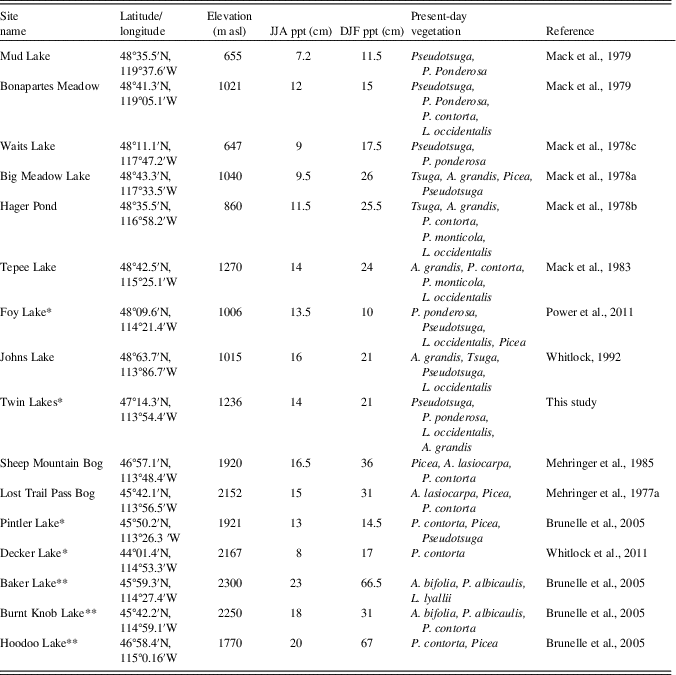
Only three of the sites used for the vegetation history comparison had macroscopic charcoal records, so three additional NRM sites were included in the regional fire history comparison, resulting in a total of 7 charcoal records (including Twin Lakes) from low to high elevations in western Montana and central Idaho (Table 2). Charcoal data were obtained from the Global Charcoal Database (http://www.paleofire.org), and analyzed in CharAnalysis. Based on sensitivity analyses, a 500-yr lowess smoothing parameter was used to identify fire peaks in CharAnalysis for the previous studies in the region.
To assess regional fire trends over time, we constructed a composite charcoal record by fitting generalized additive models (GAMs) to the high-resolution charcoal data from the seven sites (Table 2). In particular, GAMs that assumed CHAR to have a Gaussian or Gamma distribution were fitted to the CHAR time series using penalized likelihood maximization, and thin plate and cubic splines with different degrees of smoothing were considered. GAMs are a powerful trend detection tool that do not assume linearity or require interpolation (Wood, Reference Wood2011).
Model selection was performed through comparison of the Akaike’s Information Criterion (AIC). The GAM with the lowest AIC value is expected to increase goodness of fit while penalizing overfitting, and therefore provides the most representative trend of regional fire activity. Analyses were performed with R-programming language (R Core Team, 2015) with the package mgcv, Version 1.7-22 (Wood, Reference Wood2011). A GAM that explained 29.2% of the null deviance and assumed CHAR (i.e., the combined charcoal data from all sites) to be normally distributed with mean μ and standard deviation σ outperformed all the other models (ΔAIC>12) [Equation 1]. The normality assumption was tested by visually assessing the distribution of the residuals.
 $${\rm CHAR}_{{{\rm (i)}}} {\rm \,{\equals}\,s}\,\left( {{\rm time}_{{\rm i}} } \right){\rm {\plus}site}_{{\rm s}} {\rm {\plus} {\rvarepsilon}}_{{{\rm (i)}}} $$
where the ith CHAR value in the time series was modeled as a smoothing function of the concatenated time series of all sites [Equation 2]; the nominal variable site, which allows for a specific intercept for each charcoal record; and ε(i) is the error (normally distributed with mean μ and standard deviation σ). The specific intercept for each site (nominal variable site) was calculated as the difference between the mean CHAR at each site and the mean CHAR at Twin Lakes. It thus accounts for systematic differences in CHAR between sites and prevents the regional trend from being dominated by the site with the highest CHAR.
 $${ s}\,\left( {{ time}_{{ i}} } \right)\,{\equals}\,\Sigma^{n} }_{{{ j \equals i}}} { s}({ time}_{ij}{\rm )}$$
where n is the total number of covariates; and s (time ij ) is a smoothing function.
RESULTS
Lithology
Sediment cores were primarily composed of brown gyttja (Fig. 3). Core A was entirely brown fine-detritus gyttja. Core B consisted of brown fine-detritus gyttja from 0–336 cm depth, and brown coarse-detritus gyttja from 336–564 cm depth. A tephra from 514–524 cm depth was inferred to be from the eruption of Mount Mazama at 7633 ± 49 cal yr BP (Egan et al., Reference Egan, Staff and Blackford2015). Core C was composed of coarse-detritus gyttja from 425–672 cm depth and fine-detritus gyttja from 672–703 cm depth. A light gray tephra from 437–447 cm depth was identified as the Mazama Ash, and an additional tephra layer at 682–684 cm depth was attributed to the eruption of Glacier Peak at ca. 11,600 ± 50 14C yr BP (Keuhn et al., 2009). A light grey layer at 672–673 cm depth could be an ash layer from a second eruption of Glacier Peak. From 703 to 796 cm depth, the lithology consisted of gray-pink inorganic clay, and the basal unit, 796–816 cm depth, consisted of inorganic clay with pebbles (20–50 mm diameter).
Chronology
Age-depth chronologies for the three cores were based on eleven AMS 14C ages and two known tephra layers, Mazama Ash and Glacier Peak Ash (Fig. 4; Table 1). Radiocarbon ages were converted to calendar years in Clam software v2.2 (Blaauw, Reference Blaauw2010) using the IntCal13 calibration curve (Reimer et al., Reference Reimer, Bard, Bayliss, Beck, Blackwell, Bronk Ramsey and Buck2013), and the final age-depth model was developed by fitting Monte Carlo smoothing splines through the probability distribution of all calibrated ages (error-weighted with smoothness set at 0.25). One AMS 14C age taken from core C at 461 cm depth caused an age reversal and was rejected from the final age-depth model. The deepest organic sediment dated at 12,544±692 14C yr BP (14,801±322 cal yr BP), although there was a meter of inorganic clay below this sample. Charcoal stratigraphy was used to correlate cores A and B, and the Mazama Ash was used to correlate cores B and C, creating one continuous record (Fig. 3).
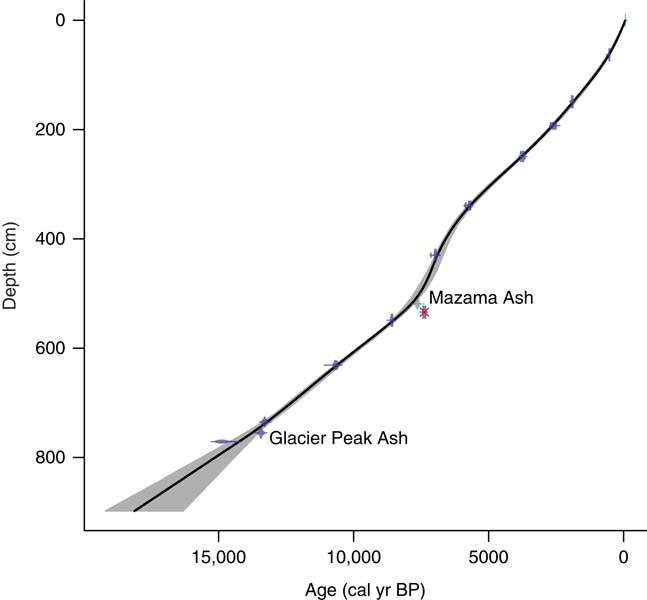
Figure 4 Age-depth model of Twin Lakes, developed with CLAM software. The black line shows the interpolated age for each depth of the core, and the grey shading represents the 95% confidence interval. The dots are the calibrated radiocarbon ages and the horizontal bars show their uncertainties. The two ash layers are identified, and the one rejected age is crossed out in red. (For interpretation of the references to color in this figure legend, the reader is referred to the web version of this article.)
Pollen and charcoal data
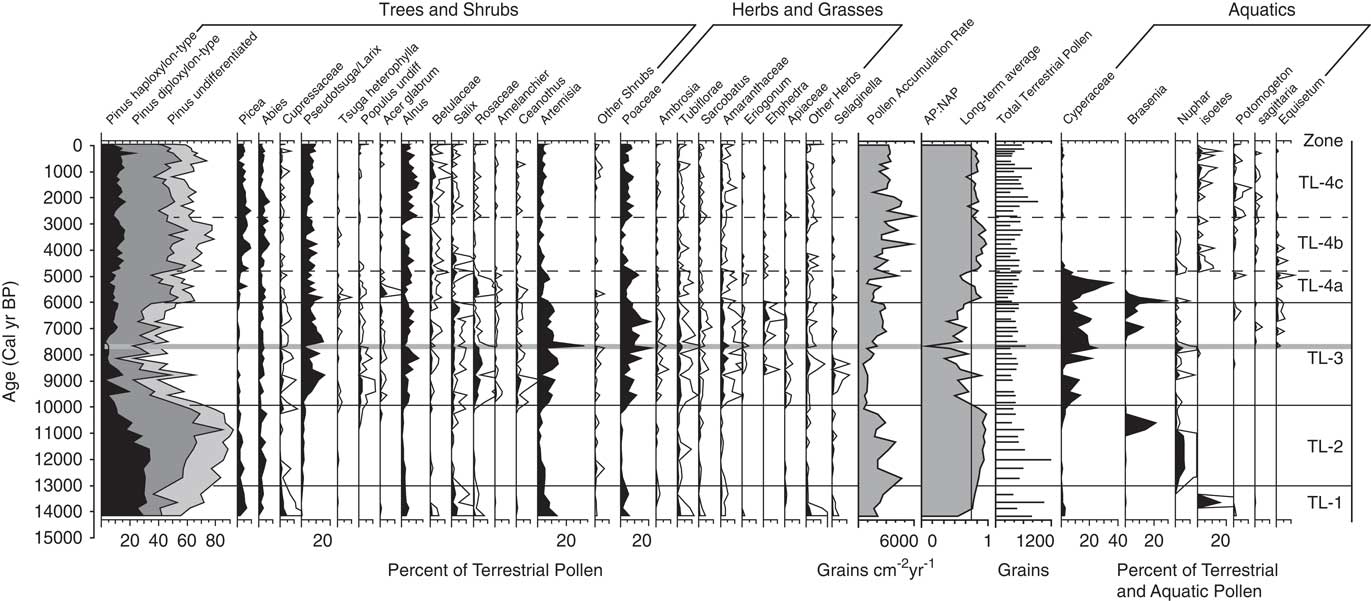
Pollen percentage data from Twin Lakes were divided into four pollen zones (Fig. 5). Zone TL-1 (896–730 cm depth; >14,000–13,000 cal yr BP) is initially dominated by taxa suggestive of a shrub-parkland environment, which then transitions to forest taxa. The base of the zone has high percentages of shrubs and herbs including Alnus (3–5%) and Artemisia (4–14%). Total Pinus (55–83%) has the highest overall percentage of pollen, with haploxylon-type Pinus (25–31%) contributing more than diploxylon-type Pinus (13–25%). Pollen of Picea (2–5%) and Abies (0–3%) is present in low percentages, and Cupressaceae (1–4%) pollen decreases from the base to the top of the zone. The arboreal to nonarboreal pollen ratio (AP:NAP) increases through the zone, and the pollen accumulation ratio (PAR) increases upwards from 1637 to 2677 grains cm–2 yr–1. CHAR begins accumulating at ca.14,560 calyrBP but values are very low until 13,000 cal yr BP. Fire episode frequency reaches 6 episodes 1000 yr–1 at the top of the zone (Fig. 6).

Figure 5 Pollen percentage diagram showing selected taxa from Twin Lakes, Montana. For the AP:NAP ratios, arboreal taxa included all tree and shrub species other than Artemisia, and non-arboreal taxa included Artemisia, herbs, and grasses. Pinus pollen data are stacked percentages. Terrestrial pollen percentages based on terrestrial pollen sums, and aquatic pollen percentages are based on the sum of aquatic and terrestrial pollen. All percentage scales are the same. White outlines represent 5× exaggeration. The eruption of Mt. Mazama is highlighted by the grey horizontal line.

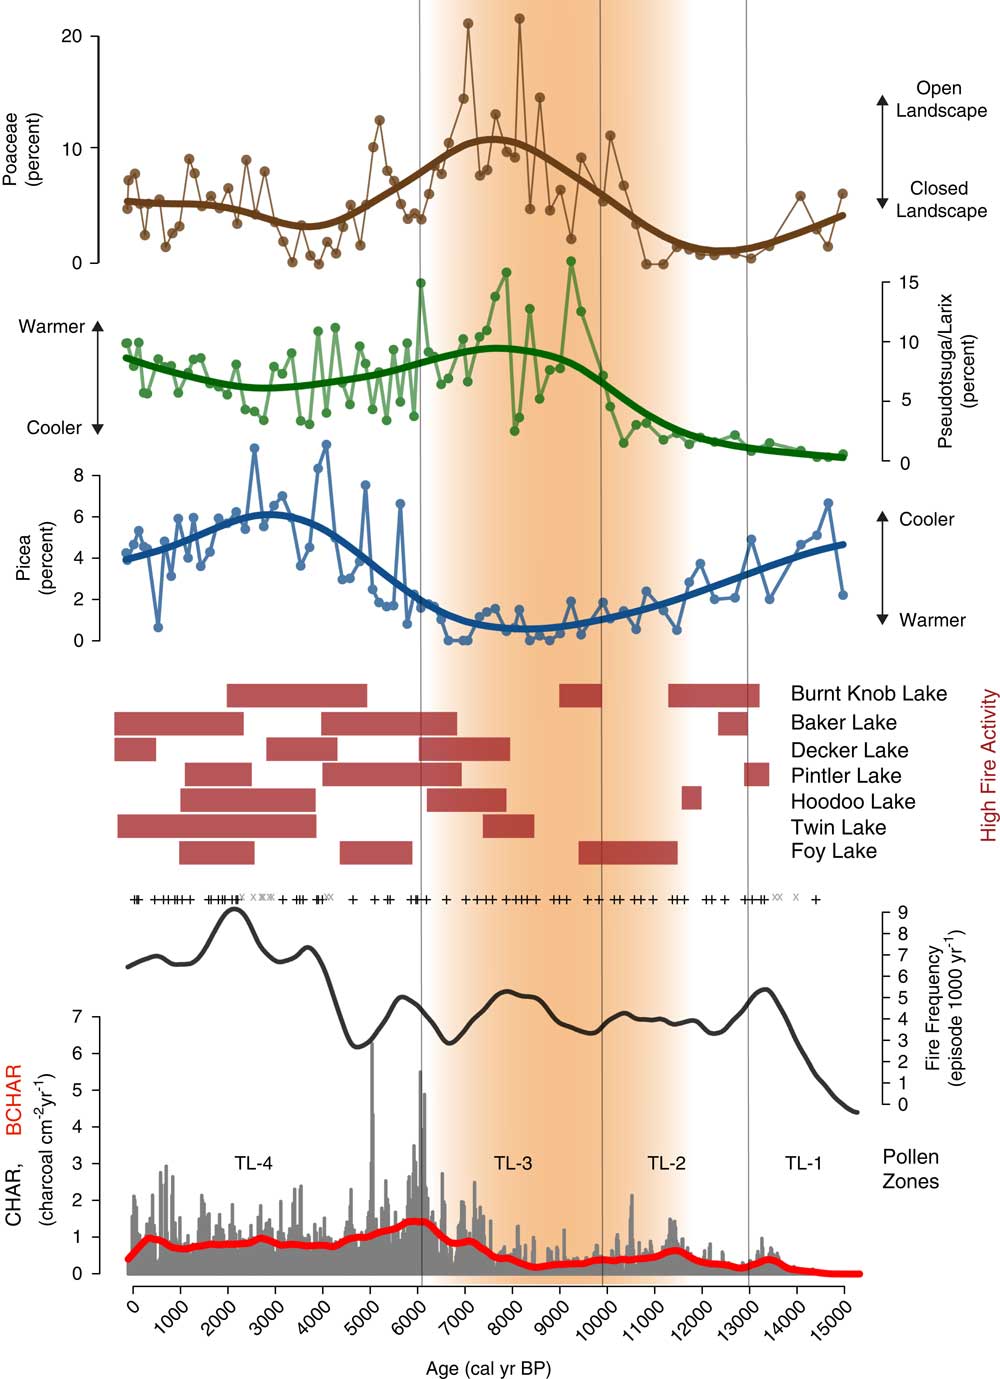
Figure 6 Charcoal influx, fire episode, and frequency data from Twin Lakes, Montana, with select Twin Lakes pollen data and times of high fire episode frequency (red rectangles) at other sites from the region. Grey x, insignificant charcoal peaks; +, represent significant charcoal peaks; red line, background charcoal component (BCHAR); orange shading, the summer insolation maximum when conditions were warmer and drier than before or after. (For interpretation of the references to color in this figure legend, the reader is referred to the web version of this article.)
Zone TL-2 (730–604 cm depth; 13,000–9900 cal yr BP) pollen data suggests a period of closed forest, as indicated by increases in the total Pinus percentage and the AP:NAP ratio. Haploxylon-type Pinus (10–34%) decreases after ca. 11,000 cal yr BP, but diploxylon-type Pinus (26–68%) increases to its highest level of the record, and Abies (1–6%) and Picea (1–5%) percentages remain unchanged from the previous zone. Artemisia (0–5%) pollen decreases along with all other shrub and herb pollen (0–1%). PAR increases to a high of 4674 grains cm–2 yr–1, and decreases to a low of 548 grains cm–2 yr–1 at the top of the zone. CHAR and BCHAR increase slightly at 11,400 cal yr BP, but fire episode frequency remains low, between 4–5 episodes 1000 yr–1.
The Zone TL-3 (604–374 cm depth; 9900–6100 cal yr BP) assemblage suggests an open forest or parkland dominated by Pseudotsuga and/or Larix. Pseudotsuga/Larix pollen (1–16%) increases to its highest value in the record, and because Pseudotsuga/Larix pollen is poorly represented even in places where the conifers are abundant (Sugita, Reference Sugita1994), these pollen values suggest the local presence of one or both conifers. Pollen values of Poaceae (2–22%) and Artemisia (2–33%) increase in abundance to values typical of modern steppe vegetation (Whitlock, Reference Whitlock1993), and other shrub pollen percentages, including those of Rosaceae (1–6%) and Ceanothus-type (0–4%), also increase. Cyperaceae (1–25%) percentages are also dominant in this zone. Pollen of haploxylon-type Pinus (2–11%), diploxylon-type Pinus (6–39%), Picea (0–2%), and Abies (0–4%) decrease to their lowest percentages of the record, and combined with a decrease in AP:NAP and PAR (502–2906 grains cm–2yr–1), suggest an open forest or parkland of Pseudotsuga and/or L. occidentalis. Immediately above the Mazama Ash, Pseudotsuga/Larix percentages decrease to 10% while those of Artemisia increase to 27%, suggesting tree cover declined for ~200 years after ash deposition. CHAR and BCHAR decrease during the first half of the zone, but began to increase after ~8400 cal yr BP. Fire episode frequency fluctuates between 3 and 6 episodes 1000 yr–1, with a maximum at ~8000 cal yr BP.
The forest closed during Zone TL-4 (374–0 cm depth; 6100–present day), suggested by the dominance of conifer pollen types and the decline in Artemisia (2–9%) and Poaceae (4–13%) percentages.
Zone TL-4a (374–324 cm depth; 6100–4800 cal yr BP) showa a large rise in diploxylon-type Pinus (24–44%), a slight increase in Picea (1–7%), and a slight decrease in Pseudotsuga/Larix (3–15%) pollen, and percentages of haploxylon-type Pinus (5–10%) and Abies (2–5%) remain similar to Zone TL-3. Cyperaceae values initially rise to 38% but drop to 1% at the top of the subzone and remain low for the rest of the record. AP:NAP increases from the previous zone, and PAR (1188–4232 grains cm–2 yr–1) increases towards the top of the subzone, suggesting forest closure. At the onset of subzone TL-4a, CHAR and BCHAR are the highest of the record, although fire episode frequency remains the same as the previous zone, with 3–5 fire episodes 1000 yr–1.
Higher amounts of Picea (3–7%), Abies (1–7%), and Pinus (63–79%) pollen characterize zone TL- 4b (324–202 cm depth; 4800–28,00 cal yr BP). Haploxylon-type Pinus pollen percentages increase (10–17%) and Pseudotsuga/Larix pollen (3–10%) decrease slightly from the previous subzone. Poaceae (0–5%), Artemisia (1–5%) and other shrubs and herbs, including Rosaceae, Ceanothus-type, and Amaranthaceae (all 0–1%), decrease. PAR (1773–5720 grains cm–2 yr–1) and AP:NAP increase, consistent with a closed forest. CHAR decreases, but fire episode frequency increases to 7 episodes 1000 yr–1.
Subzone TL-4c (202–0 cm depth; 2800 cal yr BP–present) marks the establishment of the modern forest. It is similar to subzone 4a, other than fewer shrubs and herbs. Picea (0–9%), Abies (1–7%), and Pinus (49–73%) pollen decline slightly from subzone TL-4b, as does PAR (1559–6089 grains cm–2 yr–1) and AP:NAP levels. Alnus is a prominent shrub in this zone (2–12%), and Poaceae (2–9%) increases from subzone TL-4b. CHAR and BCHAR values are similar to the preceding subzone, but decrease from 500 cal yr BP toward present day. Fire episode frequency increases to a high of 9 episodes 1000 yr–1 at ~2000 cal yr BP, then decreases to 6 episodes 1000 yr–1 towards present day.
DISCUSSION
Twin Lakes Vegetation and Fire Record
The Twin Lakes vegetation and fire records provide new information to evaluate the late glacial and Holocene environmental history of the southern Mission Range, Montana. Paleoclimate model simulations of the western US (Berger, Reference Berger1978; Thompson et al., Reference Thompson, Whitlock, Bartlein, Harrison and Spaulding1993; Bartlein et al., Reference Bartlein, Anderson, Anderson, Edwards, Mock, Thompson, Webb, Webb and Whitlock1998; Kutzbach et al., Reference Kutzbach, Gallimore, Harrison, Behling, Selin and Laarif1998; Alder and Hostetler, Reference Alder and Hostetler2015) provide a paleoclimatic context for interpreting important drivers of Holocene vegetation change and fire activity. During the late glacial (>14,000–11,000 cal yr BP), summer insolation levels rose from 4 to 8% above present day (Berger, Reference Berger1978). Paleoclimate simulations show that during full-glacial conditions, a persistent glacial anticyclone over the Laurentide Ice Sheet directed the jet stream ~20° south of its present location over northwestern North America (Thompson et al., Reference Thompson, Whitlock, Bartlein, Harrison and Spaulding1993; Bartlein et al., Reference Bartlein, Anderson, Anderson, Edwards, Mock, Thompson, Webb, Webb and Whitlock1998; Alder and Hostetler, Reference Alder and Hostetler2015). Between 16,000 and 11,000 cal yr BP, simulations suggest that the retreat of the ice sheet resulted in a northerly shift of the jet stream and associated storm tracks towards their present-day location in northwestern North America (Bartlein et al., Reference Bartlein, Anderson, Anderson, Edwards, Mock, Thompson, Webb, Webb and Whitlock1998; Alder and Hostetler, Reference Alder and Hostetler2015). Across most of the western US, deglaciation was accompanied by a shift from cold and dry conditions to those that were warmer and wetter than before.
Pollen data from Twin Lakes reflects this late glacial transition from cold to warmer conditions. Prior to 13,500 cal yr BP, pollen data indicate the presence of shrub-parkland dominated by xerophytic Artemisia and Cupressaceae (attributed to J. communis), haploxylon-type Pinus (attributed to P. monticola and/or P. monticola), and minor amounts of Picea and Abies (Fig. 5). The presence of P. monticola, P. albicaulis, and/or possibly P. flexilis, along with Picea and Abies is consistent with a cool environment, and low CHAR prior to 13,500 cal yr BP indicate few fires (Fig. 6). After 13,500 cal yr BP, a large increase in diploxylon-type Pinus and a decline in Artemisia and Poaceae suggest a transition to closed forest. P. contorta and/or P. ponderosa were abundant and P. albicaulis and/or P. monticola shifted their ranges upslope. Increased CHAR levels imply more fires as a result of more fuel biomass and warmer conditions.
Warming continued into the early Holocene (11,000–6000 cal yr BP), when summer insolation reached a maximum at ~11,000 cal yr BP (8% higher than present day; Berger, Reference Berger1978). Paleoclimate simulations for 11,000 and 6000 cal yr BP show summer temperatures higher than present-day and evapotranspiration in the northwestern US as a result of a strengthened subtropical high-pressure system over the northeastern Pacific Ocean (Thompson et al., Reference Thompson, Whitlock, Bartlein, Harrison and Spaulding1993; Bartlein et al., Reference Bartlein, Anderson, Anderson, Edwards, Mock, Thompson, Webb, Webb and Whitlock1998; Kutzbach et al., Reference Kutzbach, Gallimore, Harrison, Behling, Selin and Laarif1998). This shift to warm, dry conditions in the early Holocene helps explain the substantial increase of xerophytic species such as Pseudotsuga, Artemisia, and Poaceae between 10,000 and 6000 cal yr BP in the Twin Lakes pollen record. The abundance of Pseudotsuga macrofossils at Johns Lake, at a similar elevation 150 km to the north (Whitlock, Reference Whitlock1992), and at Sheep Meadow Bog, 34 km to the southeast (Mehringer, Reference Mehringer1985), suggests that the Twin Lakes pollen reflects Pseudotsuga rather than Larix, and that Pseudotsuga grew in an open forest or parkland with Artemisia and Poaceae. The presence of extralocal pollen such as Ephedra and Tsuga heterophylla (Fig. 5), further suggests an open landscape and long-distance pollen transport. The increase of Cyperaceae percentages and partially decomposed vegetation (coarse detritus) in the core lithology (Fig. 3) imply a shallow lake with wetland margins. Fire episode frequency increased slightly at ~9000 cal yr BP but low CHAR levels suggest that these fires may have been surface fires that produced little charcoal (Fig. 6). The steady increase in CHAR after 8500 cal yr BP coincides with an increase in the terrestrial pollen accumulation rate (Fig. 5 and 6), possibly indicating more woody biomass burned with a transition towards a more closed forest.
During the mid- to late Holocene (6000 cal yr BP–present), summer insolation steadily declined towards present-day and winter insolation increased, resulting in cooler summers and warmer wetter winters than before (Berger, Reference Berger1978; Alder and Hostetler, Reference Alder and Hostetler2015). Additionally, weakening of the subtropical high-pressure system in the mid-Holocene reduced summer drought in the region (Thompson et al., Reference Thompson, Whitlock, Bartlein, Harrison and Spaulding1993; Bartlein et al., Reference Bartlein, Anderson, Anderson, Edwards, Mock, Thompson, Webb, Webb and Whitlock1998; Alder and Hostetler, Reference Alder and Hostetler2015). The vegetation at Twin Lakes shows a decrease in xerophytic taxa (most notably Artemisia and Poaceae), and an increase in conifers (including temperate diploxylon-type Pinus and mesophytic Picea) beginning at 6000 cal yr BP, suggesting the development of a closed mixed-coniferous forest with P. contorta and/or P. ponderosa, Pseudotsuga and/or Larix, A. grandis, and Picea (Fig. 5). High CHAR and fire episode frequency indicate that fires were important during this transition to a closed mixed-coniferous forest (Fig. 6).
Between 5000 and 3000 cal yr BP, summer insolation continued to decline (Berger, Reference Berger1978), and the increased abundance of Picea, Abies, haploxylon-type Pinus, and high AP:NAP values at Twin Lakes suggest the ongoing development of mesophytic closed forests, possibly as a result of wetter, cooler conditions (Fig. 5). Wetter conditions at this time are supported by a change in sediment lithology back to fine-detritus gyttja at ~4950 cal yr BP (Fig. 3), decreases in Cyperaceae pollen, and increases in aquatic taxa pollen (e.g., Potomogeton, Isoetes, and Sagittaria) that all suggest water levels rose during this time.
Fire episode frequency at Twin Lakes increased significantly during the late Holocene, while CHAR decreased from its peak at 6000–5000 cal yr BP and then remained relatively constant (Fig. 6). The increase in fire episode frequency while CHAR decreased could be the result of an increase in fine fuels and low-severity fires, consistent with the establishment of a mixed-coniferous forest. Increased percentages of Poaceae, Alnus, and herbaceous taxa at ca. 2800 cal yr BP further indicate a shift to more open forests with fine and/or woody fuels that would support a mixed-severity fire regime. Fire episode frequency reached its maximum at ~2000 cal yr BP (9 episodes 1000 yr–1), although CHAR remained unchanged from the previous period. The increase in fire frequency as CHAR remained constant suggests low-severity fires increased during this time period. Overall, the pollen and charcoal data from Twin Lakes portray a late Holocene dynamic whereby a heterogeneous forest structure containing both xerophytic and mesophytic species was maintained by a combination of low- and high-severity fires.
Regional Vegetation and Fire Comparison
Late glacial
Similar to Twin Lakes, sites from eastern Washington to northern Montana exhibited widespread shrubland and open parkland dominated by Artemisia, Poaceae, and haploxylon-type Pinus during the late-glacial period (Fig. 7). Records from Foy Lake and Pintler Lake in the NRM indicate early parkland vegetation supported Picea prior to 12,500 and 14,000 cal yr BP, respectively (Fig. 8), and Twin Lakes, Johns Lake, and Sheep Mountain Bog featured open vegetation of Cupressaceae (attributed to J. communis) and Pinus (Fig. 8). Only the highest elevation site, Lost Trail Pass Bog in the Bitterroot Mountains, records a treeless environment that suggests the tree line was lower prior to ~13,500 cal yr BP.

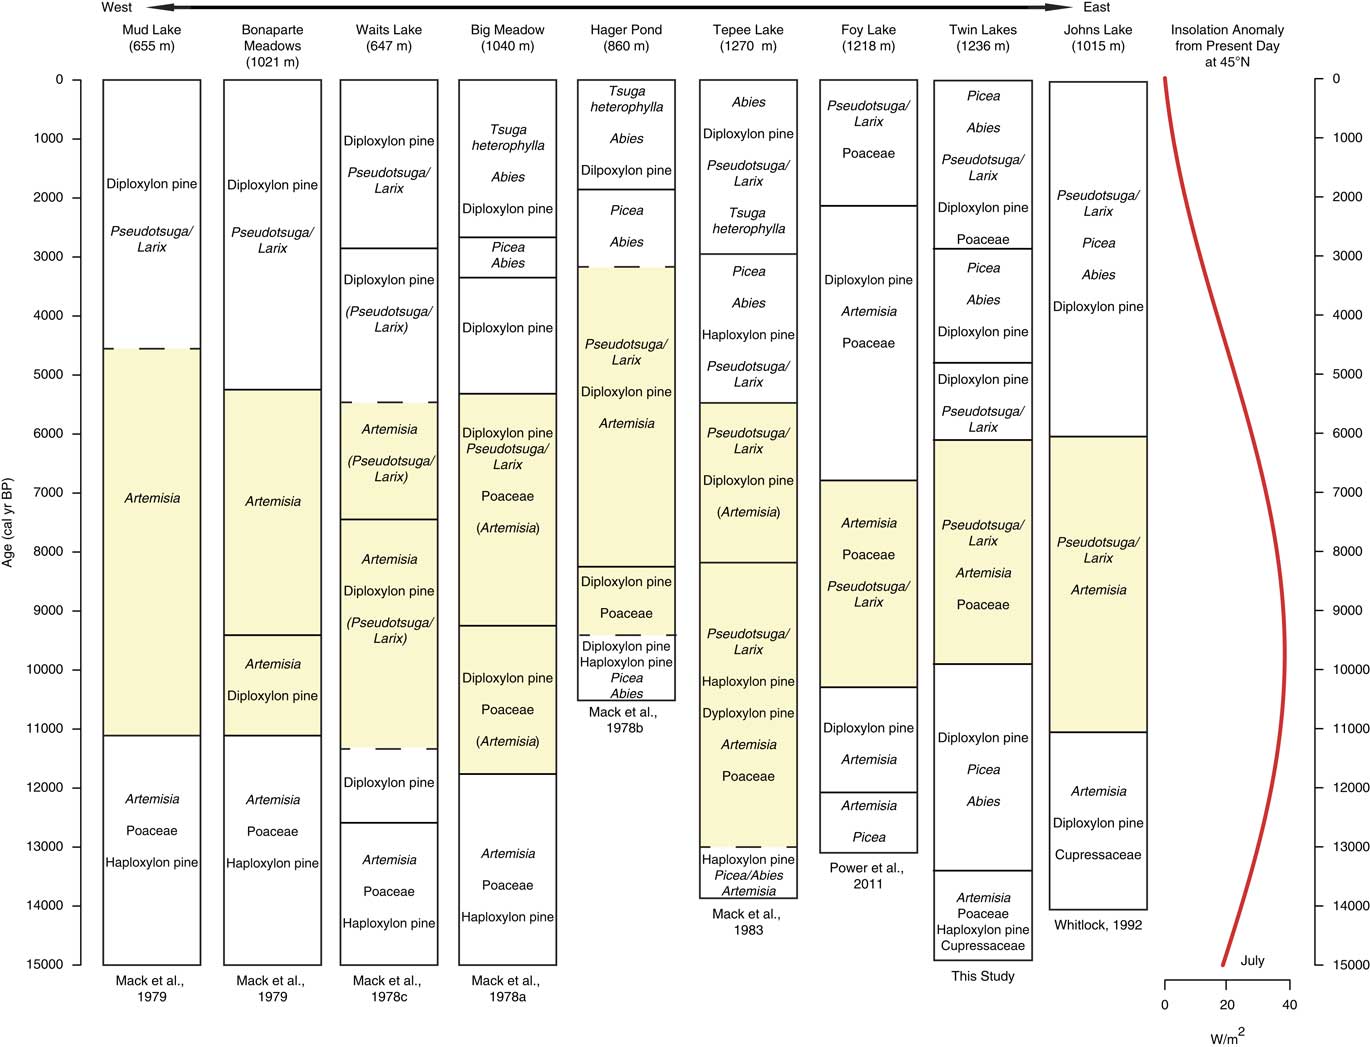
Figure 7 Pollen assemblages from sites located on a west-east transect from Okanogan region in eastern Washington to northwestern Montana. Yellow shading marks the most xerophytic assemblage of the record. Dashed lines denote vegetation changes in which timing of change was uncertain due to low-quality radiocarbon ages. Taxa in parentheses were not dominant, but their presence on the landscape is worth noting for comparisons. Insolation anomaly data provided by P.J. Bartlein (University of Oregon), based on Berger (Reference Berger1978). (For interpretation of the references to color in this figure legend, the reader is referred to the web version of this article.)
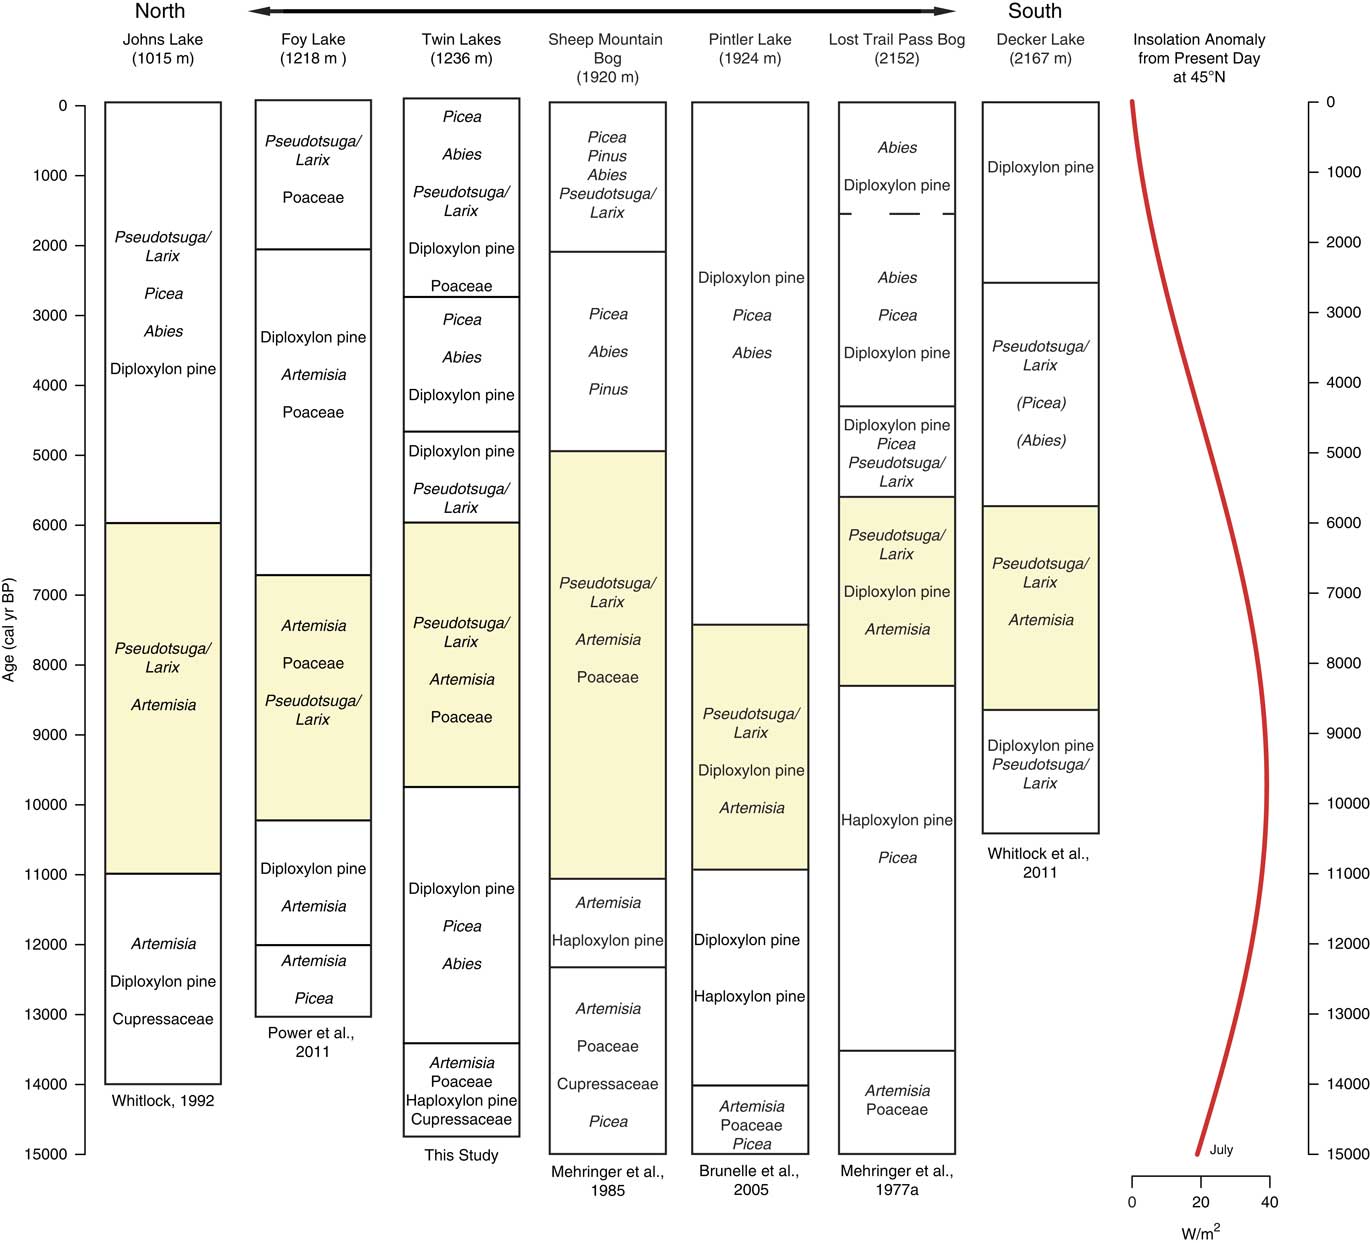
Figure 8 Pollen assemblages from records along a north-south transect from Glacier National Park in northwestern Montana to the Sawtooth Range in Central Idaho. Yellow shading represents the most xerophytic assemblage of the record. Dashed lines denote vegetation changes in which timing of change was uncertain due to low-quality radiocarbon ages. Insolation anomaly data provided by P.J. Bartlein (University of Oregon), based on Berger (Reference Berger1978). (For interpretation of the references to color in this figure legend, the reader is referred to the web version of this article.)
The late glacial pollen records are consistent with a climate that was overall cooler than present, but relative moisture levels are less clear (Alder and Hostetler, Reference Alder and Hostetler2015). In the Okanogan region, the presence of Typha and haploxylon-type Pinus pollen was considered evidence of wetter-than-present conditions (Mack et al., Reference Mack, Rutter, Valastro and Bryant1978c). High levels of Picea and Abies at Foy Lake in the NRM also suggest higher moisture levels prior to ~11,000 cal yr BP (Power et al, Reference Power, Whitlock and Bartlein2011). In contrast, Twin Lakes, Sheep Mountain Bog, and Johns Lake feature xerophytic taxa (Juniperus and Artemisia) along with Pinus and Picea before ~13,000 cal yr BP, implying relatively dry conditions (Mehringer et al., Reference Mehringer1985; Whitlock, Reference Whitlock1992). The variation in effective moisture levels among sites may in fact reflect a combination of factors, including proximity to refugial populations, the timing of soil development, and local climatic conditions influenced by topography and ice position. Power et al. (Reference Power, Whitlock and Bartlein2011), for example, proposes that sites closer to alpine glaciers (Johns Lake) experienced drier conditions as a result of local katabatic winds. By 13,000 cal yr BP, local climate factors may have become less important as evidenced by the convergence of regional vegetation trends. Increased pollen percentages of Picea, Pinus, and Abies at most sites indicate a shift from parkland to forest likely in response to rising temperatures and possibly greater effective moisture.
The four high-resolution charcoal records that span the late-glacial period (Pintler, Burnt Knob, Baker, and Twin lakes) show low fire episode frequency prior to ca. 13,000 cal yr BP, likely related to sparse fuels and relatively cold conditions (Fig. 9). These sites all show an increase in fire episode frequency with forest establishment at ~13,000 calyrBP. Although the pollen data suggest little vegetation change during the Younger Dryas chronozone (YDC; 12,900–11,500 calyrBP; Alley et al., Reference Alley, Marotzke, Nordhaus, Overpeck, Peteet, Pielke and Pierrehumbert2002), three sites (Twin Lake, Baker Lake, Pintler Lake) record a decrease in fire episodes at this time, and there is a decrease in regional CHAR, possibly reflecting a return to cold conditions. Charcoal records from a network of sites across the western US, however, do not show a consistent trend in fire activity during the YDC (Marlon et al., Reference Marlon, Bartlein, Walsh, Harrison, Brown, Edwards and Higuera2009).

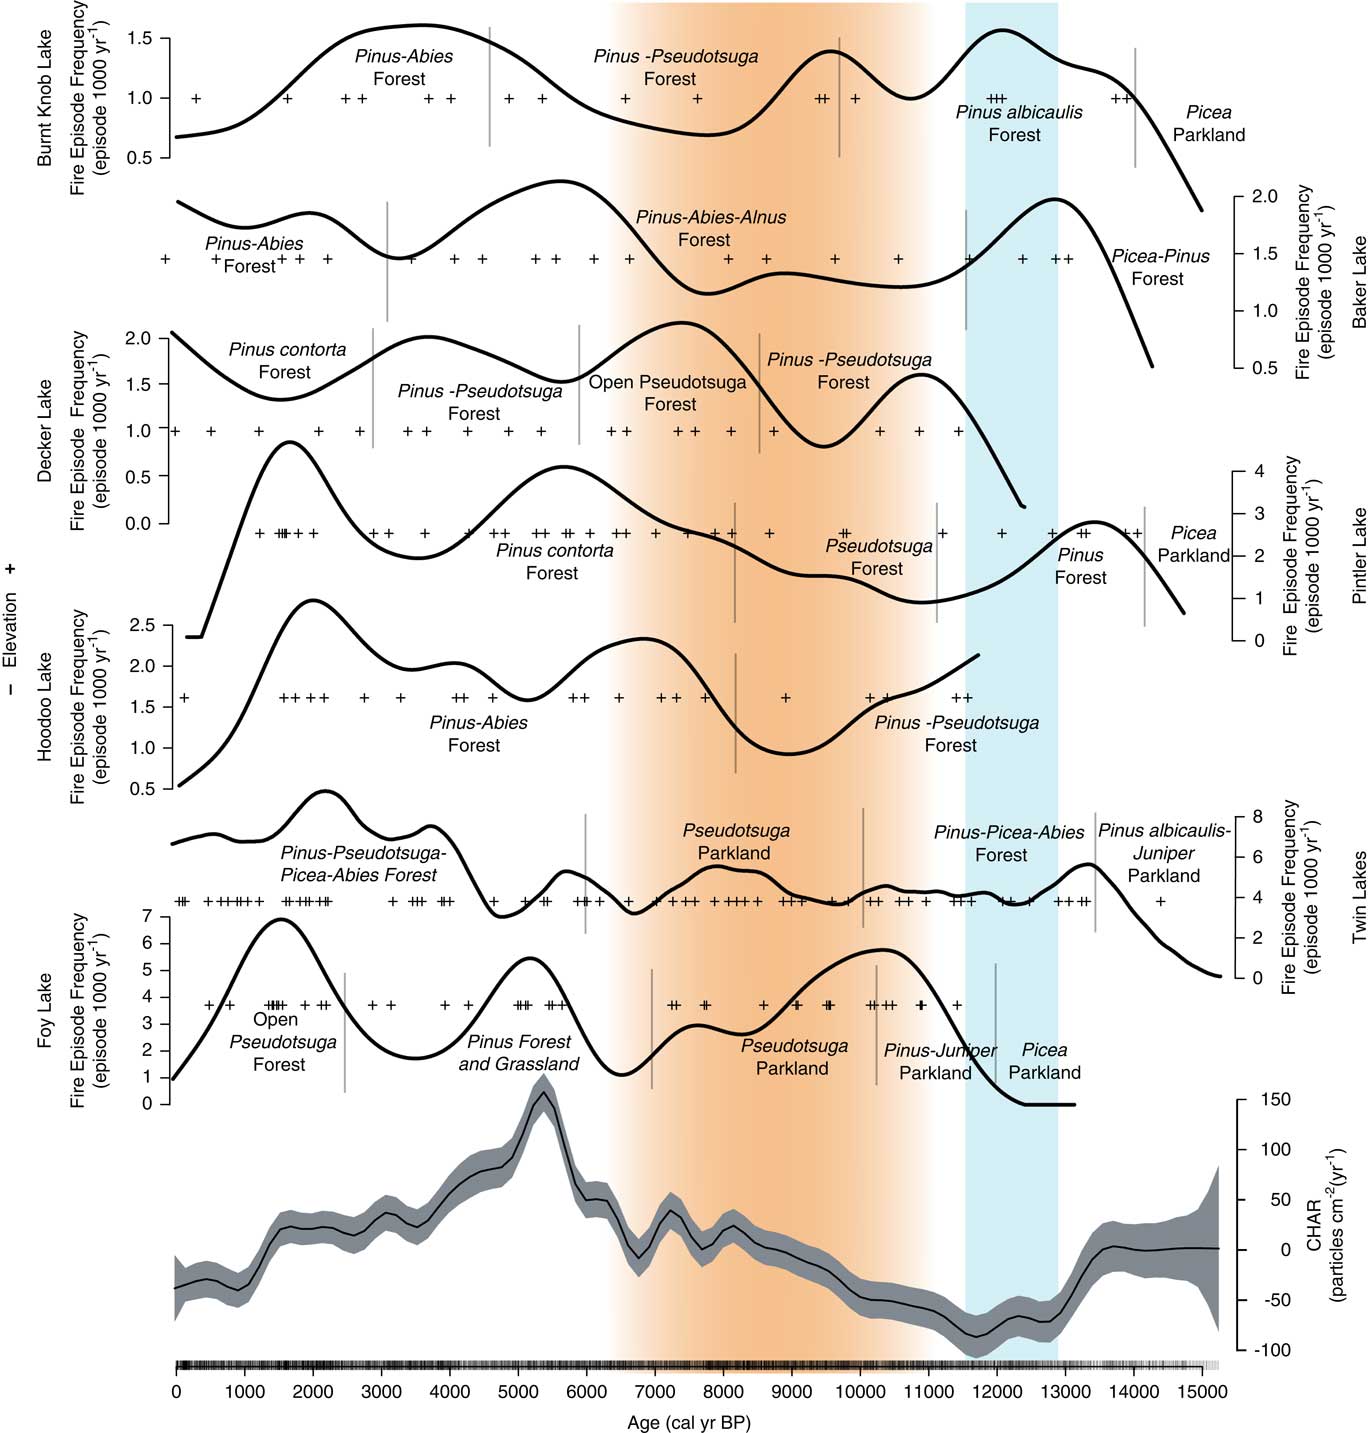
Figure 9 Composite CHAR (from seven sites in the Northern Rocky Mountains), and the fire episode frequency per 1000 years for all sites (+’s indicate fire episodes). (Generalized Additive Model (GAM) equation: CHAR(i)=s (timei)+sites+ε(i), with s (time)=smoothed function of time; sites=intercept for each site; ε=error~N(µ,∂). 29.2% deviance was explained). Orange shading indicates the summer insolation maximum when conditions were warmer and drier than before or after. Blue shading indicates the Younger Dryas chronozone (12,900–11,500 cal yr BP; Alley et al., 2000). (For interpretation of the references to color in this figure legend, the reader is referred to the web version of this article.)
Early Holocene
During the warmer and drier conditions of the early Holocene, regional pollen records show similar trends to those evident at Twin Lakes; all indicate an expansion of Artemisia, Pseudotsuga and/or Larix and/or diploxylon-type Pinus. In eastern Washington, pollen records from Mud Lake and Bonaparte Meadows indicate an increase in Artemisia at the expense of conifers (Mack et al., Reference Mack, Rutter and Valastro1979) and, moving east, Waits Lake, Big Meadow, Hager Pond, and Tepee Lake have increases in Artemisia, Poaceae, diploxylon-type Pinus, and Pseudotsuga and/or Larix (Fig. 7). It is difficult to distinguish if the diploxylon-type pollen in those records was from long-distant transport over open steppe vegetation or if they were present at low elevations. If the trees were locally present, they were likely drought-tolerant P. ponderosa in an open forest (Mack et al., Reference Mack, Rutter, Bryant and Valastro1978a; Reference Mack, Rutter, Bryant and Valastro1978b; Reference Mack, Rutter, Valastro and Bryant1978c). Pseudotsuga and/or Larix and Artemisia were abundant at all the other sites in Montana and Idaho (Fig. 7 and 8).
The majority of the NRM sites record an increase in xerophytic taxa at the onset of warm, dry conditions in the early Holocene, including the three sites closest to Twin Lakes (Foy Lake, Johns Lake, and Sheep Mountain Bog; Fig. 8). The vegetation changes, however, were not synchronous. At Twin Lakes, xerophytic parkland developed ~1000 yr later than other sites at 10,000 cal yr BP, two NRM sites (Lost Trail Pass Bog and Decker Lake) did not experience vegetation changes until 9000–8000 cal yr BP, and Rock Lake at middle elevations in the northern Mission Range (1888 m asl, not shown) did not record any discernible vegetation change (Gerloff et al., Reference Gerloff, Hills and Osborn1995). The variable timing of the onset of warm and dry conditions may be related to site differences in elevation, topography, and/or edaphic factors. Lost Trail Pass Bog, Rock Lake, and Decker Lake all show less-pronounced and/or delayed increases in warm-temperature vegetation, likely because they are located at higher elevations (>1800 m asl).
The deposition of Mazama Ash at 7633 ± 49 cal yr BP (Egan et al., Reference Egan, Staff and Blackford2015), may have favored Artemisia and herbaceous growth and conifer mortality in the region, as evidenced by pollen records from Twin Lakes and nearby sites (Sheep Mountain Bog, Lost Trail Pass Bog, Hager Pond, Tepee Lake, Foy Lake, and Burnt Knob Lake; Zobel and Antos, Reference Zobel and Antos1985; Brunelle and Whitlock, Reference Brunelle and Whitlock2003). At these sites, expansion of Artemisia following the deposition of the ash may have been the result of a mulching effect that enabled rapid recovery of shrubs (Mehringer et al., Reference Mehringer, Blinman and Petersen1977b). Pre-Mazama arboreal percentages were registered at all sites within 100–200 yr of the ash deposition, suggesting that the effects of the eruption were short-lived and forest recovery was relatively rapid.
Three sites register increases in fire episode frequency during the early Holocene (Foy Lake, Burnt Knob Lake, and Decker Lake), although overall regional CHAR levels were low (Fig. 9). Foy Lake was surrounded by Pseudotsuga parkland and probably supported a low-severity fire regime similar to that at Twin Lakes. Burnt Knob Lake was surrounded by P. albicaulis-Abies forest (Brunelle et al., Reference Brunelle, Whitlock, Bartlein and Kipfmueller2005), and the increase in fire episode frequency likely reflects more high-severity, stand-replacing fires, and, when a transition to a Pseudotsuga forest occurred (ca. 9200 cal yr BP), fire episode frequency decreased. An increase in fire episode frequency at Decker Lake at 9500–7500 cal yr BP occurred during a transition from P. contorta and Pseudotsuga forest to Pseudotsuga parkland (Whitlock et al., Reference Whitlock, Briles, Fernandez and Gage2011). Here, warm conditions and associated increased fire frequency likely facilitated the transition to a more open, patchy forested landscape.
Mid- to late Holocene
Across the region, cooler and wetter conditions during the mid-Holocene led to an elevational lowering of the forest-steppe boundary, as seen by the increase in Pinus, Picea, and Abies and decrease of Artemisia and Poaceae (Fig. 7 and 8). The development of closed forests at all but two sites (Foy Lake and Hager Pond) after 6000 and 5000 cal yr BP is consistent with cooler and wetter conditions than before. The early Holocene parkland at Foy Lake was replaced by a pine forest at 7000 cal yr BP, ~1000 yr earlier than shifts noted at other sites, and Hager Pond registered open vegetation until ~3000 cal yr BP, although this site was poorly dated (Fig. 7). A lake-level analysis of Foy Lake suggests lake shallowing at 5000 cal yr BP and deepening at ~3000 cal yr BP (Shuman et al., Reference Shuman, Henderson, Colman, Stone, Fritz, Stevens, Power and Whitlock2009), which is in contrast to the deepening of Twin Lakes at ca. 4950 cal yr BP. Along with Twin Lakes, four of the sites (Big Meadow, Hager Pond, Tepee Lake, and Sheep Mountain Bog) record distinct increases in the cool/wet-associated taxa Picea and Abies at times between ~5000 and ~2000 cal yr BP (Fig. 7 and 8). An increase in mesophytic taxa at these sites broadly coincides with glacial readvances in British Columbia (Menounos et al., Reference Menounos, Osborn, Clague and Luckman2008) suggesting that mid- to late Holocene cooling drove vegetation changes.
Regional CHAR peaked at ~5000 cal yr BP, likely a result of high levels of available woody biomass. In the late Holocene, however, differences in fire activity between lower and higher elevation sites were evident. Lower elevation sites (<2000 m asl) show a distinct peak in fire episode frequency at ~2000 cal yr BP and a slight decrease to present-day (Twin Lakes, Pintler Lake, Hoodoo Lake, and Foy Lake), whereas higher elevation sites (>2000 m asl) do not register a distinct peak at ~2000 cal yr BP (Baker Lake, Burnt Knob Lake, and Decker Lake; Fig. 9). The higher elevation lakes still register high fire episode frequency during the late Holocene, although the timing of the highest fire episode frequency was most consistent for lower elevation sites (Fig. 6 and 9), and did not correspond with regional increases in CHAR (Fig. 9).
The increase in fire episode frequency during the late Holocene when overall climate was cooling (Marsick et al., 2018) could be explained by an increase in climate variability. The differences in the timing of high fire episode frequency likely reflect subregional variations in late Holocene climate and site difference in fuels and topography. Diatom and isotopic data at Foy Lake show evidence of more frequent oscillations between multi-decadal dry and wet periods during the late Holocene (Stevens et al., Reference Stevens, Stone, Campbell and Fritz2006; Stone and Fritz, Reference Stone and Fritz2006). Late Holocene climate variability may also explain the increase in fire episode frequency at the lower elevation sites. Wet-dry oscillations would have facilitated increases in fine-fuel biomass during wet periods and fuel drying and desiccation during dry periods, leading to conditions where fires, when they did occur, had ample fuels to burn (Heyerdahl et al., Reference Heyerdahl, Morgan and Riser2008; Whitlock et al., Reference Whitlock, Briles, Fernandez and Gage2011).
It is also possible that human activity may have helped maintain a mixed-severity fire regime during the late Holocene when climate records suggest conditions were generally cooler and wetter. While we cannot distinguish anthropogenic versus natural fire activity based solely on the charcoal record, studies of number of radiocarbon dates from archeological sites suggest Native American populations were increasing in western Montana during the late Holocene (Gajewski et al., Reference Gajewsky, Munoz, Peros, Viau, Morian and Betts2011). These data are consistent with model results that suggest that human populations in the NRM increased from 0.1 person km–2 prior to 3000 cal yr BP to nearly 1 person km–2 after 2000 cal yr BP (Chaput et al., Reference Chaput, Kriesche, Betts, Martindale, Kulik, Schmidt and Gajewski2015; Peros et al., Reference Peros, Munoz, Gajewski and Viau2010). The timing of these population increases corresponds with the time of increased fire episode frequency at low and middle elevation sites. The CSKT historically used fire for a number of purposes: as a means of communication, to aid in hunting, to promote the growth of valuable plant resources, and to facilitate travel (Barrett and Arno, Reference Barrett and Arno1999; Boyd, Reference Boyd1999; Lake et al., Reference Lake, Wright, Morgan, McFadzen, McWethy and Stevens-Rumann2017). The seemingly anomalous rise in fire activity at Twin Lakes despite cool wet conditions in the Late Holocene has been observed at other sites in Washington, Oregon, and British Columbia and attributed to a combination of increased climate variability and anthropogenic fires (Walsh et al., Reference Walsh, Marlon, Goring, Brown and Gavin2015).
CONCLUSIONS
The paleoenvironmental reconstruction at Twin Lakes and other sites in the region highlights important shifts in past vegetation and fire activity mainly in response to millennial-scale climate variability. Following deglaciation, open shrubland and parkland vegetation were widespread, and sparse fuels and cold conditions limited fire activity. Closed forest developed after ~13,500 cal yr BP, likely as a result of increasing temperature and moisture driven by higher insolation and the northward shift in storm tracks. Elevated fuel biomass in this period likely contributed to the observed increase in fire activity across the region. From ~11,000 to ~6000 cal yr BP, closed forests dominated by Picea, Abies, and Pinus were replaced by open forests or parklands of Pseudotsuga (as well as open P. ponderosa parklands in certain locales) at low and middle elevations in Montana and Idaho, and shrub-steppe in the drier eastern Washington region. This vegetation shift occurred as a result of the onset of warmer, drier summers during the early Holocene summer insolation maximum. Twin Lakes showed a decrease in CHAR and slightly higher fire episode frequency at this time. Although this pattern was not seen at all sites, regional CHAR was low during the early Holocene, likely reflecting a reduction in biomass burned due to lower fuel biomass at that time.
Conditions during the late Holocene were cooler and wetter than the early and mid-Holocene, which led to the establishment of present-day closed forests after 6000 cal yr BP. At Twin Lakes, an increase in fires accompanied this vegetation change, and increased to a maximum at 2000 cal yr BP—an increase that was also recorded at other low- and middle-elevation sites. The presence of mixed-conifer forest taxa (primarily Pseudotsuga and /or Larix, P. contorta and/or P. ponderosa, Abies, and Picea) in the last 6000 years suggests mid-elevation forests in the Mission Range supported both low- and high-severity fires. Despite significantly cooler and wetter conditions than before, high fire occurrence suggests that short-term climatic variability and possibly deliberate burning by indigenous peoples fostered a combination of fire severities.
Since the 1940s, a reduction in fires in the low and middle elevations of the Mission Range has resulted in an increase of both dead and living ladder fuels and created denser forests dominated by Pseudotsuga at the expense of P. ponderosa (Swaney, Reference Swaney2005; CSKT, 2006). This shift has reduced the possibility of low-severity fires and increased the likelihood of severe stand-replacement fires (Arno et al., Reference Arno, Parsons and Keane2000; Westerling et al., Reference Westerling, Hidalgo, Cayan and Swetnam2006). One such high-severity fire occurred in the Mission Range during the anomalously dry and warm summer of 2003 (CSKT, 2006). The increase in fuels coupled with projections of rising temperatures, increased drought, and a longer fire season in the future (Alder and Hostetler, Reference Alder and Hostetler2013) will likely result in future fire and climate conditions that exceed those experienced during the late Holocene. As such, the balance of processes that have maintained these diverse forests for millennia is at risk. Restoring surface fires through prescribed burns and other fuel treatments in mixed-coniferous forests similar to those found today at Twin Lakes may help recreate an open forest structure typical of forests prior to mid-twentieth century fire suppression. It may also help mitigate the chance of severe crown fires in low- and middle-elevation forests where such fires have been infrequent for millennia.
Table 2 Data for regional sites in the study. *, sites that were used in the regional charcoal comparison; **, sites that were used in the charcoal comparison but not the vegetation comparison.

ACKNOWLEDGMENTS
This project was supported by grants from the National Science Foundation (GSS BCS-1539820, EPS-1101342, and OISE 0966472) and USDA National Institute of Food and Agriculture (NIFA; 2013-38424-20992). Valued support was provided by the Confederated Salish and Kootenai Tribes, specifically Rich Jansen of the Department of Natural Resources and Jim Durglo of CSKT Tribal Forestry, which allowed us to conduct this research on tribal lands. The Salish Cultural Committee and Salish Kootenai College provided additional support. J. Benes, M. Weingart, P. Bodalski, and C. Shama helped in the field and laboratory; L. Stahle, V. Iglesias, G. Pederson, E. Heyerdahl, and N. Fox provided valuable technical support.