


NOMENCLATURE
- α
absolute flow angle /⁰
- β
relative flow angle /⁰
- η tt
total-total isentropic efficiency
- ρ
density /kg/m3
- ACARE
advisory council for aeronautics research in Europe
- CFD
computational fluid dynamics
- C ske
coefficient of secondary kinetic energy
- Cx
axial velocity /m/s
- h
specific enthalpy /J/kg
- HP
high pressure
- IP
intermediate pressure
- k
turbulent kinetic energy
- LP
low pressure
- NGV
nozzle guide vane
- P
pressure /Pa
- SST
shear stress transport
- T
temperature /K
- U
wheel speed /m/s)
- V
absolute velocity /m/s)
- ω
specific dissipation rate
- w
specific work /J/kg
- W
relative flow velocity /m/s)
- X0, X1, X2, X3, X4
traverse positions (see Fig. 2)
- y +
near wall reynolds number
- 0
stagnation
- 2
rotor entrance
- 3
rotor exit
- is
isentropic
- m
mass averaged value
- r
radial
- sec
secondary flow component
Subscripts
1.0 INTRODUCTION
Loss mitigation in turbomachinery has become increasingly important as the drive to achieve the ACARE emissions goals has increased(1,Reference Cumpsty2) . Non-axisymmetric endwalls have been successfully applied to a number of test and commercial turbines such as the Trent 500(Reference Brennan, Harvey, Rose, Fomison and Taylor3-Reference Harvey, Brennan, Newman and Rose5) and the Trent 900(Reference Gonzalez and Lantero6) high and intermediate pressure stages. The endwalls are designed to control or mitigate secondary flows which are generated when the inlet flow, which includes an endwall boundary layer, is deflected through the blade passage. Endwall secondary flows may be responsible for up to a third of the losses in a turbine row, depending on turbine specific factors such as aspect ratio and tip clearance(Reference Denton7). Secondary flows are described in more detail by many authors in the field, for example(Reference Langston8-Reference Wang, Olson, Goldstein and Eckert10), however, one common misconception is the number of rotations of the vortical structure depicted schematically. In the accelerating flows associated with turbines, the energy addition resulting from this acceleration serves to stretch the vortices, resulting in only a few rotations as they pass through the turbine passage as is depicted in Fig. 1.
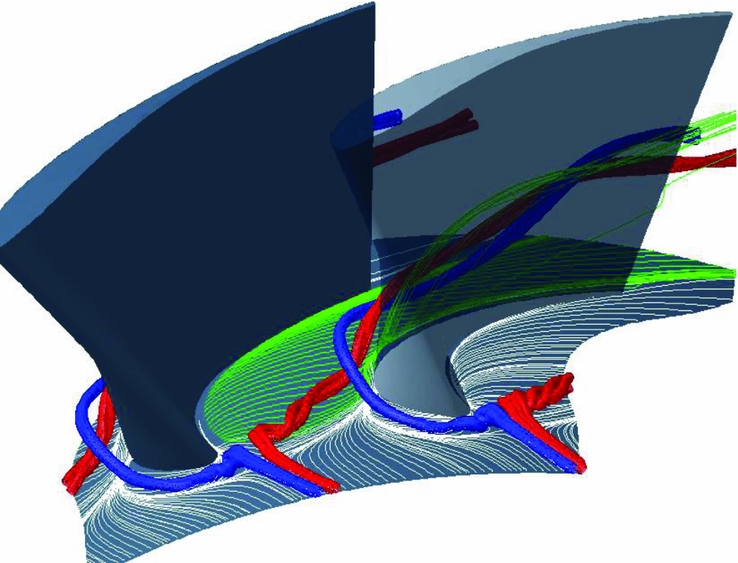
Figure 1. Schematic of turbine secondary flows.
In Fig. 1, coloured stream tubes are used to indicate the suction side leg of the horseshoe vortex (blue) which remains close to the suction surface, held there by the pressure gradient from the pressure side to the suction side, and the pressure side leg of the horseshoe vortex (red). The pressure side leg of the horseshoe vortex is driven across the passage by the pressure gradient in the same direction as the endwall cross-flow (green streamlines). The pressure side leg of the horseshoe vortex is then observed to collide and merge with or wrap around the suction side leg of the horseshoe vortex and climb the suction surface, growing in physical size with the further combination of the passage cross-flow. The passage vortex results from low momentum flow on the blade and endwall boundary layer being driven across the passage by the pressure difference between pressure and suction surfaces of adjacent blades. Further pairs of vortices have been observed at the blade root, but are absent in Fig. 1, known as corner vortices(Reference Wang, Olson, Goldstein and Eckert10).
In subsonic flow, the basic contoured endwall design is aimed at reducing the endwall passage cross-flow by affecting the pressure gradient locally. The design consists of a “hill” which reduces the local passage area in an attempt to accelerate the flow and hence decrease the pressure against the pressure surface of the blade in the endwall region. Similarly, a “valley” strategically placed close to the suction surface decreases the velocity resulting in an increase in the local static pressure. Essentially the contour makes the blades aft loaded in the vicinity of the contoured endwalls. The latter is what best describes the research presented by various authors from Carleton University and Pratt and Whitney(Reference Mahallati, McAuliffe, Sjolander and Praisner11-Reference Knezevici, Sjolander, Praisner, Allen-Bradley and Grover16) who, using cascade tests and CFD, have studied a series of increasingly loaded blade profiles together with endwall contouring. This has been in an effort to exploit the inherently low mid-span loss of forward-loaded blades profiles in low-pressure turbines while exploiting non-axisymmetric endwall technology on the hubs to mitigate the associated increased secondary flows resulting from forward loading the profile. In 2007, Zoric et al(Reference Zoric, Popovic, Sjolander, Praisner and Grover13) presented results for the relatively lightly loaded PAK-B cascade as well as the highly loaded aft- and forward-loaded PAK-D designs at three incidences. It was noted that the strength of the passage vortex increased with increased loading and there was good performance of the forward-loaded PAK-D cascade across the incidence range while the aft loaded design stalled at positive incidence. This work, however, did not include the effect of profiled endwalls at off-design incidence.
Two studies that document the effect of profiled endwalls at off design incidence are Rose et al(Reference Rose, Harvey, Seaman, Newman and McManus4) and Harvey et al(Reference Harvey, Brennan, Newman and Rose5), on model Trent engine test rigs. These authors found conflicting trends for their HP and IP designs. Despite using the same endwall optimisation approach and achieving the expected stage efficiency improvements at design, the HP turbine stage efficiency results showed the profiling to have the greatest effect at the highest loading and virtually no effect at the lightly loaded case, while the complete opposite is reported of the IP turbine. In both cases, the endwall profiling was observed to restrict the secondary losses to closer to the endwall and therefore to deteriorate the total pressure profile at the exit to the turbine but without significantly impacting on the efficiency of the downstream row. Furthermore, they noted in the latter paper(Reference Harvey, Brennan, Newman and Rose5) that it might be interesting to use an off-design component during optimisation, something that seems more broadly accepted in the compressor community where profiled endwalls are being investigated of late and have been shown to delay the onset of corner stall(Reference Reising and Schiffer17). Schobeiri et al(Reference Schobeiri, Lu and Rezasoltani18) performed experimental and numerical investigations into the effect of endwall contouring on film cooling at the design point and off-design. However, the investigation was aimed more at understanding the influence of the film cooling. More recently, the drive has been more to understand how the presence of the endwall contours affects the heat transfer characteristics(Reference Lynch and Thole19) and unsteadiness in the blade row(Reference Tang, Liu, Luo and Hou20).
The objectives of this paper are threefold:
1. To present the results of a detailed experimental and numerical study of the effectiveness, at both on- and off-design speeds, of introducing a non-axisymmetric endwall contour onto the hub of a rotating, model turbine.
2. To discuss these results in the light of those from the few similar studies(Reference Rose, Harvey, Seaman, Newman and McManus4,Reference Harvey, Brennan, Newman and Rose5) available in the literature.
3. To compare the results from the rotating rig to those of earlier cascade testing which has a shared heritage in the blading and the endwall design, to show the value of cascade testing.
2.0 EXPERIMENTAL SET UP
Figure 2 indicates the general schematic of the 1½ stage test rig used for this work. A more complete description of both the test rig, and of the blading can be found in Reference Snedden, Roos, Dunn and Gregory-SmithRef. 21. In summary, the rotor blades were designed to have the Durham cascade profile(Reference Ingram22) at the rotor hub in order to utilise an endwall profile similar to one used in the Durham cascade. Figure 3 shows a picture of the manufactured blade. The full geometry can be found in Reference SneddenRef. 23.
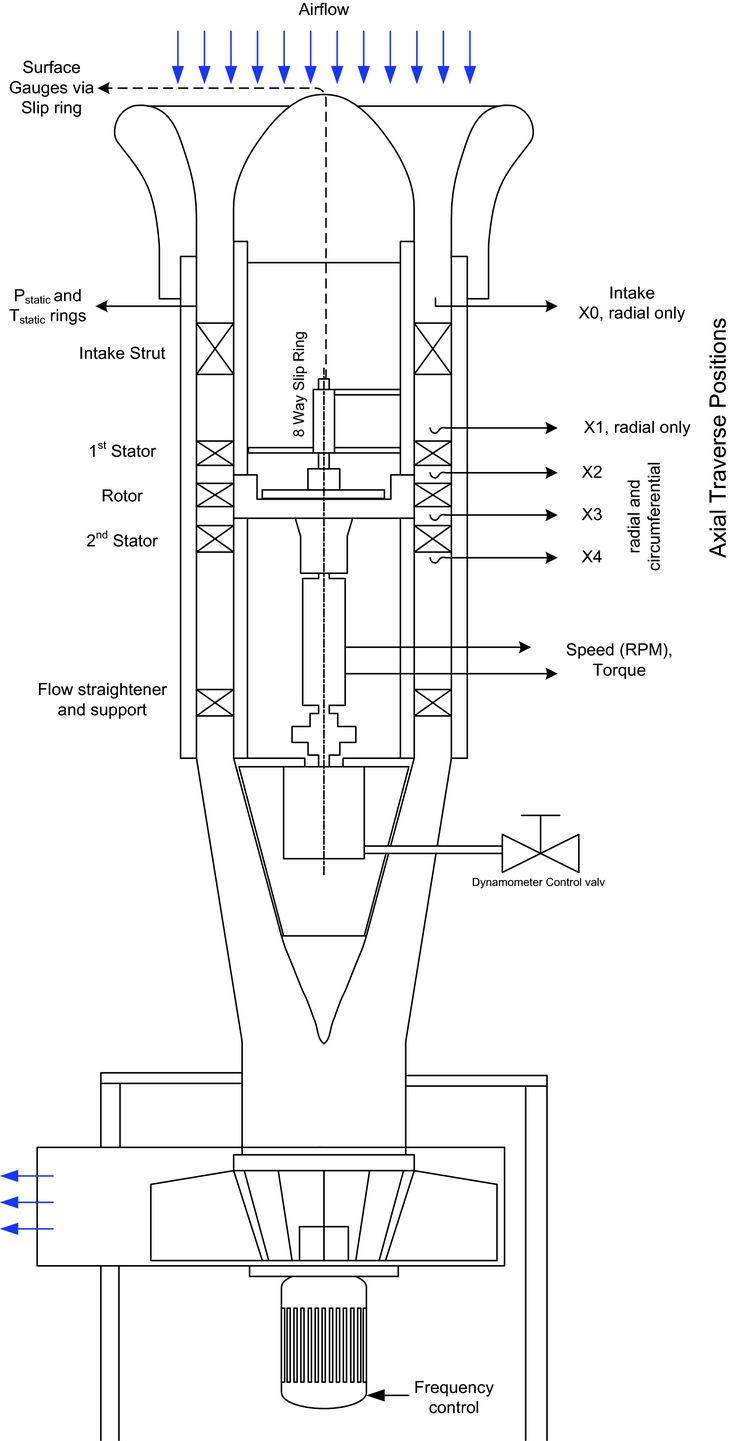
Figure 2. Schematic of 1½ stage turbine showing control and measurement instrumentation.
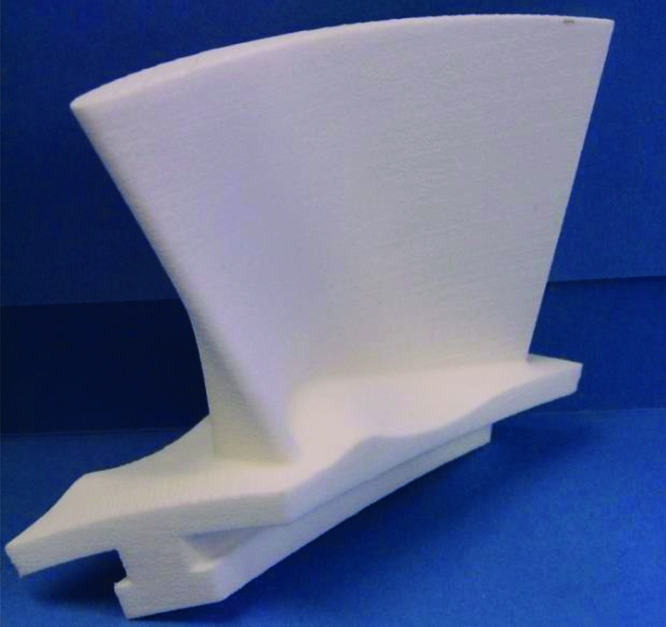
Figure 3. Direct laser sintered rotor blade with endwall contouring.
The rotor tip gap is relatively large at 1.7% of span, while that for the stators is 0.8% of span. Fillet radii of 1 mm are used at the junction between blade and endwall.
The hub Reynolds number, based on axial chord at the rotor exit, is approximately 127 500 compared to the Durham cascade at a Reynolds number of 400 000.
Blade numbers were selected to ensure direct comparison to unsteady CFD predictions without geometrical scaling as part of work by Dunn(Reference Dunn24) (although the CFD simulation presented here is steady), and to restrict the axial chord length to fit the test rig. The resulting blade numbers were 30 stators and 20 rotor blades.
The test rig allows for the independent control of the rotor wheel speed and the inlet mass flow or axial velocity. For the purposes of these tests, the inlet axial velocity was held constant at 21.38 m/s, while the wheel speed was set to 1907, 2300 or 2820 RPM to give approximately +17° incidence in the highly loaded case, 0° at design, and −25° incidence in the reduced loading case at the hub, respectively, see Fig. 4.
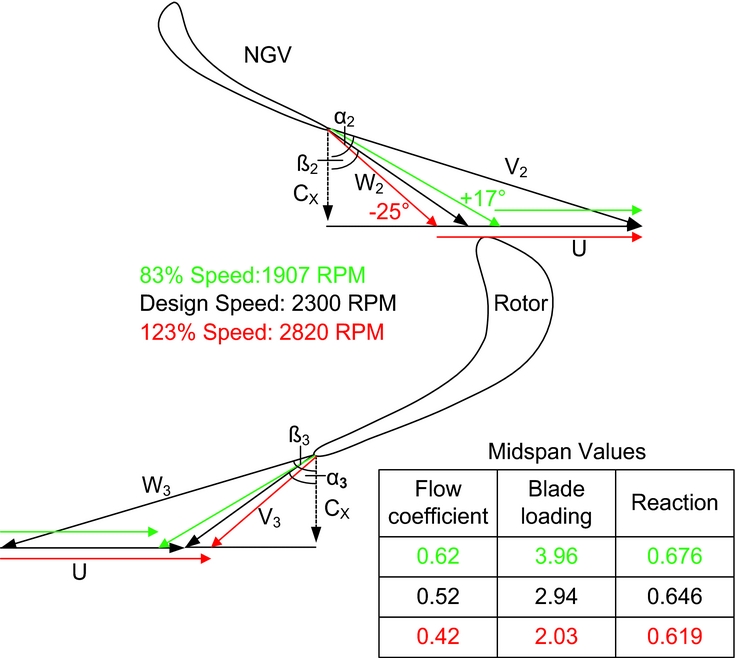
Figure 4. Flow triangles for on-and off-design operation.
Inlet turbulence intensity was measured to be less than 1%. Five-hole probe measurements followed the methodology of Ingram and Gregory-Smith(Reference Ingram and Gregory-Smith25). Unlike previous results(Reference Snedden, Dunn, Ingram and Gregory-Smith26,Reference Snedden, Dunn, Ingram and Gregory-Smith27) , the current investigation was performed with five pressure transducers for the 5-hole probe, as opposed to the four transducers as used previously. This additional transducer allows for a more accurate measurement of the static pressure in sheared flow. The discrepancy between CFD and experimentally derived isentropic efficiency levels seen in Reference Snedden, Dunn, Ingram and Gregory-SmithRefs. 26 and Reference Snedden, Dunn, Ingram and Gregory-Smith27 was also traced to the effects of an oil feed pump in the hydraulic dynamometer's supply system and a linear calibration versus turbine rotational speed has improved the correlation between measured and computed torque and hence efficiencies.
The experimental uncertainty in the stage isentropic efficiency has been determined stochastically(Reference Wild and Hockman28), using an experimental dataset as the basis, to be less than ±0.2% using the transducers described in Table 1. Should all the uncertainties work together in a worst-case scenario, then this result approaches ±0.6%. Three replications of results between complete rebuilds of the test rig have shown the stage isentropic efficiency to repeat to a level of less than ±0.45% while C ske does so to less than ±0.4%.
Table 1 Primary instrumentation
The cascade facility is that at Durham University and its set up is extensively covered by Hartland et al(Reference Hartland, Gregory-Smith, Harvey and Rose29) and Ingram(Reference Ingram22).
3.0 COMPUTATIONAL FLUID DYNAMICS
As with the previous studies(Reference Snedden, Dunn, Ingram and Gregory-Smith26,Reference Snedden, Dunn, Ingram and Gregory-Smith27) , the CFD code chosen for this work was the Numeca Fine™/TURBO v11.1(30) and the mesh was recreated to include a 1-mm fillet, as shown in, Fig. 5. This is to adhere to the recommendations of Germain et al(Reference Germain, Nagel, Raab, Schuepbach, Abhari and Rose31) and Schuepbach et al(Reference Schuepbach, Abhari, Rose, Germain, Raab and Gier32), a study which indicated the importance of modelling the fillets.
Figure 5. CFD mesh of the contoured rotor.
The mesh consisted of approximately 4.5 million cells, with 149 cells in the spanwise direction of the rotor and 65 in the azimuthal direction. The y +value is highest on the hub where it is lower than 0.5. The mesh size is far beyond that proven to yield mesh-independent results in Reference SneddenRef. 23 as a result of the desire to include the fillets and better resolve the tip gaps. Single stator and rotor passages were modelled by a steady-state flow simulation in which mixing planes with conservative coupling are located at the stator/rotor interfaces. Dunn(Reference Dunn24) found that the unsteady simulation did not contain any information that would alter the conclusions regarding the efficacy of the endwall. While there were unsteady interactions the annular and contoured cases showed similar oscillations about the time-averaged results.
The Spalart-Allmaras turbulence model was implemented in conjunction with the Abu-Ghannam and Shaw transition model(Reference Abu-Ghannam and Shaw33) applied on the blade surfaces. In an earlier study(Reference Dunn, Snedden and Von Backström34) it was found that k-ω SST turbulence model gave excellent results as did the Spalart-Allmaras model. However, the k-ω SST implementation in the Numeca Fine™/TURBO v11.1 does not support the use of the transition model, which is of importance at low Reynolds numbers as applicable to this case, and was found in both(Reference Snedden23) and(Reference Dunn, Snedden and Von Backström34) to exaggerate the spanwise movement and strength of the vortex system in the blade passage, while the accuracy of the Spalart-Allmaras model results was considered best for this particular case(Reference Dunn, Snedden and Von Backström34).
4.0 RESULTS
4.1 Rotating rig
Figure 6 compares three of the most common measures of stage and rotor performance relevant to this case. The Coefficient of Secondary Kinetic Energy (C ske) is adapted from Ingram(Reference Ingram22):
 $$\begin{equation}
{C_{{\rm{ske}}}} = \frac{{V_{{\rm{sec}}}^2 + V_r^2}}{{C_x^2}},
\end{equation}$$
$$\begin{equation}
{C_{{\rm{ske}}}} = \frac{{V_{{\rm{sec}}}^2 + V_r^2}}{{C_x^2}},
\end{equation}$$
 $$\begin{equation}
{V_{{\rm{sec}}}} = V \cdot \sin \left( {\alpha - {\alpha _m}} \right)
\end{equation}$$
$$\begin{equation}
{V_{{\rm{sec}}}} = V \cdot \sin \left( {\alpha - {\alpha _m}} \right)
\end{equation}$$
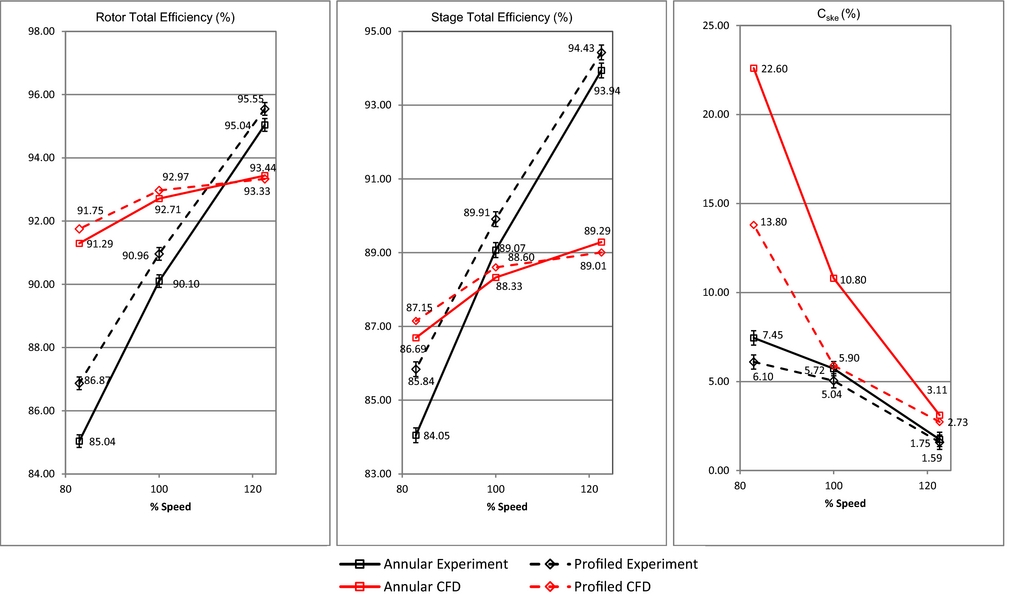
Figure 6. Rotor isentropic efficiency (X3), stage isentropic efficiency (X3) and coefficient of secondary kinetic energy (X3, 75% span average) comparisons.
This coefficient has proven to be an effective proxy for secondary kinetic energy and is extensively used as an objective function for endwall optimisation(Reference Brennan, Harvey, Rose, Fomison and Taylor3,Reference Hartland, Gregory-Smith, Harvey and Rose29,Reference Harvey, Rose, Shahpar, Taylor, Hartland and Gregory-Smith35) .
Isentropic efficiency has been calculated using torque measured and computed and the CFD data is extracted at identical points to those of the experiment. Making isentropic and incompressible assumptions for the low-speed turbine means that the turbine total isentropic efficiency can be expressed as:
 $$\begin{equation}
{\eta _{{\rm{tt}}}} = \frac{w}{{{h_{01}} - {h_{03}}}} = \frac{w}{{\left( {{h_{01}} - {h_{3{\rm{is}}}}} \right) - \frac{1}{2}V_{3{\rm{is}}}^2}} = \frac{w}{{\frac{{{P_{01}} - {P_{3{\rm{is}}}}}}{\rho } - \frac{1}{2}V_{3{\rm{is}}}^2}}
\end{equation}$$
$$\begin{equation}
{\eta _{{\rm{tt}}}} = \frac{w}{{{h_{01}} - {h_{03}}}} = \frac{w}{{\left( {{h_{01}} - {h_{3{\rm{is}}}}} \right) - \frac{1}{2}V_{3{\rm{is}}}^2}} = \frac{w}{{\frac{{{P_{01}} - {P_{3{\rm{is}}}}}}{\rho } - \frac{1}{2}V_{3{\rm{is}}}^2}}
\end{equation}$$
A similar statement for rotor isentropic efficiency is obtained by replacing P 01 with P 02.
Figure 6 shows that the endwall contouring has improved the isentropic efficiency with the largest improvement at part speed (both stage and rotor by 1.8%). Part speed corresponds to increased loading and turning in the rotor, which is the greatest driver of secondary flows in turbines and hence the correlation of increasing isentropic efficiency improvements to decreasing speed means that the method of non-axisymmetric endwall contouring is robust in that it is insensitive to off-design flow angles and in fact can produce greater gains in isentropic efficiency at speeds which the strength of loss generating flows are normally increased. The CFD predictions are more conservative and a cross-over point is reached at overspeed, where the secondary flows are weakest, however the trend still suggests increased benefit with increased blade loading or reduced speed. The benefits in rotor isentropic efficiency predicted numerically are only 0.5% at part speed and 0.3% at design speed but are nonetheless significant. The difference in slope between the numerical and the physical experiment is attributable to factors such as surface roughness and variability in the tip gap experimentally as well as residual problems with the torque measurement experimentally which although improved from earlier work(Reference Wild and Hockman28), still appear to retain some degree of dependence on the speed. These latter two effects are apparent in Fig. 8, where the isentropic efficiency profiles are seen to move leftwards with the decrease in speed and are further away from the corresponding CFD predictions. Most experimental studies tend to compare only the differences(Reference Rose, Harvey, Seaman, Newman and McManus4,Reference Harvey, Brennan, Newman and Rose5) , at a given condition, between CFD and experiment. In this case, the trends in the differences in all the data presented in Fig. 6 is the same for both CFD and the experiment, the contouring is seen to yield diminishing returns as the speed increases and the blade loading decreases. The magnitude of the differences is quite different however, with the CFD predicting smaller gains in isentropic efficiency (0.5% at the lowest speed, as opposed to 1.8% in the experiment) and larger reductions in C ske 7% versus 1.4%. These differences will be discussed in conjunction with Figs. 8 and 9.
In Fig. 6, the C ske values have been extracted by spanwise averaging the profiles of Fig. 9 over the range 0% to 75% span, to eliminate a very high input from the experimental values (see Fig. 9) in the tip gap region thought to result from a less than ideal tip gap in the test rig due to a slightly elliptical casing. The main difference between these experimental results and the results in Reference Snedden, Dunn, Ingram and Gregory-SmithRef. 27 are the difference in the highly loaded rotor isentropic efficiency and in C ske which swap the ranking of the endwalls at the lowest speed. This is now thought to be a result of a fault in the earlier measurements(Reference Snedden, Dunn, Ingram and Gregory-Smith27) upstream of the rotor, at this condition, owing to an internal leak within the 5-hole probe, which has been replaced. Stage isentropic efficiency on the other hand and C ske results also change but only as a result of the improved capture of flow features through the use of the additional pressure transducer. C ske, being designed to be more sensitive to areas of sheared flow, sees the greatest changes and the lightly loaded endwalls cases change ranking. In addition, the revision of the CFD results has yielded a consistent set of trends between the CFD and experiment, although the absolute values remain discordant.
Figures 7-9 examine spanwise distributions for the rotor outlet flow angle, the rotor isentropic efficiency, and C ske.
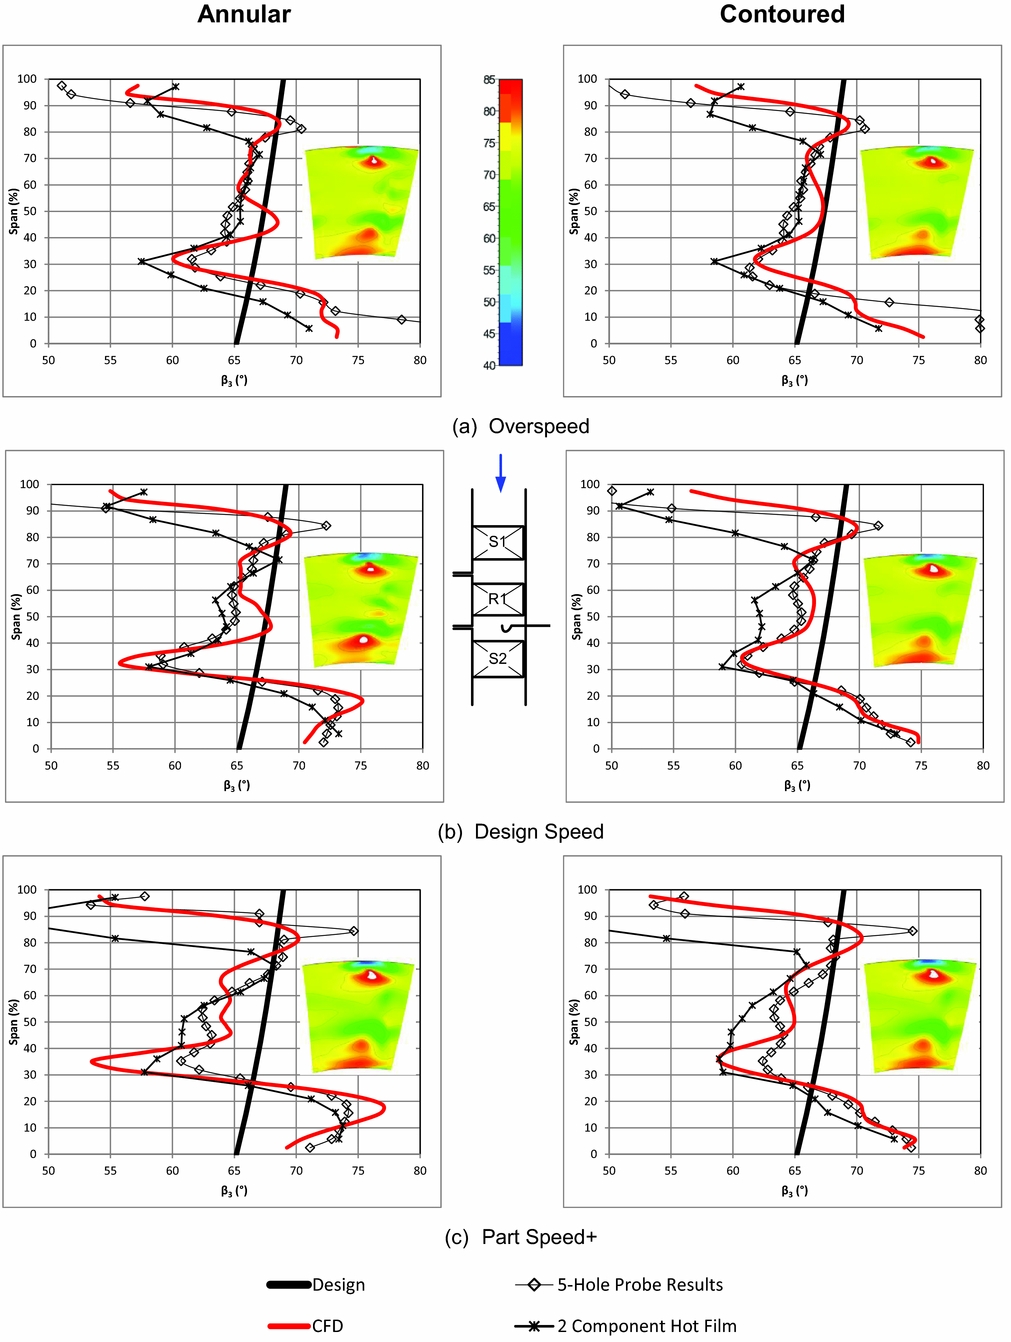
Figure 7. Pitch averaged relative rotor outlet angle (CFD area plot inset).
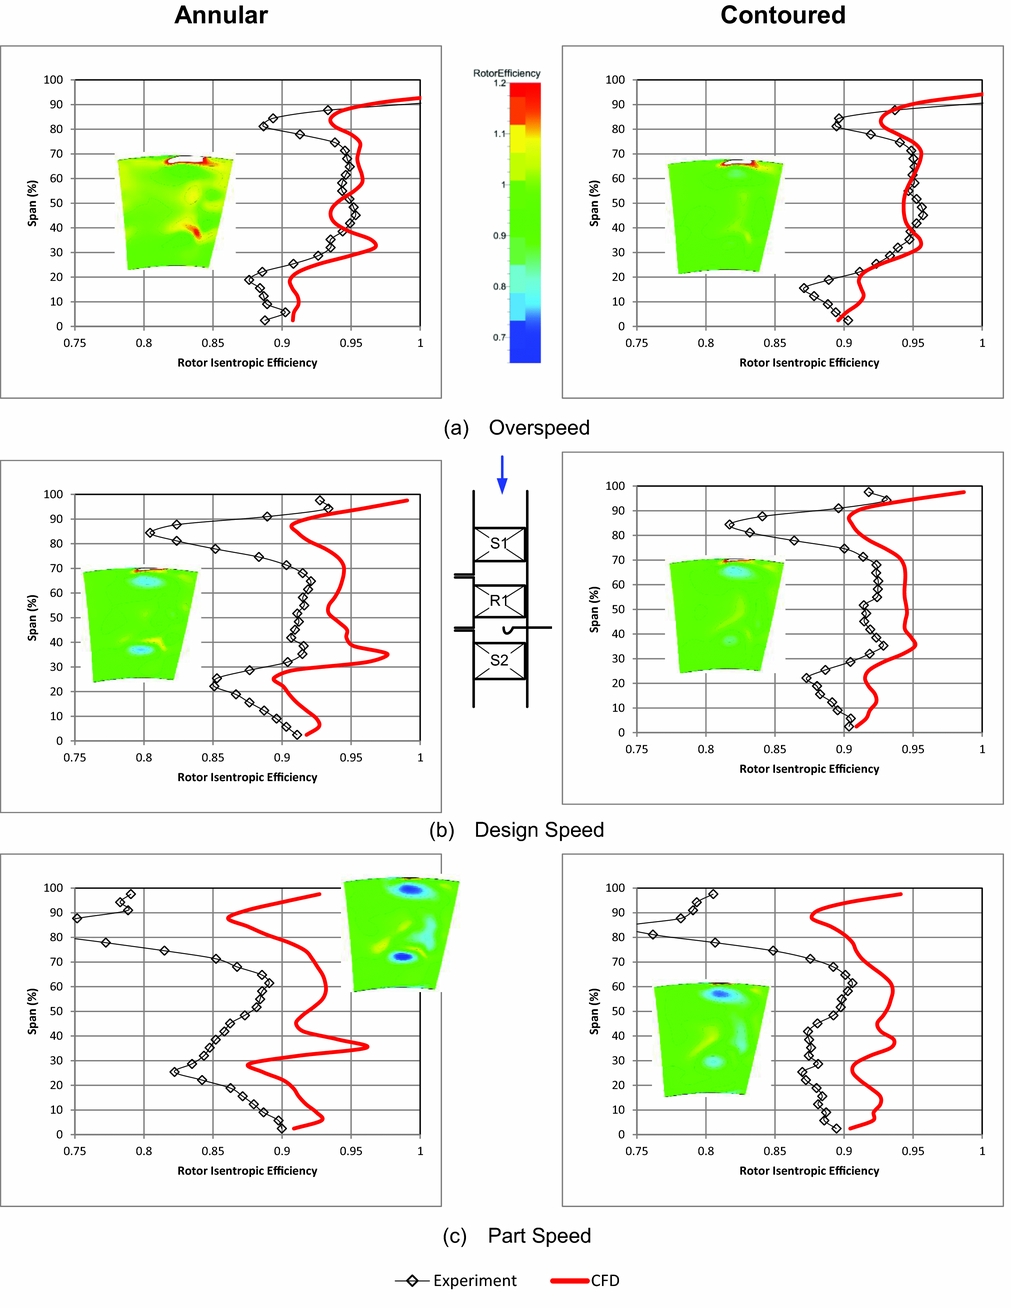
Figure 8. Pitch averaged relative rotor isentropic total efficiency (CFD area plot inset).
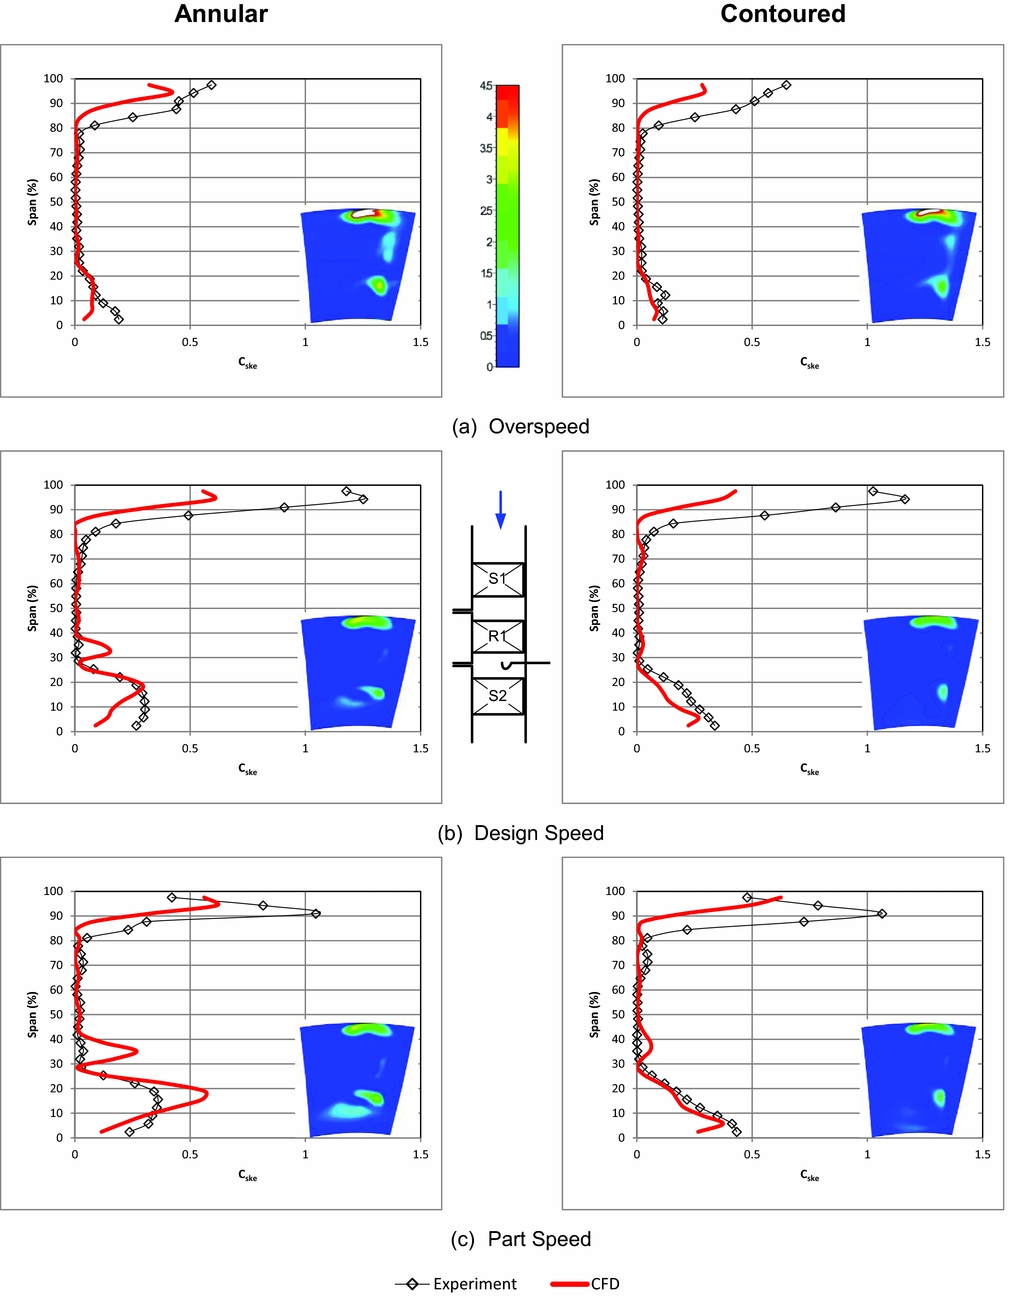
Figure 9. Rotor outlet coefficient of secondary kinetic energy (CFD area plot inset).
Previously, the authors found that some flow features captured by the CFD were not captured experimentally, specifically the overturning in the 20% – 30% span region. It was found that the high shear in the flow in the dominant vortex structures (tip leakage and endwall) was not accurately captured by the five-hole probe. This limitation is covered in more detail in Dunn(Reference Dunn24). The time averaged, meridional averaged unsteady results from(Reference Dunn24) are included in Fig. 7. Using a hot-film reduces the discrepancy between the CFD predictions and the experiment in the tip region and gives a much stronger and sharper underturning peak at 30% span in the outlet flow angle than the 5-hole probe results. The hot-film data gives a better agreement to the CFD in all cases except in the contoured high-speed case. In the 0–30% span region, where flow is influenced only by the endwalls, endwall contouring shows a consistent trend in Figs. 7(a), (b), and (c), that being a displacement of the overturning peak from 25% span towards the hub. This reduces the overall area of the region of overturned flow. However, as was found by both(Reference Rose, Harvey, Seaman, Newman and McManus4) and(Reference Harvey, Brennan, Newman and Rose5), this is balanced by an increase in the magnitude of the overturning angle which is associated with the modification of the cross-passage flow angle. This causes flow to pass behind the trailing edge rather than collide with the suction surface, which enhances the corner vortex(Reference Ingram22). Over the span range 0–70%, outside the region influenced by the tip gap, the effect is generally consistent at all three shaft speeds, which is to limit the regions of under- and overturning and make the turning angle less variable about the design intent. There are some discrepancies to this generalisation, but these are limited to the hot-film results for the contoured cases at design and at over speed over the range 40–60% span. The inset colour iso-levels of CFD flow outlet angle, in degrees, indicate that at design the annular test case has a single, strong vortex core originating from the hub secondary flows and emerging from the row at 20% span, whereas at off-design and with the introduction of endwall contouring, the outlet flow angle has two separate regions of overturnoverturned flow associated with the endwall and a reduction in secondary flow effects through the passage centre.
Figure 8 shows the radial distributions of the rotor isentropic total efficiency. The experimental data is shown to move to the left as the speed reduces. This is a limitation of the torque calibration procedure. Aside from this shift in the average, the overall spanwise distributions show a remarkable similarity between CFD and the experiment and the effect of contouring the endwall is a clear reduction in the radial variability of the results, which is also seen in the inset contour plots by the increasing area of the green contour in the plots. The greatest difference between the CFD and experimental results is the high peak seen at 35% span, and mirrored with a large peak in C ske (Fig. 9). This peak is not as strongly represented in the experiment but is visible at the design speeds in particular. The failure of the experiment to capture the magnitudes of these peaks and troughs about the mean is likely due to the finite size of the probe head.
Figure 9 plots spanwise results for C ske and a clear pattern emerges with the suppression of secondary kinetic energy both at 30% span and, more pronounced, at the hub (0-25% span) with the introduction of profiled endwalls. Secondary kinetic energy levels increase with loading as turning increases (as speed is reduced) and are very low in the overspeed case. There is a significant shift in the C ske profile between 0 and 15% span in Fig. 9(a), although the mass-averaged result suggests that the shift does not alter the area of this region much. At design and part speed, the differences are clearer and the mid-span secondary kinetic energy is reduced and the features between 0–35% span are suppressed toward the endwall. CFD results indicate a much stronger secondary flow feature at 35% span than the experiment but, apart from this, the C ske results near the hub are largely well predicted by the CFD. Figure 9 serves to show the value of the C ske quantity in the design of these endwalls as it quite clearly isolates the secondary flows and provides a positively valued penalty function for optimisation techniques that is sensitive to secondary flows.
Figure 10 visualises the flow over the hub surface by streamtubes, to give an insight into the low mechanisms that affect the rotor performance shown in Figs. 7-9. The trajectory of the pressure side leg of the horseshoe vortex (red streamtubes), as well as that of the cross-passage flow (green streamlines), are driven by the pressure gradient from the pressure side to suction side of the passage. The passage cross-flow moves across the passage at an increasingly tangential angle and greater helicity as the load increases (speed is reduced) in the annular case. The angle of the pressure side leg of the horseshoe vortex becomes locked by the raised section of the profiled endwall, which fixes its direction across the passage. The cross-passage flow remains influenced by the load, but the flow direction is more axial than for the annular case; in addition, some of the cross-passage streamlines are seen to flow upstream and spill around the leading edge with the addition of the profiled endwalls.

Figure 10. Close up of passage vortex streamlines.
With an annular hub, the passage vortices combine with the suction leg (blue streamtubes) wrapping around the pressure leg, both legs making slightly less than one turn down the length of the passage at design speed, the number of turns increasing as the speed decreases. The profiled hub cases clearly exhibit less vorticity or wrapping of the two vortices.
In all cases, the profiled endwalls result in a high degree of overturning at the hub, which can be seen to result from the modification of the passage cross-flow angle (note the bunching of the green streamlines at the exit of the passage) which results in the overturned flow passing behind the trailing edge rather than colliding with the blade and becoming caught in the combined passage vortices as it does with an annular hub.
4.2 Comparison to cascade data of Durham University(Reference Ingram22)
The key advantage of cascade testing is that it allows innovative concepts to be trialled at low cost, essentially it represents a physical model of the viscous flow effects inside a blade at the correct Reynolds number but with the effects of rotation and Mach number removed. The cascade results (from Ingram(Reference Ingram22)) indicate that profiled endwalls will reduce underturning, increase overturning and reduce the overall strength of the passage vortex. These effects are also clearly seen in the detailed rotating rig results (Fig. 7 for flow turning and Fig. 8 for loss) indicating that the influence of the radial pressure gradient in a rotating environment does not alter the fundamental operation of the endwalls. The averaged data presented in Table 2 shows a summary of the comparisons that can be drawn from the work of Ingram(Reference Ingram22) on the equivalent two-dimensional cascade geometry (used as the hub of the rotating rig) and that of the three-dimensional blading of the rotating rig. Figure 11 shows the spanwise distribution of loss and C ske for both the cases. The reduction in loss and in the secondary kinetic energy agrees in both cases to within a band of less than 10%, despite the very different absolute values in the case of C ske. The spanwise position of the over- and underturning peaks shows the greater extent of the secondary flows in the rotating case. The isentropic efficiency improvement compared the planar baseline calculated from the cascade data correlates to within 1% with that obtained from the rotating experiment, which is a large discrepancy if one is only concerned with the absolute value, but is remarkable given the assumptions made in the process of making the estimate from the cascade data such as constant 50% reaction(Reference Ingram22,Reference Saravanamuttoo, Rogers and Cohen36) . This agreement is based on only a single cascade and rig test and so the wider conclusion should be limited. This paper illustrates that the benefits of design modifications in a cascade environment should carry through to the same order of magnitude benefit in the rotating case: in short a positive cascade test is a good indicator for improved machine performance.
Table 2 Comparison of cascade and rotating rig results
* Versus a spanwise pitch-averaged design flow angle profile.
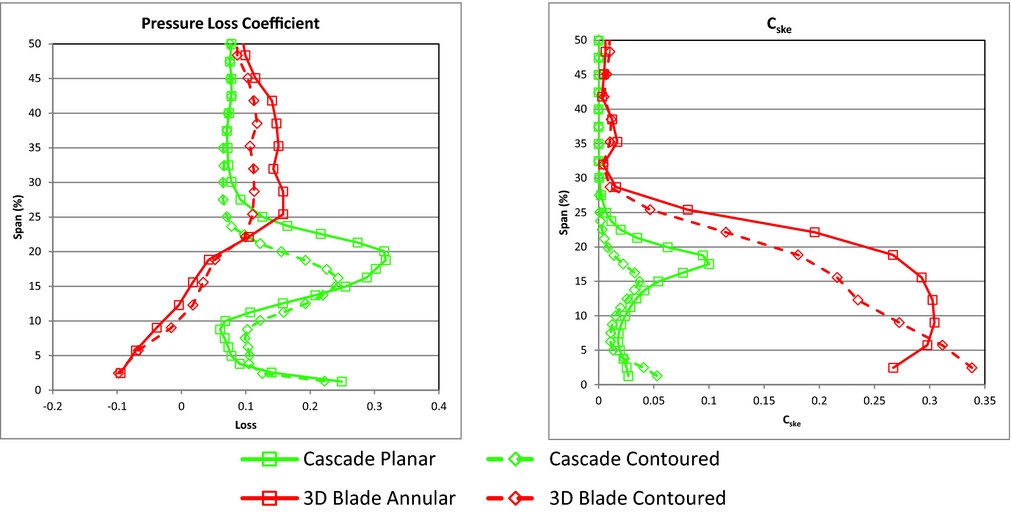
Figure 11. Comparison of cascade and rotating experiment at rotor exit (Cascade data reproduced from Ingram(Reference Ingram22)).
Two clear differences exist in this dataset to that of the work of Ingram(Reference Ingram22) as a result of the effects of rotation:
• The first is the presence of tip clearance flows and hence a lack of uniformity in the flow at high radius which is not reproduced in Ingram(Reference Ingram22). As this study is concerned with hub contouring, the tip leakage flow has been set outside the scope of this study.
• The second is the radial extent of the hub secondary flows, which is greatly expanded in the rotating case when compared to that of the cascade (see Fig. 11) which is consistent with the findings of Richards and Johnson(Reference Richards and Johnson37) These figures should however be viewed with caution as the absolute values of the quantities cannot be directly compared due to their dependence on very different inlet condition values, the Reynolds numbers are different and so are the measurement locations with respect to the blade. No adjustment of the span for the difference in the blade aspect ratio has been attempted. Nevertheless Fig. 11 shows a benefit in both pressure loss coefficient and secondary kinetic energy coefficient when contoured endwalls are applied.
4.3 Comparison to other off-design studies
Only two other studies in the wider literature present experimental results from rotating rigs with endwall contouring applied. A study of an HP blade by Rose et al(Reference Rose, Harvey, Seaman, Newman and McManus4) and Harvey et al(Reference Harvey, Brennan, Newman and Rose5) for an IP blade. Table 3, shows a comparison of the three cases with respect to their non-dimensional operating conditions and serves to highlight the range of conditions over which these endwalls have been shown to work effectively.
Table 3 Comparison of test case operating conditions
As turning is known to directly influence the secondary flows, increasing their strength with increased turning, one expects the endwalls to have increasing effect with increased turning; this argument was put forward by Rose et al(Reference Rose, Harvey, Seaman, Newman and McManus4) and supported by his data as shown in Fig. 12. Generally, the trends in response to the change in load (such as falling loss with decreasing load), found throughout this dataset are in line with the findings of Rose et al(Reference Rose, Harvey, Seaman, Newman and McManus4) and hence the experiment and numerical analysis are well posed and show good agreement in terms of the trends and level of improvement (see Fig. 12). The exception to this is however presented by Harvey et al(Reference Harvey, Brennan, Newman and Rose5) whose data for the IP turbine of the same Trent 500 test rig as that of Rose et al(Reference Rose, Harvey, Seaman, Newman and McManus4) for the HP stage. This outcome was however explained as resulting from the increased sensitivity of the design to Mach number effects which were more prevalent at positive incidence, effects that are not present in the current study and are not significant in that of Rose et al(Reference Rose, Harvey, Seaman, Newman and McManus4).
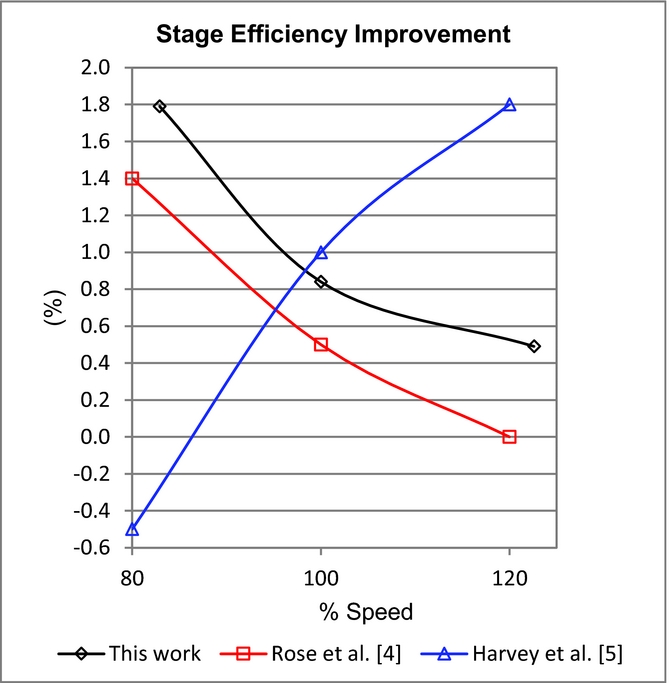
Figure 12. Comparison of stage efficiency gains with those in the literature, the results for(Reference Rose, Harvey, Seaman, Newman and McManus4) and(Reference Harvey, Brennan, Newman and Rose5) are taken at design work.
5.0 CONCLUSIONS
The work presented here re-examined the results of Snedden et al(Reference Snedden, Dunn, Ingram and Gregory-Smith27) using a more rigorous experimental set-up capable of improved measurements in highly sheared flow and adding time averaged hot-film results for comparison. These results were compared to CFD results as well as to cascade data for the same hub profile extracted from the Durham cascade(Reference Ingram22) and other off-design studies available in the literature.
The profiling of the endwalls consistently improves the isentropic efficiency of the blade row and stage and also achieves a reduced C ske. The improvement in the rotor isentropic efficiency at the design point found in the study is 0.8% while C ske reduces by 42.8%. These improvements correlate to those predicted by cascade testing.
Testing over a range of off-design speeds proves the ability of even generic, non-axisymmetric endwalls to consistently improve the blade-row isentropic efficiency as well as limit the variability of the flow angles entering the next row. The trend found is also consistent with the limited set of applicable off-design studies available in the literature and is that the effect of profiling increases with increasing turning which is well known to dictate the strength of the secondary flows in the row. At overspeed, the advantages are smallest but increase more than linearly with decreasing rotor speed.
The mechanism for the improvement is highly consistent with the work of Rose et al(Reference Rose, Harvey, Seaman, Newman and McManus4) and Harvey et al(Reference Harvey, Brennan, Newman and Rose5) in that the overturning below 50% span, caused by the secondary flows, is confined to be closer to the hub and is well predicted using C ske. CFD results suggest that this is achieved by changing the cross-passage trajectory of the pressure side leg of the horseshoe vortex and reducing the strength of cross-passage flows subsequent to this vortex structure. These effects result in reduced twisting of the two legs of the horseshoe vortices, weakening the passage vortex structure compared to the annular case.
Despite the sub-optimal nature of this profiled endwall, it has proven to consistently improve the total isentropic efficiency of the blade row across a large range of incidence, which clearly indicates the robustness of this method and proves the method's ability to achieve results over a range of incidence. The improvement diminishes with reduced load and as Harvey et al(Reference Harvey, Brennan, Newman and Rose5) suggests, greater attention to off-design points should be given during optimisation or as this study suggests the endwall should be profiled to obtain good performance at conditions below the peak load condition in order to realise the advantage across the entire range of operation.


