


Introduction
Strongyloidiasis is a parasitic infection caused mainly by the nematode Strongyloides stercoralis. Although it has a wide distribution, the infection is more prevalent in tropical areas. It is estimated that 30–100 million people are infected worldwide, although these numbers may presumably be underestimated due to the poor sensitivity of the available diagnostic methods (Olsen et al., Reference Olsen, van Lieshout, Marti, Polderman, Polman, Steinmann, Stothard, Thybo, Verweij and Magnussen2009; Schär et al., Reference Schär, Trostdorf, Giardina, Khieu, Muth, Marti, Vounatsou and Odermatt2013a). Even though this parasite usually infects the host by direct penetration through intact skin in contact with contaminated soil, it also has the ability to multiply indefinitely and to reinfect the host without the need for exogenous re-infection. Due to this characteristic, the infection can be diagnosed in people from non-endemic areas who have previously lived in endemic countries. Most of the infected patients remain asymptomatic for years, with non-constant eosinophilia as a single sign. When symptoms are present, these can be cutaneous, respiratory and intestinal, but it is in situations of immunosuppression when the most serious clinical profile appears, without the presence of eosinophilia, constituting the hyperinfection syndrome with a generalized spread of the parasite inside the host (Marcos et al., Reference Marcos, Terashima, Dupont and Gotuzzo2008).
The lack of a gold standard technique is the main problem in the diagnosis of strongyloidiasis. Currently, the most accurate diagnosis is obtained by the microscopic observation of the parasite in stools. However, the intermittent elimination of the parasite and the scarce number of larvae present in faeces of patients with chronic disease, many times under the detection threshold of available diagnostic tests, make the sensitivity of the direct examination low, generally less than 30% (Montes et al., Reference Montes, Sawhney and Barros2010). Some authors reported that the analysis of serial stool samples increases sensitivity up to 50–70%, reaching 100% when analysing up to seven stool samples (Siddiqui & Berk, Reference Siddiqui and Berk2001; Requena-Méndez et al., Reference Requena-Méndez, Chiodini, Bisoffi, Buonfrate, Gotuzzo and Muñoz2013). Although larval migration methods (Baermann and Harada–Mori techniques) or agar plate culture increase sensitivity, many chronic infections are not detected (Requena-Méndez et al., Reference Requena-Méndez, Chiodini, Bisoffi, Buonfrate, Gotuzzo and Muñoz2013). In addition, larval migration techniques require fresh stool samples where larvae are still viable, and also, in the case of agar culture, it takes a minimum of 2 days of incubation to get a result, with the consequent delay in the diagnostic process. On the other hand, it is also important to mention that differential diagnosis of hookworm has to be carried out (Siddiqui & Berk, Reference Siddiqui and Berk2001; Requena-Méndez et al., Reference Requena-Méndez, Chiodini, Bisoffi, Buonfrate, Gotuzzo and Muñoz2013).
Molecular biology techniques, specifically the polymerase chain reaction (PCR), represent an improvement in the detection of the parasite. Different sequences, such as the internal transcribed spacers or the 18S subunit of ribosomal DNA, have been used as targets for amplification by conventional, nested and real-time PCR (Verweij et al., Reference Verweij, Canales, Polman, Ziem, Brienen, Polderman and van Lieshout2009; Moghaddassani et al., Reference Moghaddassani, Mirhendi, Hosseini, Rokni, Mowlavi and Kia2011; Sultana et al., Reference Sultana, Jeoffreys, Watts, Gilbert and Lee2013; Saugar et al., Reference Saugar, Merino, Martín-Rabadán, Fernández-Soto, Ortega, Gárate and Rodríguez2015). Some of them have also been developed in a multiplex format, allowing the simultaneous detection of several intestinal parasites in a single reaction using different sets of primers (Janwan et al., Reference Janwan, Intapan, Thanchomnang, Lulitanond, Anamnart and Maleewong2011; Mejia et al., Reference Mejia, Vicuña, Broncano, Sandoval, Vaca, Chico, Cooper and Nutman2013; Llewellyn et al., Reference Llewellyn, Inpankaew, Nery, Gray, Verweij, Clements, Gomes, Traub and McCarthy2016). Different data on sensitivity have been reported, but in most cases they are better than or similar to those achieved by Baermann or agar culture techniques (Verweij et al., Reference Verweij, Canales, Polman, Ziem, Brienen, Polderman and van Lieshout2009; Moghaddassani et al., Reference Moghaddassani, Mirhendi, Hosseini, Rokni, Mowlavi and Kia2011; Sitta et al., Reference Sitta, Malta, Pinho, Chieffi, Gryschek and Paula2014; Saugar et al., Reference Saugar, Merino, Martín-Rabadán, Fernández-Soto, Ortega, Gárate and Rodríguez2015).
Given that the usual practice of stool examination for parasites recommends taking three successive samples per patient, the objective of this study was to evaluate the sensitivity of the real-time PCR technique for the diagnosis of S. stercoralis, in contrast to conventional parasitological techniques, in order to define the minimum number of serial samples necessary to achieve maximum sensitivity.
Materials and methods
Sample collection
The study was conducted using 116 stool samples from 39 patients with clinical suspicion of strongyloidiasis attending the Severo Ochoa Hospital in Leganes (Spain). Molecular diagnosis of strongyloidiasis was performed at the National Microbiology Centre. Parasitological diagnosis (microscopic observation, agar culture and Harada–Mori) was carried out in the hospital, according to its protocols (Cañavate et al., Reference Cañavate, Cuadros, Martínez Ruiz, Martin-Rabadán, Cercenado and Cantón2009). Different serial samples from patients were analysed. For all patients the analyses were conducted on at least two consecutive stool samples. In 39, 23 and 8 of them, the analyses were carried out on two, three and four or more consecutive samples, respectively. All the patients included in the study were immigrants from different endemic countries of Africa and Latin America.
Concentration of stool samples and DNA extraction
Faecal samples were concentrated according to the protocol described by Saugar et al. (Reference Saugar, Merino, Martín-Rabadán, Fernández-Soto, Ortega, Gárate and Rodríguez2015). Briefly, 1 g of stool sample was suspended in 8 ml of 0.9% saline solution, filtered and centrifuged using the commercial system Bioparapred-Midicolumns (Leti diagnosis, Barcelona, Spain). Supernatants were discarded and sediments were used for DNA extraction.
DNA was extracted from 200 mg of concentrated samples using the Fast QIAamp DNA Stool Mini kit (Qiagen, Hilden, Germany) following the manufacturer's instructions. After the elution of DNA in 200 μl of distilled water, DNA concentration was measured using a Nanodrop ND-100 spectrophotometer (Nanodrop Tecnologies, New York, USA). DNA samples were stored at 4°C until use.
Real-time PCR
Amplification and detection of Strongyloides spp. DNA was performed in triplicate in each sample, including 10 ng of Strongyloides venezuelensis DNA as an internal inhibition control in the third replicate. The protocol of real-time PCR was carried out as described by Saugar et al. (Reference Saugar, Merino, Martín-Rabadán, Fernández-Soto, Ortega, Gárate and Rodríguez2015). Concisely, real-time PCR reactions were performed in a final volume of 25 μl using 1 × Quantimix EasyMaster Mix (Biotools B&M Laboratories, Madrid, Spain), 0.2 μm of each of the S. stercoralis 18S specific primers described by Verweij et al. (Reference Verweij, Canales, Polman, Ziem, Brienen, Polderman and van Lieshout2009), 0.5 μl of SybrGreen 50 × (Invitrogen, San Diego, California, USA) and 25 ng of DNA extracted from stool samples. The amplification program consisted of 15 min at 95°C, and 50 cycles of 10 s at 95°C, 10 s at 60°C and 30 s at 72°C. DNA amplification and detection of fluorescence at the end of each amplification cycle was performed on a CorbettRotorGeneTM 6000 real-time PCR system (Qiagen). Data were analysed using RotorGene 6000 Series software version 1.7 (Qiagen).
Data analysis
Double-entry contingency tables were constructed and sensitivity, specificity, positive predictive value (PPV) and negative predictive value (NPV) were calculated using EpiData software version 3.1 (EpiData Association, Odense, Denmark), considering the combination of parasitological techniques as the gold standard. In order to compare parasitological and molecular methods along different consecutive samples, the patient was considered to be positive since the first sample when a positive result was obtained by at least one of the three parasitological techniques in any of the samples. For real-time PCR the patient was considered as positive from the first positive sample and as negative for the previous samples. Venn diagrams were calculated using the application described by Hulsen et al. (Reference Hulsen, de Vlieg and Alkema2008).
Results
According to the study population profile, the age of the patients ranged from 4 to 62 years (mean 32.64 ± 15.85), and 51.28% were women. Regarding the geographical origin, all the patients were immigrants, of whom 41.03% came from Africa (Equatorial Guinea, Morocco, Nigeria, Ethiopia, the Republic of Guinea, Cape Verde, Cameroon or Congo), 41.03% from Latin America (Peru, Bolivia, Ecuador, Dominican Republic or Colombia) and 17.94% were of unknown origin.
The results of the real-time PCR technique and parasitological methods regarding the number of serial samples per patient are shown in fig. 1. After the analysis of two or more serial samples of the same patient, no negative real-time PCR result was obtained in any parasitologically positive sample. According to the percentages showed in fig. 1, 56.40% of positive patients were obtained by the combination of molecular and parasitological methods when analysing two serial samples (fig. 1b). However, the same percentage was obtained by PCR alone when three serial samples were analysed (fig. 1c). The percentage of negative patients was similar when analysing three (26.10%) and four or more (25.00%) serial samples (fig. 1c and d).
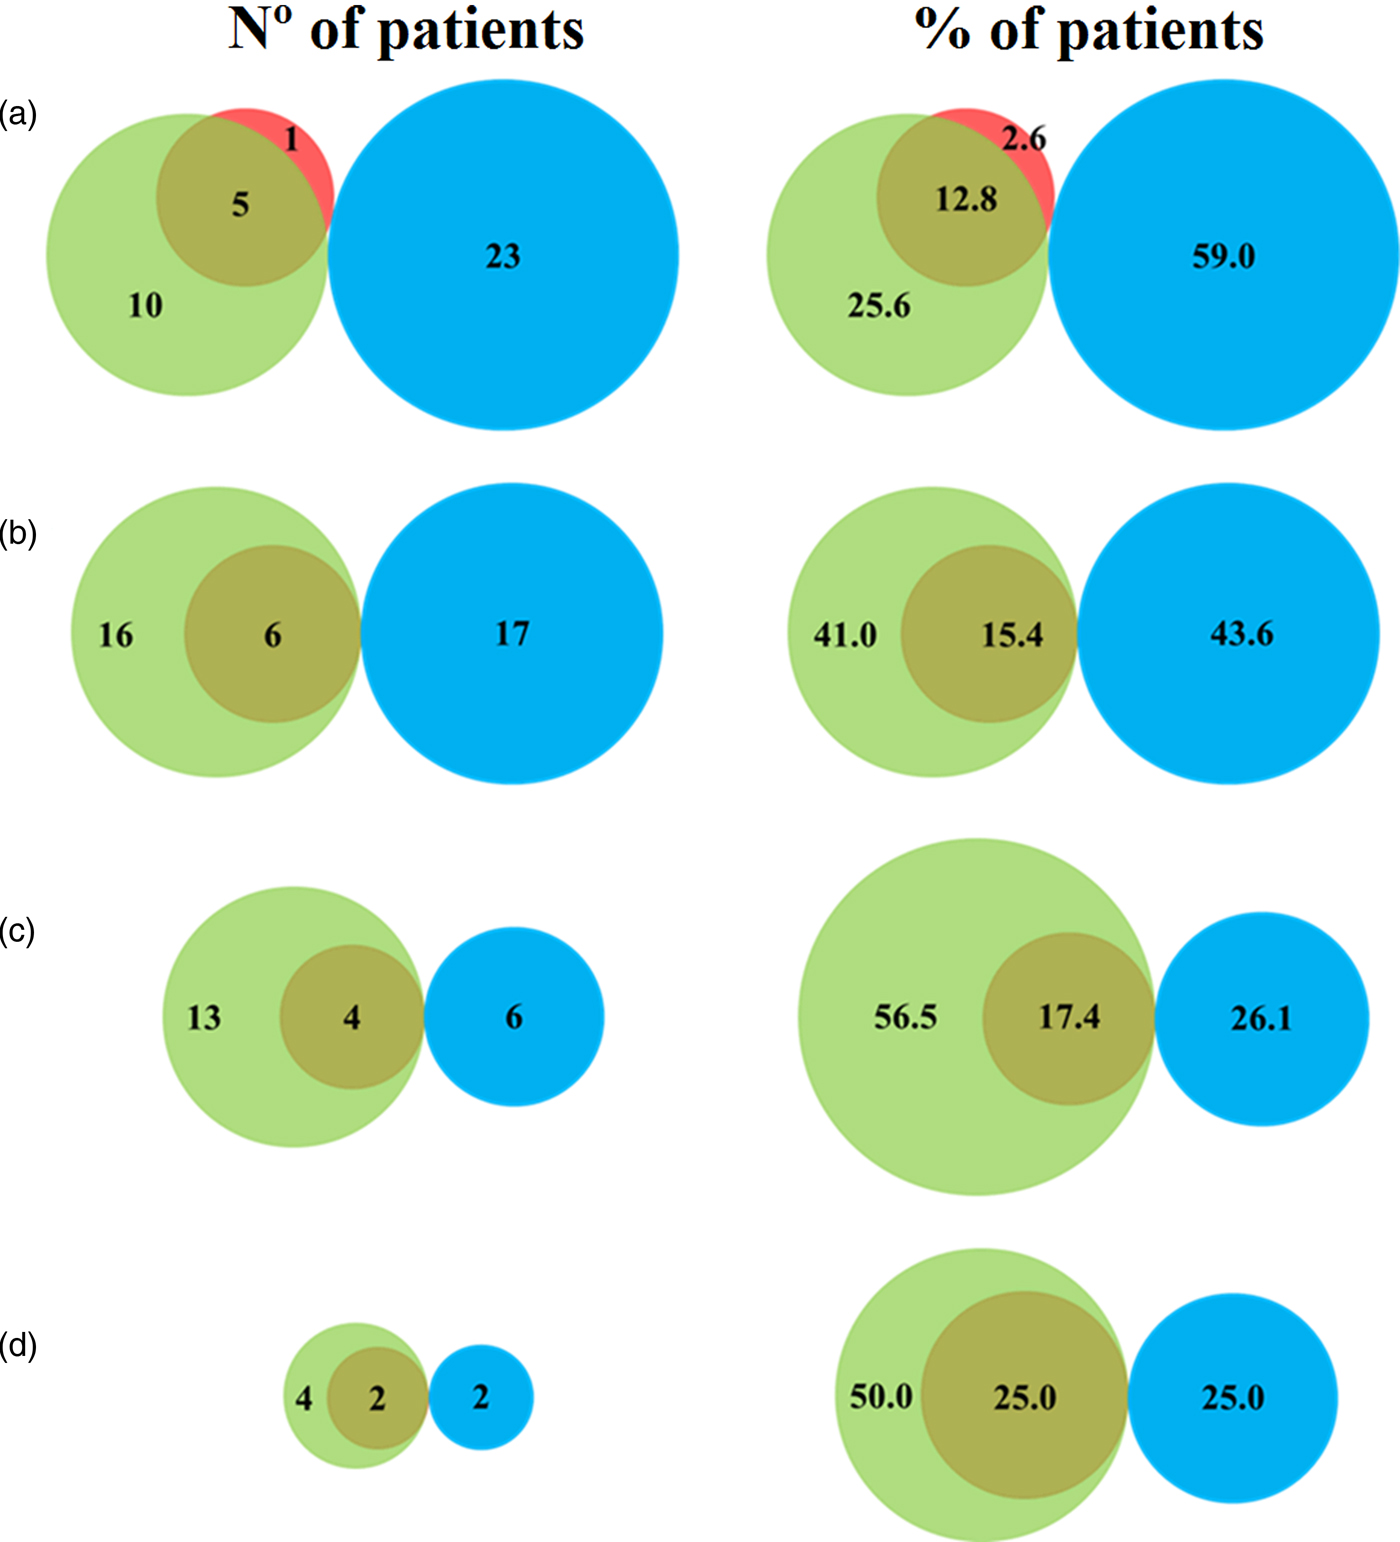
Fig. 1. Venn diagram representing the results of parasitological and molecular techniques per patient, when analysing (a) a single sample; (b) two serial samples; (c) three serial samples; and (d) four or more serial samples. Results in red are positive using parasitological methods or green using PCR. Negative results are shown in blue.
Table 1 shows the performance of the real-time PCR, in terms of sensitivity, specificity, PPV and NPV, which were calculated relative to the values obtained by parasitological techniques. When analysing only one sample, a sensitivity of 83.00% was obtained, due to a single false-negative sample that was positive by microscopic observation. Similarly, real-time PCR presented a specificity of 69.70%, where 10 samples were detected by PCR but not by parasitological techniques (fig. 1a). The values of sensitivity and NPV increased as the number of samples analysed per patient increased, achieving 100.00% with two consecutive samples, whereas the values of specificity and PPV apparently decreased.
Table 1. Performance and predictive values (PPV, positive predictive value; NPV, negative predictive value) of real-time PCR relative to parasitological techniques regarding the number of serial samples analysed per patient.

Discussion
Strongyloidiasis is mainly an asymptomatic parasitic disease caused by S. stercoralis. Despite the severity of the infection in immunocompromised patients, its diagnosis currently lacks the sensitivity and specificity necessary to detect most of the cases effectively. So far, the diagnosis has been based on parasitological techniques, requiring much time and the analysis of multiple serial samples. Different molecular diagnostic approaches have been carried out, mainly by PCR techniques (Verweij, Reference Verweij2014; Buonfrate et al., Reference Buonfrate, Formenti, Perandin and Bisoffi2015). In our study, sensitivity, specificity, PPV and NPV of the real-time PCR described by Saugar et al. (Reference Saugar, Merino, Martín-Rabadán, Fernández-Soto, Ortega, Gárate and Rodríguez2015) compared to parasitological techniques have been evaluated, as well as the minimum number of samples required to make the diagnosis with the highest sensitivity.
The sensitivity obtained was similar to the results previously described by Saugar et al. (Reference Saugar, Merino, Martín-Rabadán, Fernández-Soto, Ortega, Gárate and Rodríguez2015) and by other authors using the conventional PCR technique (Sitta et al., Reference Sitta, Malta, Pinho, Chieffi, Gryschek and Paula2014) or real-time PCR (Schär et al., Reference Schär, Odermatt, Khieu, Panning, Duong, Muth, Marti and Kramme2013b). However, in our study the maximum sensitivity was reached after the second extraction, improving those results obtained in other studies by parasitological techniques, where the analysis of up to seven serial samples by microscopic observation was necessary to obtain 100% sensitivity (Nielsen & Mojon, Reference Nielsen and Mojon1987), or the analysis of three serial stool samples by agar plate culture (APC) according to the diagnostic algorithm proposed by Repetto et al. (Reference Repetto, Ruybal, Solana, López, Berini, Alba Soto and Cappa2016), with the associated problem of needing fresh samples in the latter technique in order to maintain the viability of larvae. Furthermore, Knopp et al. (Reference Knopp, Mgeni, Khamis, Steinmann, Stothard, Rollinson, Marti and Utzinger2008) calculated the sample sizes needed, if up to 1% false-negative results were considered acceptable, to be 12 stool samples for S. stercoralis with the APC method.
On the other hand, our study showed that real-time PCR presents a low specificity in contrast to that described for the parasitological techniques (Schär et al., Reference Schär, Odermatt, Khieu, Panning, Duong, Muth, Marti and Kramme2013b). This is due to the fact that when comparing the results of parasitological and PCR techniques in the 39 patients included in our study, only 16 of them were detected by molecular technique. With real-time PCR having a higher sensitivity than parasitological methods, a relatively low specificity and PPV were obtained. This artificially low specificity was caused by the high number of discrepant results when molecular diagnosis techniques were used versus conventional parasitological methods (Conraths & Schares, Reference Conraths and Schares2006). In our study, those samples positive by real-time PCR and negative by parasitological techniques were confirmed as true positives because the percentage of negative patients remained constant for both methodologies from the third serial sample, while the percentage of parasitologically positive patients increased as the number of serial samples increased. Similar results were obtained by other authors when comparing molecular and parasitological techniques (Becker et al., Reference Becker, Piraisoody, Kramme, Marti, Silué, Panning, Nickel, Kern, Herrmann, Hatz, N'Goran, Utzinger and von Müller2015; Repetto et al., Reference Repetto, Ruybal, Solana, López, Berini, Alba Soto and Cappa2016).
The differences obtained between molecular and parasitological methods may be due to the erratic appearance of larvae in faeces and their presence at low concentrations. It is important to note that in this study the patients were immigrants presenting a chronic phase of the disease, a factor that could affect to the presence of larvae in faeces. Therefore, a method based on direct observation of the parasite might not be able to detect it as effectively as a method based on the detection of its DNA. Nonetheless, and despite the chronic profile of the patients in our study, one positive result by microscopic observation was obtained that tested negative by PCR. This could be explained by a possible failure of the observer, as in some cases it is difficult to differentiate Strongyloides spp. from hookworms; or by the presence of a very low parasite load in the sample, below the limit of detection of the real-time PCR. In addition, the treatment of stool samples before DNA extraction used in our study allows a higher concentration of the parasite, allowing better results than those obtained by other authors who used the same amplification target (Sultana et al., Reference Sultana, Jeoffreys, Watts, Gilbert and Lee2013).
In summary, the high sensitivity (100%) obtained when two serial stool samples of a patient are analysed by real-time PCR, decreases the number of samples needed to diagnose with the same sensitivity as the parasitological techniques.
Financial support
This study was funded by Instituto de Salud Carlos III, Spain (ISCIII-MPY 1403/09) and by the 6th National Plan (PN) of Research + Development + Innovation (I + D + I) 2008–2011, Carlos III Health Institute (ISCIII) General Division Networks and Cooperative Research Centers + Collaborative Research Network on Tropical Diseases (RICET) Red de Investigación Cooperativa en Enfermedades Tropicales (RICET) (RD12/0018/0011).
Conflict of interest
None.
Ethical standards
The authors assert that all procedures contributing to this work comply with the ethical standards of the relevant national and institutional committees on human experimentation (approved by the Ethical Committee of Instituto de Salud Carlos III, CEI PI06-2012) and with the Helsinki Declaration of 1975, as revised in 2008.


