Introduction
The industrialization of agriculture, consisting of the development of large-scale, specialized, input-intensive farms, has generated tremendous gains in labor productivity (income per hour of labor (Dimitri et al., Reference Dimitri, Effland and Conklin2005) and attendant profits for agribusiness (Magdoff et al., Reference Magdoff, Foster and Buttel2000). These gains have been accompanied by an array of increasingly negative social and ecological consequences (Lobao and Meyer, Reference Lobao and Meyer2001; Altieri and Nicholls, Reference Altieri and Nicholls2005; McIntyre et al., Reference McIntyre, Herren, Wakhungu and Watson2009). The market and policy shifts that are the causes and consequences of industrialization create formidable challenges for farmers managing diversified farming systems (DFS) (Bowman and Zilberman, Reference Bowman and Zilberman2013). Labor productivity is a particularly critical consideration for DFS, which must compete with industrialized farms that have largely replaced human labor with mechanical and chemical inputs (Wang and Ball, Reference Wang and Ball2014). Facing a lack of governmental and institutional support, farmers of DFS turn to alternative, grassroots support networks through which they can share production, marketing and planning strategies (Ingram, Reference Ingram2007; Fernandez et al., Reference Fernandez, Goodall, Olson and Mendez2012). Such alternative agroecological networks, ranging from informal farmer-to-farmer knowledge sharing (Kroma, Reference Kroma2006; Isaac et al., Reference Isaac, Erickson, Quashie-Sam and Timmer2007), to semi-institutionalized regional networks (Warner, Reference Warner2006), to highly coordinated national and international movements (Martínez-Torres and Rosset, Reference Martínez-Torres and Rosset2010; Rosset et al., Reference Rosset, Sosa, Jaime and Lozano2011; Fernandez et al., Reference Fernandez, Goodall, Olson and Mendez2012; Petersen et al., Reference Petersen, Mussoi and Dalsoglio2012), have been identified as important sources of technical and socio-political support for farmers managing DFS.
Permaculture is one such movement that has received increasing popular attention but little systematic assessment. Permaculture is an international network with broad sustainability goals (Ferguson and Lovell, Reference Ferguson and Lovell2015) and a core focus on diverse productive landscapes (Mollison, Reference Mollison1988; Holmgren, Reference Holmgren2002). Recent research has shown substantial overlap between the themes and proposals of permaculture with those of agroecology (Ferguson and Lovell, Reference Ferguson and Lovell2014). Despite a high public profile (cf. the extensive popular literature and web presence), permaculture has received very little attention in the scientific literature, though recent publications may indicate a shift. While historically associated with gardening and subsistence production rather than commercial production, there is evidence of growing interest in permaculture as an approach to farming, both in the popular permaculture literature (Frey, Reference Frey2011; Holzer, Reference Holzer2011; Shepard, Reference Shepard2013) and in recent scholarly literature (Conrad, Reference Conrad2014; Ferguson and Lovell, Reference Ferguson and Lovell2014, Reference Ferguson and Lovell2017; Ingram et al., Reference Ingram, Maye, Kirwan, Curry and Kubinakova2014; Suh, Reference Suh2014; Morel and Léger, Reference Morel and Léger2016; Morel et al., Reference Morel, Guégan and Léger2016).
This paper reports on an exploratory investigation of permaculture on DFS in the USA. Using a novel digital survey application (described in detail in Ferguson and Lovell, Reference Ferguson and Lovell2017), we gathered data on labor and income for 196 enterprises (distinct sectors or sources of revenues within the farm business) at 36 permaculture-identified farms. We use the distribution of labor and income across multiple enterprises to characterize income diversity at the level of the whole farm (including non-production enterprises) and production diversity (using the distribution of labor across production enterprises). Combining enterprise-level data on labor and income with farm-level data, we developed a multilevel model to investigate the associations between labor productivity, diversification, and involvement with permaculture.
The decline of diversified farming systems
For the past 80 years, the USA has been at the forefront of the agricultural industrialization—adopting policies that favor fewer, larger, increasingly mechanized, and increasingly specialized farms. This trajectory has produced a drastic reduction in the number of farms in the USA, from a peak of 6.8 million in 1935 to 2.1 million in 2014 (USDA-NASS, 2014a). As farms have grown fewer, they have also become less diverse, shifting over the same timeframe from an average five commodities produced per farm to an average of just over one (Dimitri et al., Reference Dimitri, Effland and Conklin2005).
While DFS are defined by their high levels of biophysical diversity (Kremen et al., Reference Kremen, Bacon and Iles2012), they typically display multiple forms of diversification. Diversified farms exhibit high levels of pluriactivity, or diversification of livelihood—a nearly ubiquitous feature of farm households more broadly (Brookfield, Reference Brookfield2001). DFS have substantial overlap with other farm categorization schemes, and any given DFS is likely to fit into one or more additional categories of multifunctional, organic, agroecological, family and/or peasant farms (Brookfield, Reference Brookfield2008; van der Ploeg, Reference van der Ploeg2008; Wilson, Reference Wilson2008; Kremen et al., Reference Kremen, Bacon and Iles2012). Across these categories, most farmers use multiple forms of pluriactivity to maintain an agrarian livelihood, including off-farm employment to supplement farm earnings, developing new non-production enterprises on and off the farm and diversifying production to hedge against risk and tap new markets.
The apparent gains in labor productivity that have accompanied industrialization are achieved with an array of externalized social and ecological functions. Diverse, spatially heterogeneous landscapes consisting of a mosaic of annual and perennial crop and non-crop patches, have been replaced by large uniform blocks of a small number of genetically homogenous annual crops under constant disturbance (Perfecto and Vandermeer, Reference Perfecto and Vandermeer2010; Barthel et al., Reference Barthel, Crumley and Svedin2013). As biologically diverse agricultural landscapes disappear, so do the critical environmental services on which agriculture ultimately depends. In tandem with ecological simplification, the substitution of agri-chemicals and mechanization for human labor has triggered a substantial increase in farm size and a commensurate decline of the number of farmers—from nearly 40% of the US population 1900, to now 1% (USDA-NASS, 2012). Rural communities have followed the depopulation of the farm sector—over the same period the percent of the US population living in rural areas dropped from nearly 60% to ~22% in 2005 (Dimitri et al., Reference Dimitri, Effland and Conklin2005).
Labor productivity is a poor indicator of the value of the social and environmental functions that DFS perform—for which they are generally uncompensated (FAO, 2015; Sandhu et al., Reference Sandhu, Wratten, Costanza, Pretty, Porter and Reganold2015). By the same token, labor productivity is a useful indicator of the current status of DFS. Farmers managing DFS face formidable challenges, including exclusion from governmental incentive programs, loans and subsidies (Bowman and Zilberman, Reference Bowman and Zilberman2013); increasing capital and input costs (Iles and Marsh, Reference Iles and Marsh2012); the disappearance of intermediate-scale markets and economic institutions (Lyson et al., Reference Lyson, Stevenson and Welsh2008); and the lack of appropriate decision and planning support (Becot et al., Reference Becot, Conner, Kolodinsky and Méndez2014). DFS that are able to achieve higher returns to labor have a better chance of surviving through the current market and policy environment.
Strategies of agricultural diversification
Diversification of production has multiple potential benefits for farmers. It is well recognized as an “insurance” strategy to hedge against risk – and in this context has traditionally been regarded as a tradeoff with efficiency (Kahiluoto and Kaseva, Reference Kahiluoto and Kaseva2016). The potential for farm diversification to drive synergies, rather than tradeoffs, has received less attention. Production synergies occur when two (or more) systems are more productive in combination than in isolation (Altieri and Nicholls, Reference Altieri and Nicholls2005). Such economies of scope represent a pathway for enhancing labor productivity that contrasts with the economies of scale favored by industrial agriculture. Researchers have identified such synergies at multiple scales, from the patch or field to the whole farm. Synergies at the field scale, or overyielding, may be generated by facilitation and/or resource partitioning between crop species when grown in arrangements that are mixed in space (polycultures) or time (crop rotation) (Vandermeer, Reference Vandermeer1992; Smith et al., Reference Smith, Gross and Robertson2008; Picasso et al., Reference Picasso, Brummer, Liebman, Dixon and Wilsey2011; Brooker et al., Reference Brooker, Bennett, Cong, Daniell, George, Hallett, Hawes, Iannetta, Jones, Karley, Li, McKenzie, Pakeman, Paterson, Schöb, Shen, Squire, Watson, Zhang, Zhang, Zhang and White2015). At the farm scale, researchers have identified a broad range of potential synergies across functional groups and land uses, including the integration of trees and annual crops (Schoeneberger et al., Reference Schoeneberger, Bentrup, de Gooijer, Soolanayakanahally, Sauer, Brandle, Zhou and Current2012), livestock and annual crops (Devendra and Thomas, Reference Devendra and Thomas2002), livestock and tree crops (Sharrow et al., Reference Sharrow, Buck, Lassoie and Fernández1999), and aquaculture systems with diverse land-based production (Dey et al., Reference Dey, Paraguas, Kambewa and Pemsl2010; Murshed-E-Jahan and Pemsl, Reference Murshed-E-Jahan and Pemsl2011).
Agricultural diversification links multiple economic and biophysical dimensions of diversity (Ribeiro Palacios et al., Reference Ribeiro Palacios, Huber-Sannwald, García Barrios, Peña de Paz, Carrera Hernández and Galindo Mendoza2013; Zimmerer and Vanek, Reference Zimmerer and Vanek2016). While economic diversification entails biophysical diversification, economic and biophysical dimensions do not map neatly onto one another. Biophysical diversity on farms has many components and dimensions, which can be assessed at multiple spatial and temporal scales: crop varieties, crop species, structural diversity of cropping and non-cropping vegetation, or land use/land cover diversity. For our purposes it is only necessary to assume a rough and commonsense relationship between economic and biophysical dimensions of diversification, i.e., agricultural production has a biophysical dimension, and diversification of production enterprises will necessarily entail some dimension of biophysical diversification. Our measure of diversity should not be mistaken for mapping neatly onto any biophysical measure across contexts.
Diversification does not guarantee synergies in either economic or biophysical terms. Even carefully planned integration of multiple production systems can result in competition and interference effects that reduce productivity. Furthermore, actual biophysical synergies may not translate into increased returns to labor when they demand higher levels of management or when the spread of labor across more tasks decreases efficiency (Suh, Reference Suh2014). Particularly in a system in which fossil fuel and its agrichemical derivatives are cheap relative to human labor, labor requirements and costs will be higher for non-industrial production (Delate et al., Reference Delate, Duffy, Chase, Holste, Friedrich and Wantate2003; Pimentel and Burgess, Reference Pimentel, Burgess, Pimentel and Peshin2014). Indeed, labor costs are the largest component of production costs for organic farming in the USA (US Census 2008 Organic Production Survey), and diversification may compound the increased labor of organic practices. Because of their complexity, DFS are more difficult to manage than specialized farms, and present fundamental challenges in planning and decision-making (Chavas, Reference Chavas2008). The same complexity also limits farmers’ ability to make use of labor saving technologies, as the spatial and structural variation of DFS is less amenable to mechanization (Bowman and Zilberman, Reference Bowman and Zilberman2013).
Even as the industrialization of food systems creates obstacles to diversified production, the potential for diversification-driven synergies suggests a pathway for the survival and expansion of DFS—and thus, for the preservation of the multiple social and ecological functions of DFS. The permaculture movement regards such synergies as a fundamental component of their agroecological vision, and may constitute a source of useful support for DFS.
Permaculture and agricultural diversification
In a political-economic environment that favors large, industrialized farms, agroecological networks such as permaculture can provide support for DFS. Where extension services are often ill-equipped to deal with complex diversified operations or unconventional crops, farmer-to-farmer knowledge sharing can provide practical and technical support (Kroma, Reference Kroma2006; Warner, Reference Warner2008). Involvement with alternative ‘agri-food’ movements can help connect farmers with potential direct-sale customers in their local community (Seyfang, Reference Seyfang2007), draw visitors for agri-tourism enterprises (Holloway et al., Reference Holloway, Cox, Venn, Kneafsey, Dowler and Tuomainen2006), and attract volunteer or intern labor (Yamamoto and Engelsted, Reference Yamamoto and Engelsted2014). Cross-sectoral networks that include farmers, consumers and local or regional institutions, can help to mobilize support for policy change to ameliorate the obstacles that DFS face (Nelson et al., Reference Nelson, Brummel, Jordan and Manson2014). Not least, agroecological networks can promulgate the norms and narratives that motivate farmers to maintain DFS, and inspire new farmers to develop them in the face of a hostile environment (Carolan, Reference Carolan2006; Jordan et al., Reference Jordan, Bawden and Bergmann2008; Sanford, Reference Sanford2011; Ferguson and Lovell, Reference Ferguson and Lovell2014; Meek, Reference Meek2016).
The permaculture perspective on agricultural practice is similar to that of agroecology and agroforestry, emphasizing principles of diversity and multifunctionality in order to minimize risk, exploit synergies between systems, and reduce labor and external inputs (Mollison and Slay, Reference Mollison and Slay1997; Bane, Reference Bane2012; Falk, Reference Falk2013). Permaculture is distinctive in its advocacy for a holistic design approach to farm planning and for its practical emphasis on perennial and polyculture production systems (Toensmeier, Reference Toensmeier2011; Shepard, Reference Shepard2013; Ferguson and Toensmeier, Reference Ferguson and Toensmeier2014), integrated water management (Lancaster, Reference Lancaster2013), and the use of new and underutilized crops, as practical extensions of agroecological principles (Ferguson and Lovell, Reference Ferguson and Lovell2014). Unlike agroecology, permaculture does not have significant representation in academic institutions or in the scientific literature, nor official recognition from international development institutions or international farmer movements (De Schutter, Reference De Schutter2010; Rosset and Martínez-Torres, Reference Rosset and Martínez-Torres2012).
Adherents propose that the permaculture perspective on design and practice can support DFS in meeting the challenge of a hostile environment that overwhelmingly favors industrial agriculture—chiefly through the diversity-driven synergies in production. Based on widely available permaculture literature, we distill the permaculture agricultural model as follows (Mollison and Holmgren, Reference Mollison and Holmgren1978; Mollison, Reference Mollison1979, Reference Mollison1988; Frey, Reference Frey2011; Holzer, Reference Holzer2011; Bane, Reference Bane2012; Falk, Reference Falk2013; Shepard, Reference Shepard2013). Farms should be highly diversified, integrating crops and livestock, i.e., mixed farming. Tree crops (and other perennials) should be used extensively, especially in polycultures, both for their environmental value and as highly productive low-maintenance systems. Farmers should use the whole-system design tools of permaculture to carefully read the landscape, select land uses and crops, and place them in strategic relationships in the landscape. This process will enable farmers to leverage the diversity of these systems and generate synergies between components that will reduce or eliminate the need for external inputs and drastically reduce labor.
Little is known, however, about what happens when permaculture's universal principles touch down in the particular and concrete socio-environmental contexts in which farmers are working to earn their livelihood. By the admission of its founders, permaculture has been criticized for being impractical since its inception (Mulligan and Hill, Reference Mulligan and Hill2001; Holmgren, Reference Holmgren2002). A recent systematic review found that the permaculture literature makes overreaching and oversimplifying claims about diversified agroecosystems, and consistently downplays the complexity and risk faced by producers in managing highly diversified systems (Ferguson and Lovell, Reference Ferguson and Lovell2014). Permaculturists’ enthusiasm for perennials and polycultures has been criticized as ecologically naïve, conflating primary productivity with agricultural productivity (Williams, Reference Williams2001; Ferguson and Lovell, Reference Ferguson and Lovell2014; Smaje, Reference Smaje2014). Critics of permaculture describe it as a ‘pyramid scheme’, i.e., that permaculture education only prepares students for teaching permaculture and not for farming or other occupations (Trought, Reference Trought2015).
Permaculture has been largely ignored by researchers and academics (Veteto and Lockyer, Reference Veteto and Lockyer2008). Recent appearances of permaculture in the scientific literature suggest that this situation may be changing and offer counter-evidence to claims that permaculture is inherently impractical (Conrad, Reference Conrad2014; Morel et al., Reference Morel, Guégan and Léger2016). Recent studies notwithstanding, permaculture as a farming system remains poorly understood.
We help remedy these gaps in our understanding by conducting the first (to our knowledge) systematic assessment of permaculture farms, focusing on the critical issues of labor productivity diversification. Permaculture promises to help farmers improve labor productivity by leveraging synergies between diverse production enterprises. Our overarching objective is to assess the evidence for this claim by seeing whether diversification is associated with increasing labor productivity on US permaculture farms. In an earlier paper (Ferguson and Lovell, Reference Ferguson and Lovell2017), we characterized US permaculture farms based on type and diversity of sources of income, and developed a preliminary typology based on those characteristics. Our objective in this exploratory study builds on that characterization by modeling the effects on labor productivity of enterprise class, farm-level production diversity and level of involvement with permaculture.
Methods
Data collection
The data collection process has previously been described in detail in “Livelihoods and Production Diversity on US Permaculture Farms” (Ferguson and Lovell, Reference Ferguson and Lovell2017).
Research site selection
In the absence of any formal registry of permaculture farms, we identified prospective farms through iterative state-by-state internet searches, snowball referrals, posts to email lists and online forums, a referral form on the project website and a search of the local food networking database, localharvest.org. Between May 2012 and June 2013, we assembled a list of 170 prospective farms to consider for participation in the study. Between September and May 2013, we administered a short preliminary web survey to gather basic demographic information and assess scale of production, level of influence by permaculture on farm management and level of participation in the permaculture network (N=110). To facilitate farm selection, we used this data to generate two scores to represent scale of production and influence by permaculture. As coarse-grained preliminary measures, we used the outputs of this analysis exclusively in the site selection process. Within each of four scale classes, we selected the farms with the highest scores for influence by permaculture, generating a target sample of 56 farms (Ferguson and Lovell, Reference Ferguson and Lovell2017).
Farm research
Between June 2013 and January 2014, the lead author visited 48 sites distributed widely across the contiguous USA. The field researcher guided each farmer through a process of identification and ranking of enterprises, and allocation of labor, income and expenses, across farm enterprises through four seasons of the most recent completed year. Not all methods could be applied at every site, and therefore our analysis includes data from 36 of the visited farms. The 36 farms present in this analysis were distributed across the four regions of the USA, with 15 farms located in the West, eight in the South, seven in the Northeast and six in the Midwest.
DFS are likely to display a broad range of practices for record keeping and documentation. Our approach to dealing with the complexity and variety of DFS livelihoods is informed by the methodologies of Participatory Rural Appraisal—particularly through the use of ranking and allocation questions (Riley and Fielding, Reference Riley and Fielding2001). Our primary instrument was a spreadsheet workbook, administered on a tablet computer that allowed farmers to enter data using checkboxes, sliders, and drop-down menus, and iteratively adjust their responses as necessary. This approach helped accommodate farms with records and documentation ranging from extensive to none, as farmers could base their response on both their knowledge of time and financial quantities, as well as their understanding of proportions across seasons and enterprises.
Using the spreadsheet, farmers built up estimates of aggregate labor for each season from granular estimates of weekly person-hours across categories of household, hired, and intern labor, and across part-time and full-time positions. Farmers then allocated seasonal labor totals across six categories: up to five of the top income-producing enterprises and a sixth category, labeled mixed-minor, for any remaining enterprises after the top five. Farmers supplied figures for gross and net farm income, and then allocated gross income across categories—first between four seasons and then, within each season, across the same six categories as the labor allocation procedure above. The decision to gather detailed information about only the top five income producing enterprises was based on practical and time constraints, together with the assumption that these would provide an adequate picture of farm activities. The mixed-minor category represented a median 7% of farm-based income.
Data analysis
Enterprise classes
After cleaning and preprocessing, we sorted enterprises into classes and calculated farm totals for labor and gross income within each class. Classes consisted of annual crops, tree crops, other perennial crops, large livestock, small livestock, horticultural, funding (including grants and donations), teaching-consultation, other services and value-adding (the processing of yields into higher-value commodities – i.e., cheese from milk, preserves from fruit, etc.). As noted above, the sixth ‘everything else’ category (when present) from the labor and income allocation process was classified as mixed-minor.
Diversification
We quantified diversification as whole farm diversity and production diversity. Whole farm diversity was based on the distribution of income across all farm enterprises (including non-production enterprises) in order to assess overall levels of pluriactivity. We chose the Simpson index as a baseline diversity score, which is equivalent to the Herfindahl index used in econometric analysis and reflects both number of enterprises and evenness of the distribution (Villano et al., Reference Villano, Fleming and Fleming2010). The resulting score ranges 0–1, with 0 indicating all income from a single enterprise, and 1 indicating income spread evenly across all six enterprise categories. We used the same metric to calculate production diversity, in this case using the distribution of labor across all production enterprises in order to investigate the effects of spreading labor inputs across multiple kinds of production. For ease of interpretation and comparison, following procedures for calculating effective species richness used in numerical ecology, we also converted the Simpson index to effective number of enterprises—i.e., the number of enterprises with perfectly evenly distributed labor or income that would produce the same raw Simpson diversity score (Smith and Wilson, Reference Smith and Wilson1996)—for ease of interpretation.
Our measure of production diversity reveals important information about the functioning of DFS, but is only a very rough indicator of biophysical diversity. Our classification of enterprises into high-level categories—such that, for example, all annual crops are grouped in a single category—does support the assumption that enterprise classes are related to categories of land use. However, the amount labor or income associated with enterprise has a variable relationship with the extent of the land use in which that enterprise is based. Likewise, the distribution of labor across categories does not reveal anything about the complexity and structure of the landscape, the level of integration between enterprises, or level of species and varietal diversity within enterprises.
Modeling labor productivity
We assessed the drivers of enterprise-level labor productivity using a multilevel modeling (MLM) approach. We followed conventional approaches to modeling productivity by specifying an input (labor) as a predictor and an output (income) as the response variable (Debertin, Reference Debertin2012). The intercept and coefficient for labor account for overall mean levels of labor productivity and returns to scale. The coefficients of additional predictors included in the model reveal how they shift returns to labor up or down away from the overall mean. We use MLM in place of the frontier methods most commonly used in efficiency analysis, i.e., stochastic frontier analysis (SFA) and data envelopment analysis (DEA). While MLM has not been widely used in the analysis of efficiency in agricultural economics, it has been applied successfully in efficiency analysis in education (Johnes, Reference Johnes2006) and health care (Grassetti et al., Reference Grassetti, Gori and Minotti2005). We took this approach for several reasons. SFA and DEA calculate a production frontier that represents maximum efficiency such that all observations fall on or below the frontier—unlike MLM, which produces a line of best fit describing “average” efficiency, with observations falling both above and below. While frontier approaches have proven themselves useful for the multi-input/multi-output analyses of total factor productivity, our model focuses on the simpler metric of partial labor productivity, i.e., returns to labor (Coelli et al., Reference Coelli, Rao, O'Donnell and Battese2005). SFA and DEA both impose statistical constraints that limit their application for this project—most importantly, methods for comparing individual enterprises nested within a relatively small sample of farms are not well developed for either DEA or SFA (Kumbhakar and Lovell, Reference Kumbhakar and Lovell2003; Hoff, Reference Hoff2007; Simar and Wilson, Reference Simar and Wilson2007, Reference Simar and Wilson2011; McDonald, Reference McDonald2009). Using an MLM approach with farm as a random effect allows for the assessment of the drivers of labor productivity at the enterprise level while accounting for farm-level variability driven by unmodeled or unmeasured variables such as capitalization, farmer skill and local economic conditions (Gelman and Hill, Reference Gelman and Hill2006).
Response variable
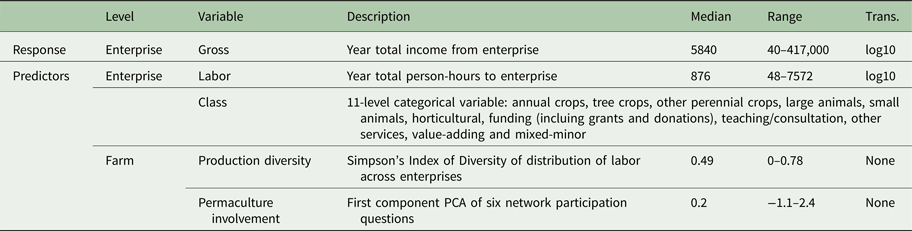
Our response variable was the log-transformed gross income for each enterprise. Table 1 shows the level (i.e., enterprise-level or farm-level) and numeric range of all variables used in the model, along with any transformations applied.
Table 1. Level, numeric range and transformation (if any) of variables used in the model.

The medians of farm level variables are calculated for 36 farms rather than 196 enterprises.
Enterprise-level predictors
We specified the log-transformed total labor inputs (as the year total person hours) as a predictor for each individual enterprise. Also at the enterprise level, we also included the 11-level categorical variable representing enterprise class, specifying treatment contrasts and using annual vegetable production as the reference level.
Farm-level predictors and interactions
We included the production diversity score as a measure of the effects of spreading labor out evenly across multiple types of production. In order to assess the effects of diversification on different kinds of production, we specified an interaction between the production diversity score and each production enterprise class. In order to investigate whether involvement with permaculture helps farmers manage diverse production to generate synergies, we specified an interaction between involvement with permaculture and production diversity. To reduce model complexity and avoid multicollinearity, we did not include whole farm diversity as a predictor.
We assume that the level of involvement with permaculture varies between farms, and that this may shape important differences in the degree to which permaculture concepts are being applied. To account for this variation and assess whether involvement with permaculture is supporting farmers in managing diverse production, we included network participation as a proxy for involvement and specified an interaction with production diversity. To generate our proxy measure, we calculated a score for network participation based on the 110 responses from the preliminary survey. In this survey, farmers answered six questions concerning their mode and frequency of involvement with the permaculture network: how many times in the previous 6 months they had participated by giving advice to, and receiving advice from other permaculturists, giving or receiving aid in the form of labor or materials, and attending and hosting events. To reduce dimensionality we conducted a principal components analysis on these 6 variables using the prcomp function in the R base package R Development Core Team (2013). After conducting parallel analysis using the nScree function in the nFactors package (Raiche and Magis, Reference Raiche and Magis2010), we retained the first component for inclusion in the model.
We fit a random intercept model, allowing for a different mean productivity levels across farms but assuming a consistent overall mean effect of scale (Gelman and Hill, Reference Gelman and Hill2006). The full model can be presented as follows:
 $$\eqalign{{\rm Incom}{\rm e}_{ij}\; = \,\,& {\rm \gamma} _{00} + \; {\rm \gamma} _{10}{\rm Labo}{\rm r}_{ij} + \; {\rm \gamma} _{20}{\rm Clas}{\rm s}_{ij} + \; {\rm \gamma} _{01}{\rm Diversit}{\rm y}_{1j} \cr & + \; {\rm \gamma} _{02}{\rm Involvemen}{\rm t}_{2j} + {\rm \gamma} _{21}{\rm Clas}{\rm s}_{ij}{\rm Diversit}{\rm y}_j \cr & + \; {\rm \gamma} _{22}{\rm Involvemen}{\rm t}_j{\rm Diversit}{\rm y}_j + \; u_{0j} + e_{ij}} $$
The subscripts i and j index the individual enterprise and the farm, respectively, such that Incomeij represents the gross income (log10) for the ith enterprise of the jth farm. The overall mean intercept, adjusted for the farm-level variables, is represented by γ00. All other γ’s represent the regression coefficients associated with their adjacent variable. Labor and Class represent hours of labor (log10) and enterprise class. Diversity represents the farm-level production diversity measure and Involvement represents the network participation measure. Random error is represented at the farm-level by u oj and at enterprise-level by e ij.
We used the lmer function in the lme4 R package to fit the random intercept model with Restricted Maximum Likelihood on 198 individual enterprises nested within the 36 farms (Bates et al., Reference Bates, Mächler, Bolker and Walker2015). Inspection of outliers (with standardized residuals greater than 2 standard deviations from zero) revealed 2 problematic observations in which labor or income were inappropriately classified or aggregated during data collection. We refit the model with 196 enterprises after removing these observations. The significance of the random effect was assessed with a permutation-based exact likelihood ratio test using the exactLRT function in the R package RLRsim (Scheipl et al., Reference Scheipl, Greven and Küchenhoff2008). The significance of predictors was estimated using the confint.merMod function of the lme4 package, via a 10,000 iteration semiparametric bootstrap, which resamples response residuals with replacement while maintaining the initial estimates of random effects. We calculated model effect size in two ways: marginal r 2, which treats fixed effects only and ignores the random effect, and conditional r 2, which accounts for the variance of the random effect (Nakagawa and Schielzeth, Reference Nakagawa and Schielzeth2013).
Results
Farm characteristics and typology
Farm characteristics and typology summarized here are discussed in detail in Ferguson and Lovell (Reference Ferguson and Lovell2017). Our sample of farms was highly variable, with a high proportion of young farmers, new farmers, new farms and small farms. Production zones ranged from 2 to 1,500 acres in size, with a median value of 10 acres. Farm gross revenue ranged from US$2000 to 800,000, with a median value of US$43,700. Net revenue ranged from − US$40,000 to 60,000, with a median of US$4400. As is typical for US farms, most farms in our sample relied on off-farm income (USDA-NASS, 2016). The contribution of farm-based income to total household income ranged from 0 to 100%, with 13 farms reporting 50% of household income or more from farm-based activities, and 10 farms reporting 10% or less household income from farm-based activities. Farms ranged from 1-year-old to an intergenerational family farm of 100 years, with a median of 9.5 years. Total household income, for the 27 farms that supplied it, ranged from US$6,060 to 445,000, with a median of US$38,750. Our sample was 65% male, with 17 women and 32 men—resembling the national breakdown of 70% male farmers. All participating farmers were white, as compared with 95% of farm operators nationally (USDA-NASS, 2014b). The mean age of farmers in our sample was 43, notably lower than the national mean of 58 (USDA-NASS, 2014a). Note that values for gender, race and age are based on 49 farmers in total, as 13 of the farms in our sample were associated with more than one operator.
The authors previously developed a preliminary typology of US permaculture farms based on cluster analysis of sources of income for the farms in our sample (Ferguson and Lovell, Reference Ferguson and Lovell2017). The analysis identified five categories: small mixed farming, integrated production, animal base, service base and service-production. The largest grouping was the small mixed farming cluster (N = 10), which generated a majority of income from a mix of annual and perennial production, alongside other production and non-production enterprises. The grouping with the greatest mean scale of production (via gross income) was the integrated production cluster (N = 5), including farms that receive the bulk of their income from a mix of animal and perennial production systems. Farms in the animal base cluster (N = 5) generated the largest fraction of their income from animal enterprises. Farms in the service base cluster (N = 9) generate little income directly from production—though some are practicing significant production activities that are subsumed into value-adding or service enterprises. Service-production farms (N = 7) have income distributed proportionally across annual production, animal production and some form of non-production enterprise. Contrary to perceptions of permaculture as an educational movement having little to do with working farms, four out of five clusters generate significant income from production.
Diversification
Whole farm diversity, which represents the distribution of income across all enterprises, was rendered as effective number of enterprises (see the section Diversification above) and ranged from 1.1 to 5.6, with a median of 3.6. Note that the maximum possible score would be 6, as the distribution of income was assessed across the top 5 grossing enterprises and a 6th category containing all other sources of revenue. A score of 6 would indicate that gross revenue was evenly distributed across all 6 categories. If the 6th category was disaggregated into individual revenue sources the effective enterprises for most farms would be higher.
Production diversity, based on the distribution of labor across all production enterprises and effective number of enterprises, ranged from 0 (no revenue directly from production) to 4.6, with a median of 2. Note that the maximum possible score here was 5, which would indicate revenue distributed evenly across 5 production enterprises, as the mixed-minor category contained an unknown mix of enterprise classes and was therefore not included in the calculation. It is important to note that for several farms, significant production activities were subsumed within value-adding or service enterprises, and production is therefore underestimated in this analysis.
Modeling labor productivity
Overall model fit
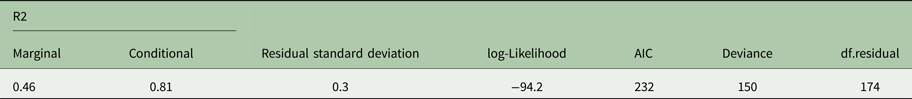
We estimated goodness of fit using marginal r 2, which corresponds to the amount of variation in the dependent variable by the fixed effects alone, and conditional r 2, which includes the random effect and thereby accounts for farm-level variation. Model marginal r 2 was 0.46 and conditional r 2 was .81 (Table 2). The differences between marginal and conditional r 2 supports the use of farm as a random effect. We formally tested the random effect using permutation-based exact likelihood ratio test, which also showed that including farm as a grouping variable significantly improved the model fit (LR = 109, P < 2.2e-16).
Table 2. Model summary values and goodness-of-fit measures.
Effects of predictors
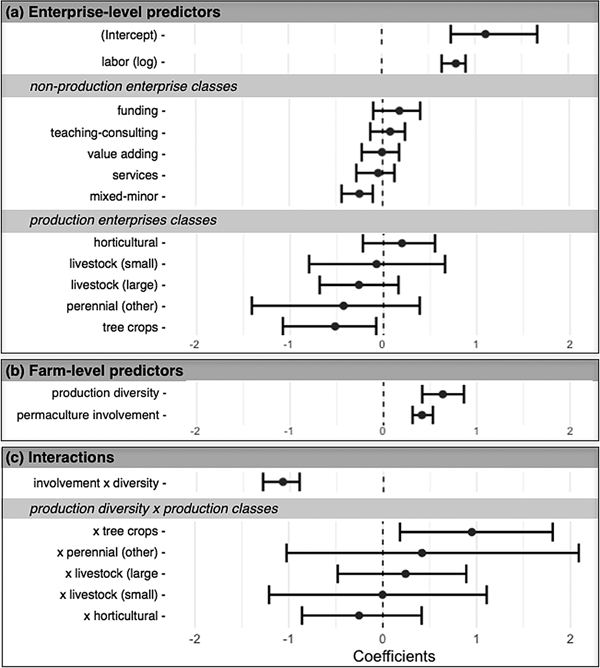
Using the semiparametric bootstrap to generate 95% confidence intervals, we identified multiple significant associations between the predictors and labor productivity. Coefficient estimates and confidence intervals for all predictors are shown in Figure 1. Effects are considered significant when the 95% confidence interval does not span zero.
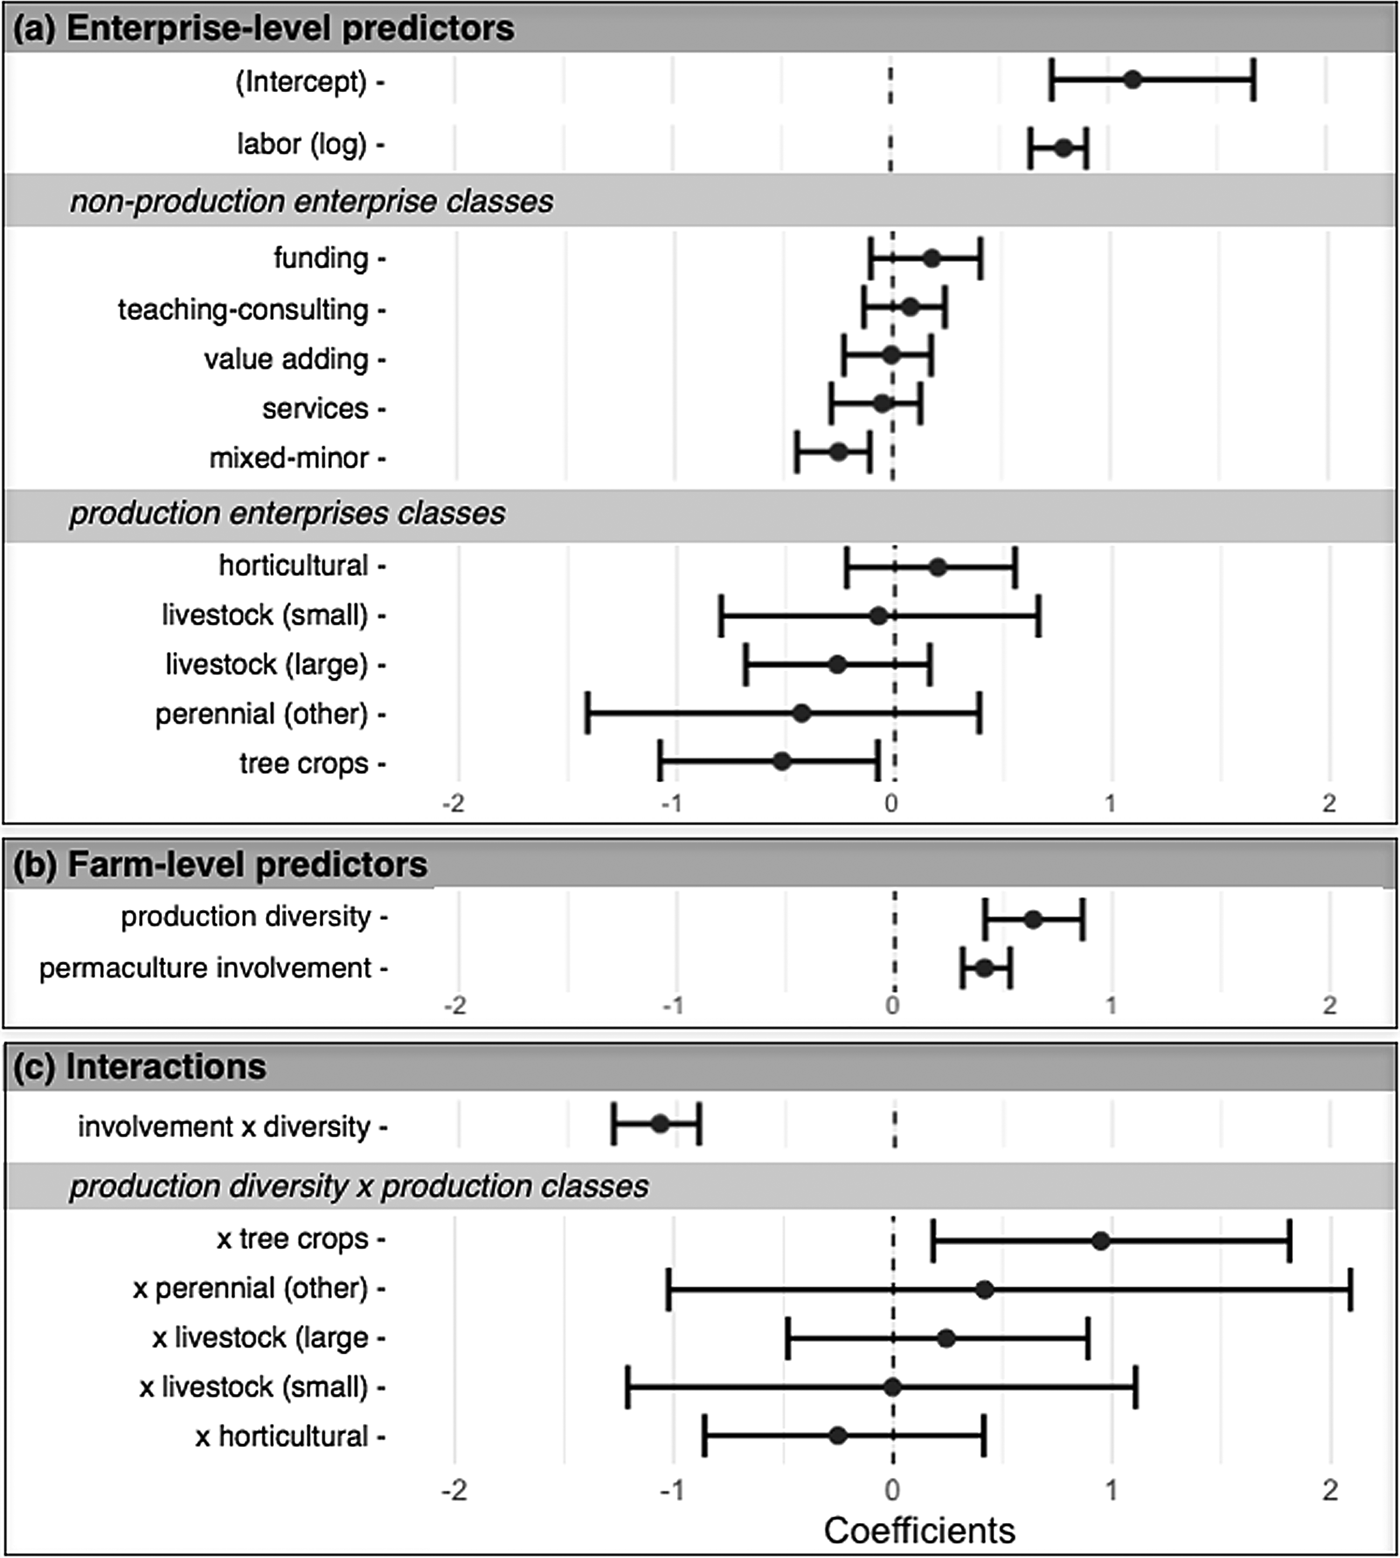
Fig. 1. Coefficient plot for all predictors from multilevel model of labor productivity. Response variable is gross income. Error bars represent semiparametric bootstrapped 95% confidence intervals. The dotted line at zero, against which effects of predictors are compared, represents the mean labor productivity for annual vegetable enterprises. Effects are considered significant if the confidence interval does not span zero.
Enterprise-level predictors
The model intercept reflects (the base-10 log of) the overall mean gross income per hour of labor (Fig. 1a) adjusted for farm-level variables. The coefficient for labor (also log10) represents returns to scale, i.e., the degree to which increased labor inputs generate increased returns per hour of labor. Given the variation among farms and enterprise classes, we do not believe it is useful to interpret the estimated values for the intercept and labor coefficient themselves, and instead focus our discussion on the strength and direction of the other effects in the model. The coefficients of the enterprise class variables then show how labor productivity for these classes diverges from the overall mean. Of the non-production enterprise classes, the negative influence of the mixed-minor class is the only significant effect. Of the production enterprise classes, the negative influence of tree crops is the only significant effect. All enterprise classes were compared with the reference category of annual vegetable production, which is represented by the dotted zero line in Figure 1a. As the production classes are involved in a higher-order interaction with production diversity, their conditional effects require caution in interpretation.
Farm-level predictors and interactions
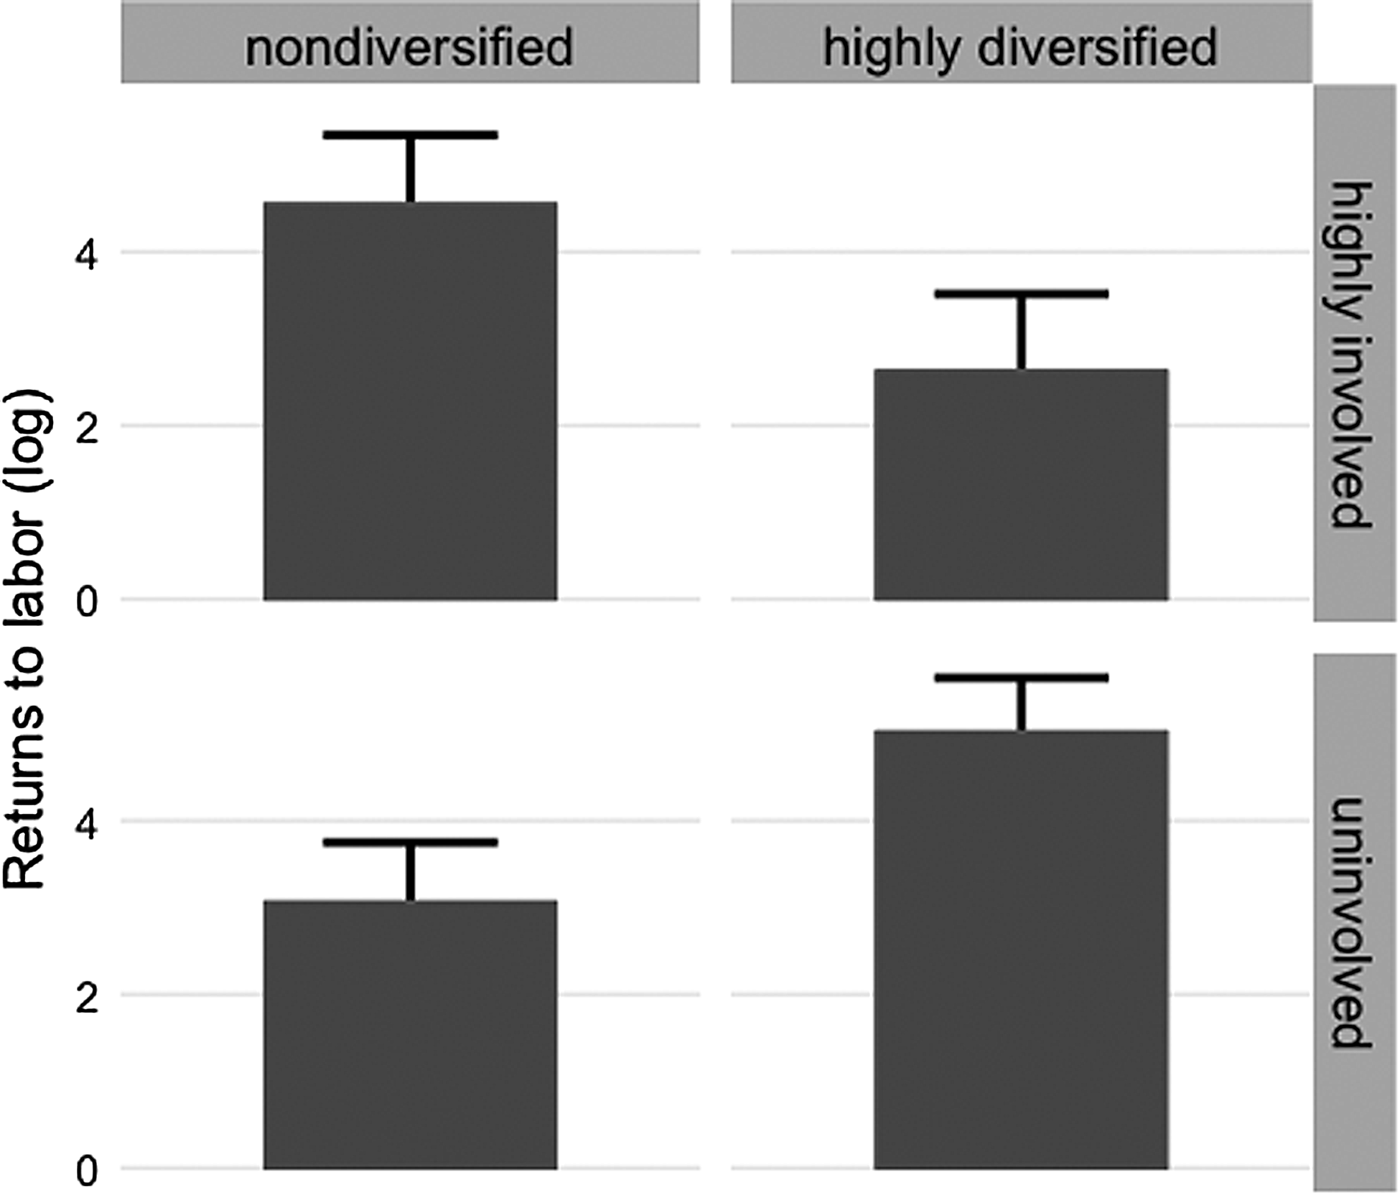
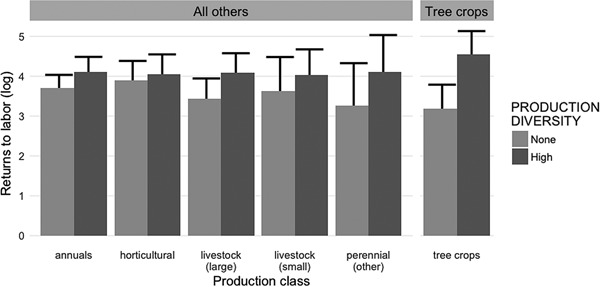
Production diversity and permaculture network involvement each have significant positive effects on returns to labor (Fig. 1b). As the interpretation of interaction effects is difficult from coefficients alone, we supplement the coefficient plot with effect display plots for the each of the interactions in the model. We used R package effects (Fox, Reference Fox2003) to generate fitted values from the model across the ranges of the interacting variables, with other predictors held constant at typical values (Figs 2 and 3). Figure 2 illustrates how the significant negative interaction between production diversity and involvement with permaculture means that the positive effects of these variables disappear as each variable approaches their maximum values. Figure 3 shows the strongly positive interaction between production diversity and tree crops, shifting tree crops from the lowest labor productivity to the highest. It is the only significant interaction between production diversity and any production class.

Fig. 2. This effect display visualizes the interaction between production diversity and involvement with the permaculture network, showing model fitted values across the ranges of the two variables, with other predictors held constant at typical values. At low levels of involvement, diversification has a significant positive effect on labor productivity. At high levels of involvement, the observed negative effect of diversification is not significant.
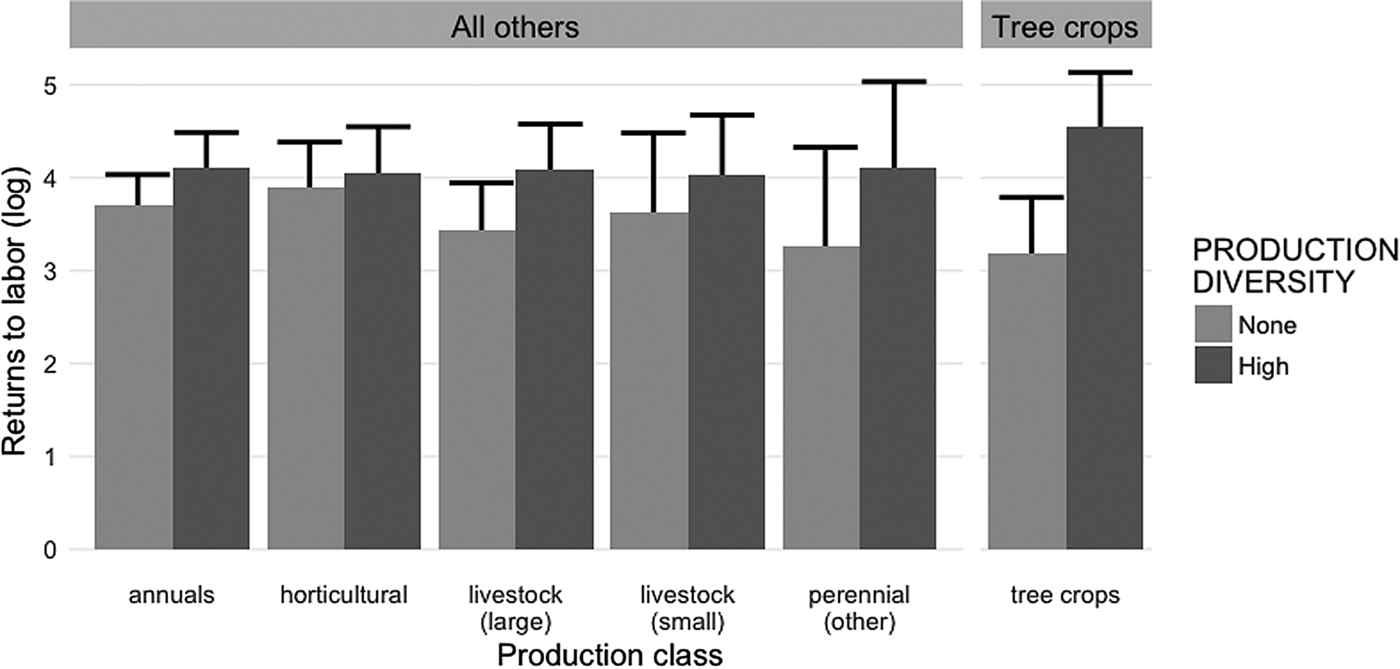
Fig. 3. This effect display visualizes the interaction between production diversity and the production enterprise classes, showing model fitted values across the ranges of each variable, with other predictors held constant at typical values. Lighter bars represent the condition of no diversification, i.e., the farm has only one production enterprise. Darker bars represent full diversification: even sharing of labor across all production enterprises. The only significant effect is for the interaction with tree crops. Production diversity shifts tree crops from the lowest labor productivity to the highest.
Discussion
Identifying labor productivity as a critical parameter for DFS operating in competition with industrial agriculture, we fit a multilevel model to assess the effects of production diversity and involvement with permaculture on labor productivity across different classes of enterprises. Our model revealed significant positive effects of production diversity on the labor productivity of tree crops, and of diversified production on returns to labor generally. The model also revealed a complex negative interaction between overall production diversity and involvement with the permaculture network, such that high levels of participation negate the benefits of diversified production and/or vice versa.
Economies and diseconomies of scope
Our model shows evidence of synergies derived from spreading labor out across more production operations rather than concentrating it among fewer. Our measure of overall production diversity, representing both the number of production enterprise classes and the evenness of labor distribution among them, shows a significant positive (conditional) effect on returns to labor. There is not, however, evidence that high levels of active involvement with permaculture provide support to farmers in generating synergies from highly diverse production. Rather, at high levels of participation, the benefits of diversification disappear. Farmers that are both managing diverse production systems and participating heavily in the network are likely experiencing diseconomies of scope – they may be too overextended to allocate labor effectively and strategically (Chavas, Reference Chavas2008).
The strong interaction with production diversity shifts tree crops from the lowest level of observed labor productivity to the highest. Whether this effect is due to decreasing the labor required to maintain tree crop production without reducing the value of the harvest, or increasing the value of the harvest without adding labor, some combination of the two, or some other effect, is unknown. This finding is an encouraging first piece of evidence that permaculturists are increasing the financial viability of tree crops through strategic combination with other production systems.
Neither magic wand nor pyramid scheme
Our results provide support for the presence of production synergies in DFS, and for the role of permaculture in helping farmers achieve these synergies. This analysis comes with caveats, however. First, the most simplistic versions of advocacy for tree crops suggests that they are intrinsically labor productive. This notion receives little support from our analysis, as conditional effect of tree crops shows them to have the lowest labor productivity of all enterprise types at mean levels of diversification. At the same time, our results provide strong support for a more sophisticated version of this proposal: that tree crops can be economically productive low-labor systems when strategically integrated with other production systems.
Our second caveat is the negative relationship between production diversity and involvement with permaculture, which seems to reinforce the criticism of permaculture as impractical (Williams, Reference Williams2001). The significant conditional effects of these two predictors limits this critique: our model shows that at mean levels of production diversity, involvement with permaculture increases labor productivity, and at mean levels of involvement, production diversity does likewise. Farm characteristics also bear on this question—the apparent low median net income of the farms (US$4400) could be read as lending strength to the criticism. This too must be moderated by the fact that median net income for US farms is consistently negative and has been so for decades (USDA-NASS, 2017).
Questions of the practicality of DFS are of clear interest to diversified farmers and their supporters, and labor productivity is one good indicator of practicality. Discussions of practicality, however, often focus exclusively on farm level issues and neglect the fact that what is considered practical is also determined by the relationship between the farm and the policy and market environment in which it operates. It may be too much to ask that a permaculture approach should simply neutralize the mismatch between DFS and an industrialized food system (Iles and Marsh, Reference Iles and Marsh2012; Bowman and Zilberman, Reference Bowman and Zilberman2013). It is more reasonable to ask whether involvement with permaculture supports farmers in navigating a hostile environment while maintaining (or developing) diversified production. The positive impact of network participation at low levels of production diversity suggests that permaculture may act as a form of cultural capital that supports the development of cultural service enterprises such as teaching, consulting and grant-making (Valdivia and Barbieri, Reference Valdivia and Barbieri2014). Income from such non-production enterprises can provide support during the extended maturation of diversified and perennial farming systems, and buffer mature DFS from the vicissitudes of the market and policy environment.
Limitations and future research
This project is exploratory and is most suitable for identifying questions for further investigation rather than drawing firm conclusions. Further research should strengthen the basis for statistical inference with larger samples sizes and by correcting likely selection bias. In the process of soliciting and scheduling farms—most of which occurred in the summer and fall–we believe there was a pattern of greater difficulty scheduling with more intensive production-oriented farms, such that our sample is probably biased toward farms with non-production livelihoods.
Our methods underestimate significant production activities in our sample in two ways. First, we categorized as production only those enterprises that generated income directly from the sale of agricultural products. Production that fed into value-adding and/or service enterprises could not be effectively tracked with our survey instrument. Secondly, while we gathered basic information about subsistence production (cf. Ferguson and Lovell, Reference Ferguson and Lovell2017), there was no way to account for it within the scope and terms of this analysis. Many of the farm enterprises classified as value-adding and services were connected with significant production activities, and many of the farms managed diverse and sometimes extensive production for on-farm consumption.
In this study, we are only able to address one of two critical questions relating to permaculture and diversification. The first question involves biophysical productivity, and whether permaculture farms are able to exploit complementarity between crops and land uses to design overyielding polycultures. This question remains within the black box of biophysical productivity, unaddressed by this study. We address the second question of whether permaculture-identified farmers are able to translate production diversity into economic synergies. Biophysical synergies remain a critical question, even as we here address the question of how DFS are able to navigate the political-economic context of industrialized agricultural systems—and whether permaculture offers meaningful support in doing so.
More research is needed to expand the scope of this study with a larger sample and a systematic sampling plan—including a visitation schedule that will allow the participation of more production-oriented farms. Farms that show evidence of biophysical and economic synergies should be studied in greater depth to build understanding of the combinations of species, farm and farmer characteristics, planning strategies and contexts that support farmers in generating such synergies. In particular, qualitative research is needed to identify how the conceptual tools of permaculture are involved in this process. Given the distinctive focus of permaculture on design and spatial configuration, the integration of spatial analysis into future farm research—on and off permaculture-identified farms—is a fruitful avenue for inquiry.
Conclusion
In this study, we conducted the first systematic research into permaculture farming, helping to remedy the lack of systematic understanding of permaculture as farming practice and agroecological network. Like other small and diversified agriculturalists, permaculture farmers face formidable obstacles and employ a familiar variety of strategies in order to develop or maintain diversified agroecosystems. Permaculture farmers are managing diversification in ways that increase labor productivity, as well using non-production enterprises to create a buffer between the agroecosystems they manage and the uncertainty and risk of a globalized market. This should act as a moderating influence both on permaculture's most enthusiastic advocates and vociferous detractors. The practicality of a form of production is determined in large part by the political-economic context in which it operates—the only ‘practical’ forms are those supported by the status quo. It is disingenuous to criticize permaculture for failing to outcompete industrialized agriculture on its home turf. We can and should criticize permaculturists when they misrepresent the possibility of doing so. This latter question—of whether the content of programming offered by permaculture farms reflects an honest appraisal of the challenges and risks of diversified production—is worthwhile but not possible to address in this study.
The practices and techniques advocated for by permaculture, like those of agroecology, are largely drawn from traditional practices that are embedded in contexts in which labor is inexpensive relative to food and other commodities, and in which the cultural fabric of reciprocity and mutual aid—the ‘moral economy’—is largely intact (Altieri, Reference Altieri1999; Meert et al., Reference Meert, Van Huylenbroeck, Vernimmen, Bourgeois and van Hecke2005). We should not be surprised that farmers have difficulty supporting themselves on production alone using these approaches in a context of expensive labor, cheap commodities and a largely disintegrated moral economy (Kloppenburg et al., Reference Kloppenburg, Hendrickson and Stevenson1996; Holt-Giménez, Reference Holt-Giménez2016). Nor should this prompt us to reject the efforts of grassroots efforts to inspire and inform such production.
National agricultural policy and international trade agreements will not be replaced simply by action at the level of individual farms or even of the regional food systems. The task of demonstrating alternatives is critical, but the implementation of ‘ideal’ diversified production systems within the existing system is a formidable task if not utopian. It is reasonable to expect that DFS will incorporate varying levels of pluriactivity, including off-farm income, to maintain their livelihood. The exorbitant claims of some permaculture authors and practitioners are not supported by this study. Neither does it offer support to the detractors’ claim that permaculture is fundamentally fraudulent. It appears that permaculture does offer support to farmers managing diversified systems, but unsurprisingly does not neutralize the challenges of the hostile environment they face. At the same time, grassroots movements such as permaculture play an important part in mobilizing and supporting the networks that create the conditions for systemic change (Nelson et al., Reference Nelson, Brummel, Jordan and Manson2014). Until the political and economic trajectory of US agriculture changes, the reliable path to economically robust and diversified production is likely to remain elusive.
Acknowledgements
We would like to thank the 48 farmers who took time from their schedules in 2013–2014 to participate, and the 196 crowdfunding donors whose contributions made the field research possible. This project was supported by funds from the EUs 7th Research Framework Programme project (FP7) “Bottom-up Climate Adaptation Strategies towards a Sustainable Europe” (Grant Agreement 308337) and the Agroecology Scholars Fund of the Agroecology and Sustainable Agriculture Program at University of Illinois at Urbana–Champaign.