


NOMENCLATURE
- CD
-
drag coefficient (-)
- CL
-
lift coefficient (-)
- COC
-
Cash Operating Cost, USD
- DMC
-
Direct Maintenance Cost, USD
- E
-
Energy, kWh
- ESAR
-
Energy Specific Air Range, nm/kW.h
- FH
-
Flight Hours, h
- FB
-
fuel burn, kg
- FN
-
reference thrust, N
- HE
-
degree-of-hybridisation for stored energy (–)
- HP
-
degree-of-hybridisation for power (–)
- L/D
-
lift-to-drag ratio (–)
- M
-
Mach number (–)
- MAC
-
Mean Aerodynamic Chord, m
- MLW
-
Maximum Landing Weight, kg
- MTOW
-
Maximum Take-off Weight, kg
- MZFW
-
Maximum Zero-Fuel Weight, kg
- OWE
-
Operating Weight Empty, kg
- OPR
-
Overall Pressure Ratio (-)
- P
-
Power, kW
- PSFC
-
Power Specific Fuel Consumption, g/W.h
- SW
-
Reference wing area, m2
- TSFC
-
Thrust Specific Fuel Consumption, g/kN.s
- AC
-
Alternating Current
- AEA
-
Association of European Airlines
- AEO
-
All-Engines Operational
- AGB
-
Accessory Gear Box
- AIS
-
Anti-Ice System
- ARCHn
-
Voltaic-Joule/Brayton motive power system design candidate n
- ATA
-
Air Transport Association
- ATLeRs
-
Aircraft Top-Level Requirements
- Batt or BATT
-
Battery
- BC
-
Battery Controller
- BTC
-
Battery Thermal Controller
- CO2
-
Carbon dioxide
- CRZ
-
Cruise
- CS
-
European Aviation Safety Agency regulations
- Ctlr
-
Controller
- DC
-
Direct Current
- DSG
-
Design Service Goal
- ENR
-
Energy
- eM
-
Electrically-driven Motor
- ECS
-
Environmental Control System
- EIS
-
Entry-Into-Service
- Elec
-
Electrical
- FAR
-
Federal Airworthiness Regulations
- FCS
-
Flight Control System
- FL
-
Flight Level, hundreds of feet
- GA
-
Go-Around
- Gen. or GEN
-
Generator
- GT
-
Gas-Turbine
- HPC
-
High-Pressure Compressor
- HPT
-
High-Pressure Turbine
- IFR
-
Instrument Flight Rules
- ISA
-
International Standard Atmosphere
- LG
-
Landing Gear
- LPT
-
Low-Pressure Turbine
- LRC
-
Long-Range Cruise speed
- Max.
-
Maximum
- M/G
-
Motor/Generator
- MTO
-
Maximum Take-Off (rating)
- NASA
-
National Aeronautics and Space Administration
- NOx
-
Nitric oxide (NO) and nitrogen dioxide (NO2)
- OEI
-
One Engine Inoperative
- OML
-
Outer Mould Lines
- PACIFYC(E)
-
Propulsive ArChItecture For hYbrid Commuters (Engine)
- PAX
-
Passengers
- PPS
-
Propulsion and Power System
- Red.
-
Reduction gearbox
- REF2030(E)
-
Year 2030 reference aircraft, projected state-of-the-art (Engine)
- RMS
-
Root Mean Square (voltage)
- SL or SLS
-
Sea-Level Standard/Static conditions
- SoAR(E)
-
State-of-the-Art Reference aircraft (Engine)
- SRIA
-
Strategic Research and Innovation Agenda
- STD
-
Standard Deviation
- Th
-
Thermal
- T/O
-
Take-Off
- USD
-
US Dollars
- VJB
-
Voltaic-Joule/Brayton motive power combination
Symbols
Abbreviations and Acronyms
1.0 INTRODUCTION
The primary aim of deploying hybrid-electric technologies on aircraft is to seek pragmatic, appropriately projected engineering solutions in meeting aggressive emissions and noise targets as declared by the European Commission Flightpath 2050 document(1) and associated Advisory Council for Aviation Research and Innovation in Europe (ACARE) Strategic Research and Innovation Agenda (SRIA)(2), the US National Aeronautics and Space Administration (NASA) Aeronautics Strategic Implementation Plan(3-5), the International Air Transport Association (IATA)(6) by way of the Air Transport Action Group (ATAG)(7), and the International Civil Aviation Organization (ICAO)(8). In the context of this technical article, the term “hybrid-electric” covers concepts that employ some form of parallel and/or serial combinatorial power-train arrangement that utilises a kerosene-based thermal engine and batteries only as the main source of energy for advanced electrical motor(s). The resulting arrangement is referred to here as Voltaic-Joule/Brayton (VJB) motive power systems.
Previously published investigations(Reference Isikveren, Pornet, Vratny and Schmidt9-Reference Miller17) focused on the conceptual design and discussion of parametric sensitivities associated with hybrid-electric motive power systems for commercial aircraft accommodating 50-180 Passengers (PAX) servicing short-haul operations and targeting year Entry-into-service (EIS) of 2035+. Upon declaration of a dual objective comprising relative block fuel reduction and operating economics, and, after comparing and contrasting the relative merits of several “tube-and-wing” compatible propulsion system layouts, it was concluded in Ref. Reference Isikveren, Pornet, Vratny and Schmidt9 that for regional and narrow-body aircraft, a “distributed parallel” tri-fan configuration comprising two under-wing podded gas-turbines and one advanced Normal Conducting Motor mounted in the aft-fuselage as an S-duct installation could be an appropriate morphological choice. The research outcome also provided tell-tale signs that smaller scale commercial transports can be construed as being the “critical design case”. This means as current industry research and development activities focus on smaller aircraft types, pragmatic technical solutions fashioned for this class of aircraft will serve to become a favourable “fall-out” as larger-scale aircraft are considered in the future.
1.1 Parametric descriptor convention, figures-of-merit and synthetic objectives
The degree-of-hybridisation employed in advanced VJB-based motive power systems cannot be suitably represented by a single parametric descriptor. As argued in Ref. Reference Isikveren, Pornet, Vratny and Schmidt9, a full description of any generic hybrid Propulsion and Power System (PPS) requires two descriptors involving an account of both the alternative energy [source] and that of the entire PPS: one ratio comparing each of the maximum installed (or useful) powers (HP); and a second ratio comparing the extent of energy storage (HE) of each:
 $$\begin{equation}
{H_P} = \frac{{{P_{{\rm{EL}}}}}}{{{P_{{\rm{TOT}}}}}}\;{\rm{and}}\;{H_E} = \frac{{{E_{{\rm{EL}}}}}}{{{E_{{\rm{TOT}}}}}}
\end{equation}$$
$$\begin{equation}
{H_P} = \frac{{{P_{{\rm{EL}}}}}}{{{P_{{\rm{TOT}}}}}}\;{\rm{and}}\;{H_E} = \frac{{{E_{{\rm{EL}}}}}}{{{E_{{\rm{TOT}}}}}}
\end{equation}$$
For a hybrid-electric solution, P EL represents the maximum installed (or useful) electrical power, and P TOT the total PPS installed or useful power (motor and thermal engine), E EL the total stored electrical energy, and E TOT the total stored energy of the entire PPS (electrical +kerosene).
The reader should be mindful about terminology the authors use when it concerns power: “installed” infers supplied power (what the battery or kerosene fuel delivers) corrected for energy conversion efficiency; and “useful” is taken to be installed power additionally corrected for transmission and propulsive efficiencies. Furthermore, the convention adopted for HE in this technical article alludes to the total energy available to the aircraft, i.e. the ratio of total electrical energy utilised for all phases of operation (whether block and/or diversion-contingency segments) normalised by the total energy comprising release fuel and electrical energy utilised for all phases of operation (whether block and/or diversion-contingency segments).
An equitable comparison calls for the possibility of examining a set of hybrid-electric aircraft PPS that deliver the same relative block fuel reduction or Energy Specific Air Range (ESAR) outcome. The ESAR figure-of-merit is fashioned to quantify distance travelled per unit of expended energy(Reference Isikveren, Pornet, Vratny and Schmidt9), viz.
 $$\begin{equation}
{\rm{ESAR}} = \frac{{dR}}{{dE}} = \frac{{\eta \left( {{L
/ D}} \right)}}{{mg}}
\end{equation}$$
$$\begin{equation}
{\rm{ESAR}} = \frac{{dR}}{{dE}} = \frac{{\eta \left( {{L
/ D}} \right)}}{{mg}}
\end{equation}$$
The parameter dR/dE, which is pertinent for the evaluation of an overall block segment, represents the rate change in aircraft range for given change in expended system energy, η is the overall (combined exergetic) motive power system efficiency, L/D is the aircraft instantaneous lift-to-drag ratio, m is the aircraft instantaneous gross mass, and g is acceleration due to gravity.
Since the primary objective of this initial technical assessment study was to maximise the extent of emissions reduction over the entire payload-range working capacity, a special purpose top-level sizing algorithm was fashioned based upon the premise of meeting multiple constraints. Using a suitably projected utilisation spectrum for the aircraft, a generic multi-objective set could be fashioned in the manner presented by Fig. 1.

Figure 1. Generic block fuel reduction multi-objectives for overall aircraft sizing.
Here, RDSG indicates the stage length corresponding to the Design Service Goal (DSG) of the aircraft, RDES is the expected Max PAX range capability and RTAR denotes the stage length wherein a significant block fuel reduction should be realised. As a general rule, RTAR should aim to capture cumulatively 80-90% of all projected departures. In essence, Fig. 1 provides opportunity for hybrid-electric transports to still meet desired longer-range capability whilst at the same time accommodating significant reductions in emissions for a majority of aircraft departures. For example, a hybrid-electric transport could conceivably have design weights defined by the case RTAR; assuming these design weights remain fixed, an energy-related useful load exchange (battery versus kerosene) could be invoked in order to realise longer-range flight capability.
1.2 Aims of this investigation
It is posited for commuter transportation, specifically, the 19-seater category, a revival of this long dormant market segment could occur by virtue of having ecologically benevolent attributes. Historically, 19-passenger turboprops have dominated the small commuter segment of aircraft with 40 seats or less; since the mid-1990s this particular market segment has seen lackluster interest from well-established operators. It is surmised market demand would increase substantially if an environmentally and community (noise) friendly 19-seat aircraft were to be introduced. The analogue drawn here is the spectacular success of 50-seat turbofans, which grew substantially from virtually zero in 1994 (including the emergence of 30-35 passenger jets to constitute a family concept). The introduction of hybrid-electric motive power technology into the 19-seater category is projected to have a similar impact, and furthermore, it is projected such vehicles would replace the current ageing turboprop fleet through operator trade-up in propulsion technology.
SAFRAN in-house pre-design work looking to perform an initial evaluation of hybrid-electric propulsion configurations for civil aircraft utilised expedient yet sufficiently detailed methods to conceive a 19 PAX fixed-wing commuter transport aircraft dubbed “Propulsive ArChItecture For hYbrid Commuters” or PACIFYC. By declaring a Beech 1900D as the reference, and mindful of retaining much of the original speed/altitude and payload-range working capacity operational performance attributes, perturbations from this seed aircraft were applied according to a given set of performance targets for advanced electrical machines, power electronics and secondary energy storage.
Representative motive power system configurations were evaluated in terms of design, integration, performance and operational characteristics, operating economics and potential for technological maturity by a target EIS of 2030. The final chosen candidates were then compared to an appropriate reference aircraft assuming identical mission roles, and with engineering solutions that reflect state-of-the-art and advanced solutions featuring a conventional architectural approach.
To round off the technical article, 70-180 PAX hybrid-electric aircraft from previous investigations will then be compared and contrasted to this 19 PAX hybrid-electric concept with intent to understand the influence scale-effect has on sizing, overall aircraft performance and operating economics.
2.0 AIRCRAFT REQUIREMENTS, OBJECTIVES AND BENCHMARKING STANDARDS
Small-to-mid size commuter and regional aircraft design involves close attention to cost and weight-sensitive factors that differ somewhat from larger passenger aircraft. These factors include: propulsion system bill-of-material and construction; weight and its relation to acquisition cost; design simplification for low tooling and production costs; sensitivity to engine placement as it affects weight and balance, moment of inertia and drag; optimum wing loading and aspect ratio; a requirement for lower noise and emissions than for larger aircraft; and freedom from ground support equipment.
2.1 Aircraft requirements and objectives
The Aircraft Top-Level Requirements (ATLeRs) that were deemed necessary for the success of PACIFYC study are defined in Table 1. Certification rules were chosen as CS-25/FAR-25 due to considerations of Maximum Take-Off Weight (MTOW) compliance and the observed general tendency of airworthiness authorities to align rules associated with 19-passenger (or less) aircraft certification/operation with that of larger transport category requirements.
Table 1 Aircraft top-level requirements

In the PACIFYC study, the multi-objective block fuel reduction problem as defined in Fig. 1 was set in the following manner:
-
• RDSG = 150 nm (278 km)
-
• RTAR = 430 nm (796 km), taken to be synonymous with capturing up to 85% of all life-cycle cumulative departures, at least 20% block fuel reduction
-
• RDES = 700 nm (1,296 km)
The mission profile consisted of taxi-out, take-off at sea level and en route climb until an initial cruise altitude of FL250. Cruise was performed at around M0.42, followed by a climb speed schedule mirrored descent, landing and taxi-in. All en route performance was assumed to occur under ISA ambient conditions. Reserves and contingency were based upon FAR 121 or equivalent EU-OPS 1.255 rules, namely, an IFR profile comprising 5% trip fuel (energy) contingency cruise, 30 minutes hold at 1,500 ft and 100 nm alternate.
2.2 Year 2000 and 2030 reference aircraft
The selection of reference aircraft was based upon the targeted application scenario and ATLeRs presented in Section 2.1. For purposes of gauging the relative merits of PACIFYC to that of interpolated SRIA 2030 targets, an appropriate transport aircraft reflecting an in-service year 2000 standard needed to be defined and analysed. As this air transport task is, today, typically serviced by twin-engine commuter aircraft, a Beech 1900D(18-Reference Miess, Robbins, Yamakawa and Gould20) equipped with the Pratt and Whitney Canada PT6A-67D(21) power plant was chosen as the State-of-the-Art Reference (SoAR) aircraft. Hence, a parametric model of the aircraft including the corresponding propulsion system was fashioned.
In order to appropriately capture the benefits of VJB concepts and to establish a suitable basis for consistent benchmarking, a reference aircraft reflecting the advanced technology level corresponding to an EIS 2030 application scenario was derived from the SoAR (designated as “REF2030”). Design range and payload were set in accordance with the ATLeRs given previously. In terms of mission performance, the REF2030 aircraft was predicted to deliver around 20% block fuel benefit compared with the SoAR carrying a payload of 19 PAX at 102 kg per PAX. Besides the adjustments to fuselage and cabin design taken from Ref. Reference Isikveren22, in order to provide the required accommodation and future comfort standards (see Fig. 2 for cabin layout), a set of aerodynamic, weights reduction, propulsion system and major systems related technologies appropriate for the targeted EIS was implemented compared to SoAR.

Figure 2. Adopted cabin layout for REF2030 and PACIFYC; taken from Ref. Reference Isikveren22.
2.2.1 Airframe aerodynamics and structural integration
For REF2030, an advanced flexible wing featuring an aspect ratio of 12.0 yielded a neutral lift-to-drag (L/D) outcome of 12.8 (at CL = 0.55, M0.43, FL250) compared to the SoAR. This was attributable to the offset in wing-related aerodynamic improvements due to the larger fuselage wetted area by way of the REF2030 cross-section and cabin versus that of SoAR. A drag breakdown of the REF2030 aircraft is summarised in Table 2, reflecting the aforementioned operating condition and assuming trim at a forward centre-of-gravity of 10%MAC. It can be observed that both the trim drag and propeller slipstream drag have reduced significantly when one compares the REF2030 aircraft to that of the SoAR. The trim drag reduction reflects a judicious choice of wing aerofoil section, wing placement and optimised tailplane sizing approach. With regards to the reduction of propeller slipstream drag, the main contributor to ameliorating this is due to lowering induced drag related to slipstream effects. The propeller slipstream modifies the downwash over the portions of the immersed wing, thus imparting changes to lift-dependent drag characteristics. In accordance with pre-design methods presented in Ref. 23, the induced drag component attributable to propeller slipstream immersion varies linearly with wingspan (+8.1% SoAR) and reciprocally with reference wing aspect ratio (+15.2% SoAR) for arbitrarily declared fixed values of net thrust, propeller diameter, local dynamic pressure and overall aircraft operating lift coefficient.
Table 2 Aerodynamic drag breakdown of REF2030 aircraft CL = 0.55, M0.43, FL250, trimmed at a forward centre-of-gravity of 10%MAC

In keeping with assumptions made in Ref. Reference Isikveren, Pornet, Vratny and Schmidt9, the structural design utilised advanced technologies such as omni-directional ply orientation of carbon fibres(Reference Campbell24), judicious use of advanced materials and structural topological design(Reference Siochi25,Reference Kebrau26) , and advanced bonding techniques(Reference Flinn27) were assumed to motivate a reduction of 8% in structural weight relative to the SoAR.
2.2.2 Major non-propulsive systems
The REF2030 major systems encompasses the Environmental Control System (ECS), the Anti-Ice System (AIS), Landing Gear (LG) and the Flight Control System (FCS). ECS pressurisation and air-conditioning for the flight deck, cabin and cargo hold are provided by bleed air from the engines. The system is operated through two air cycle packs located in the wing-fuselage fairing. Conditioned air is supplied from the air cycle packs by separate lines to the flight deck and cabin. The AIS provides protection for the wing and horizontal stabiliser leading edges, windshields, engine inlets and air-data sensors. Anti-icing of wing and stabiliser leading edges is accomplished by means of a bleed-air system via piccolos combined with electrical heaters – no de-icing boots are used. The vehicle employs electrical anti-icing for nacelle intake lips. The LG is a tricycle-type arrangement consisting of two main gear assemblies mounted at the root of each wing, and a nose gear mounted on the forward fuselage beneath the flight deck. Extension and retraction is facilitated by electro-hydrostatic actuators and is electrically controlled. The FCS comprises ailerons, elevator and rudder, flight and ground spoilers, flaps and variable incidence tailplane. Control is segmented into primary and secondary systems. The primary control surfaces are mechanically actuated by conventional floor-mounted control columns and adjustable rudder pedals complemented by cables, pulleys, bell-cranks and rods. The elevator and aileron control paths are redundant and the control path is duplicated where required. A gust lock system is also provided and is operable from the flight deck. Trim tabs on all surfaces are controlled by redundant electromechanical actuators.
2.2.3 Engines
The SoAR considered in this study is powered by two Pratt and Whitney Canada PT6A-67D engines. In order to perform investigative work and to quantify the gain from any VJB-based hybridisation, three distinct engines needed to be defined: two references and one bespoke engine for the VJB aircraft concepts.
The first reference architecture, the PT6A-67D as installed on the SoAR was used to calculate the current performance of the Beech 1900D. The second reference involved projecting this classical architecture to EIS 2030, taking into account potential improvements in the efficiency of turbo-components. For VJB aircraft concepts, it is more pertinent to evaluate performance in light of a suitably projected classical aircraft configuration with the same projected EIS. This enables an estimate of the gain (in terms of fuel consumption) of the hybrid-electric aircraft relative to a classical one taking into account the same technology level. In the following, “SoAR(E)” refers to the representation of the current PT6A-67D, “REF2030(E)” refers to the EIS 2030 projection of SoAR(E), and “PACIFYC(E)” refers to a re-designed version of REF2030(E). See Section 3.2.3 for details about the PACIFYC(E).
SoAR(E)
The PT6A-67D has a distinct reversed-flow architecture as shown in Fig. 3. It is composed of an inlet, an axial compressor, a centrifugal compressor, a burner, a one-stage high-pressure turbine, a two-stage power turbine, a gearbox, a high-pressure shaft and a power shaft connected to a propeller.

Figure 3. PT6A architecture(21).
The SoAR(E) architecture was modelled using the commercial engine performance simulation software PROOSIS™( 28 ). In order to design or rescale an engine using PROOSIS™, geometrical and performance data are needed for one or more flight conditions and engine power levels. The values of certain parameters are imposed at these points leading to a representative model of the required engine. Different PT6A-67D data sources(29-33) from open literature were exploited in order to maximise information and precision for representing the engine. Assumptions were incorporated to obtain a robust simulation model (see Fig. 4) and to subsequently fashion a suitable baseline for further modifications of the architecture. It is important to note that although the generated PROOSIS™ model is a good representation of a PT6A-67D turboprop, it does not exactly reproduce the real engine performance. Some differences can be noticed but are considered acceptable for the scope of studies undertaken in this activity. Typically, deviations in Power Specific Fuel Consumption (PSFC) and mass flow at design were around 1%. The model was calibrated using the basic cycle design parameters, for example, pressure ratios, efficiencies and powers.

Figure 4. PROOSIS™ model representation of the SoAR(E).
The scheme shown in Fig. 4 is the association of different components to create the architecture model. Below are listed the main components and corresponding assumptions.
-
• The Inlet: no pressure loss assumed. One accurate design cycle was found with no inlet pressure drop; this could be modified during the calculations. In fact, the engine has been designed for uninstalled conditions without any inlet pressure losses. Appropriate pressure losses have been taken into account at off-design conditions.
-
• One Compressor: the axial and centrifugal compressors were modelled as a single compressor. The off-design performance of the compressor was represented by a Beta map, scaled at the design point
-
• A Classical Burner
-
• One-stage, uncooled High-Pressure Turbine (HPT)
-
• One cooled Turbine component representing the two stages of the power turbine. Off-design performance of the two turbines was represented by two specific maps scaled at the design point
-
• A Convergent Nozzle
-
• A High-Pressure Shaft and a Power Shaft
-
• A Gearbox
-
• A Propeller: the propeller was designed separately and modelled by a map. The design of the propeller is based upon the performance at take-off and cruise of the SoAR(E).
-
• Cooling system assumptions:
-
○ Air is bled at the exit of the compressor to cool the HPT inlet and outlet
-
○ A separate flow is extracted at a compressor station representing the thermodynamic plan between the axial and centrifugal compressors in the real architecture. This bleed is injected before, after and between the two stages of the Power Turbine
-
○ The cooling system was inspired from a similar turboprop
-
Even if the simplified modelling does not allow capturing the entire performance spectrum of the PT6A-67D, attributable to insufficient calibration data, the SoAR(E) model was considered to be a sufficiently robust baseline for further investigations. The assumptions made for cycle matching and the corresponding model presented above was taken as not introducing a significant error with respect to the real cycle. Once the SoAR(E) reference model was validated, the next exercise was to produce a PROOSIS™ representation of the PT6A-67D classic architecture for EIS 2030.
REF2030(E)
In view of the fact that REF2030(E) has the same architecture as SoAR(E), it was assumed the components’ type and order, the cooling scheme and the design hypothesis made for SoAR(E) remain valid. The important modifications for a REF2030(E) relate to the state-of-the-art of the components, the temperatures and some other variations.
The following modifications and critical assumptions constituted the projection exercise:
-
• Evolutionary pathway based upon analogues taken from similar engines, e.g. HPT inlet temperature evolution over a 30-year timeframe for turboshaft and turboprop engines in the same power range.
-
• The same propeller is used for all types of propulsions systems. The design of the propeller was neither updated nor adapted and does not invoke any improvement for an EIS of 2030. This means no expected credit was taken in all subsequent advanced studies.
-
• The redesign considered no change in power and thrust specifications between SoAR(E) and REF2030(E).
Improvement in efficiencies of the turbo-components and the thermodynamic cycle variables, namely, HPT inlet temperature and the Overall Pressure Ratio (OPR) are the main sources of improvement in fuel consumption. The assumptions are itemised as:
-
• +40 K in HPT inlet temperature at design Maximum Take-Off (MTO)
-
• +26.5% in OPR (from 9.5 to 12.0)
-
• Improved turbo-component efficiencies, see Table 3 for details; the collective nature of all these improvements in efficiencies match the PSFC targets set by the General Electric next generation advanced turboprop(34) for a same engine power class.
Table 3 Turbo-component efficiencies during cruise of REF2030(E); MTO as the design point

It should be noted that all engine designs discussed in this paper were bounded by the following constraints:
-
• Engine operability and transient phases were not considered. A check of the surge margins stack up was made without any further optimisation.
-
• The Nozzle Pressure Ratio was kept at a value of 1.05-1.10. This influences the mass flow and the nozzle area which are checked and validated to avoid integration issues.
The Thrust Specific Fuel Consumption (TSFC) was predicted to be –20.4% at typical cruise and –22.6% at take-off conditions. The PSFC was predicted to decrease by 21.4% at typical cruise and 23.6% at take-off.
3.0 MULTI-DISCIPLINARY DESIGN AND ANALYSIS OF AIRCRAFT UTILISING VOLTAIC-JOULE/ BRAYTON MOTIVE POWER SYSTEMS
A coherent, standardised and robust set-up in conjunction with adherence to strict procedural control was needed in order to ensure successful multi-disciplinary interfacing, sizing and optimisation. Details about these aspects including down-selection are given below.
3.1 Down-selection framework, concept cloud and results
The down selection procedure aims to qualitatively assess the attributes of different candidates in comparison to one architecture that is chosen as the reference (tentatively, from what is considered to be the designer's choice). In order to compare “performance”, several criteria of merit were chosen. Those criteria were organised and classified into four main groups, and “casting” during the down selection session was done by different specialists able to qualitatively assess the different architectures according to each criterion.
3.1.1 Down-selection framework
During the down-selection exercise concept, clouds comprising four candidate designs for VJB-based architectures were qualitatively rated against a total of 15 sub-categories which were grouped into four main criteria with technical, operational and certification related foci:
-
• Propulsion;
-
• Weights and Integration;
-
• Certifiability and Development; and,
-
• Operations.
Each main criterion included a set of three-to-four specific sub-categories. The weightings of the main criteria and sub-categories were tailored to reflect the emphasis placed upon fuel burn and operating cost reduction. Thus, one of the main criteria having a major impact on fuel burn, “Propulsion” was assigned a weighting of 0.337, whereas the “Weight and Integration” criterion deemed as one exhibiting a mixture of fuel burn impact together with operating cost influence was weighted with 0.260. The two remaining criteria, “Certifiability and Development” and “Operations”, were weighted with 0.230 and 0.173, respectively. These values are quoted to three decimal places because it reflects an average given by 16 specialists. The final array of scoring was generated by evaluation of each individual concept against what was intuitively deemed the best design candidate from within a pool of four.
In addition, technical maturity was assessed by evaluating each concept with respect to the likelihood of success and the effort to bring the technology to target Technology Readiness Level (TRL) 6 by technology freeze in the year 2025. Following the procedure described by Refs Reference Isikveren, Seitz, Bijewitz, Mirzoyan, Isyanov, Grenon, Atinault, Godard and Stueckl35 and Reference Mistree, Lewis and Stonis36, robustness of the concept rating was gauged by systematically varying the criteria weighting in each main category. This was achieved by means of artificial amplification in such a way that one category was rated with 0.40 and the remaining weightings were equally distributed amongst the other main criteria.
3.1.2 Concept cloud of architectures
Four VJB propulsive architectures were identified for purposes of down-selection in this study:
-
1. ARCH 1 – Electrical Booster
-
2. ARCH 2 – Hybrid Turbo-electric
-
3. ARCH 3 – Dual Propulsion with Exchangeable Battery
-
4. ARCH 4 – Electrical Booster with Exchangeable Battery Pack
At this pre-design level of the study, only a macroscopic definition of each architecture was made available. Any degrees-of-freedom related to operational modes and aircraft morphology were subject to choice and further refinement a posteriori to the down-selection exercise. A corresponding set of operational modes according to each architecture type was also stipulated from the outset. See Fig. 5 for schema corresponding to each architectural candidate.
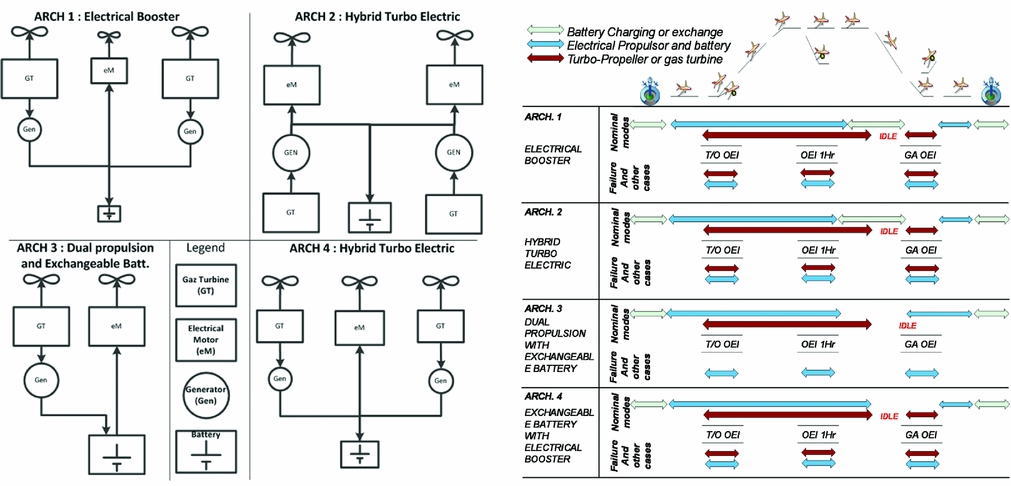
Figure 5. Architecture candidates and corresponding operational modes considered in the PACIFYC down-selection.
The main objective of ARCH 1 is to relax the design of the thermal engine in terms of performance. Specifically, the engine should be designed for only one rating, namely, Maximum Cruise, and the available thrust available at Take-Off (T/O) is considered to be a fall-out. To compensate the loss of power at T/O (and on other specific phases like climb and OEI), an electrical propulsion device is added, but batteries are used as the main power source. Also, this electrical propulsion group could be used in descent (wind-milling) to recover energy.
ARCH 2 is based on the same principle as ARCH 1 but the propulsive configuration is in series: two thermal engines connected to two electrical generators that power two electrical motors. A battery is also used to smooth out any power peaks from the gas turbines.
ARCH 3 introduces the concept of full exchangeable battery packs at the end of the flight. In this case the battery is used as an energy source. To optimise the number of parts in the architecture, only one turbo-prop and one electrical motor with a propeller is used.
ARCH 4 is a mix between the concept of ARCH 1 and the exchangeable battery concept: the thermal engine(s) are optimised for one specific rating and the batteries also deliver supplementary energy during the mission.
3.1.3 Down-selection results
As a result of the down-selection process (see Fig. 6 for outcomes), ARCH 1 and ARCH 4 were identified as the most promising candidates. These were also assessed to be concepts with the highest potential to meet the target technical maturity level compared to the other rated alternatives. In order to adequately address system redundancy stipulated by transport category certification, the aircraft morphology chosen for ARCH 1 and ARCH 4 comprises two on-wing podded turbo-props.
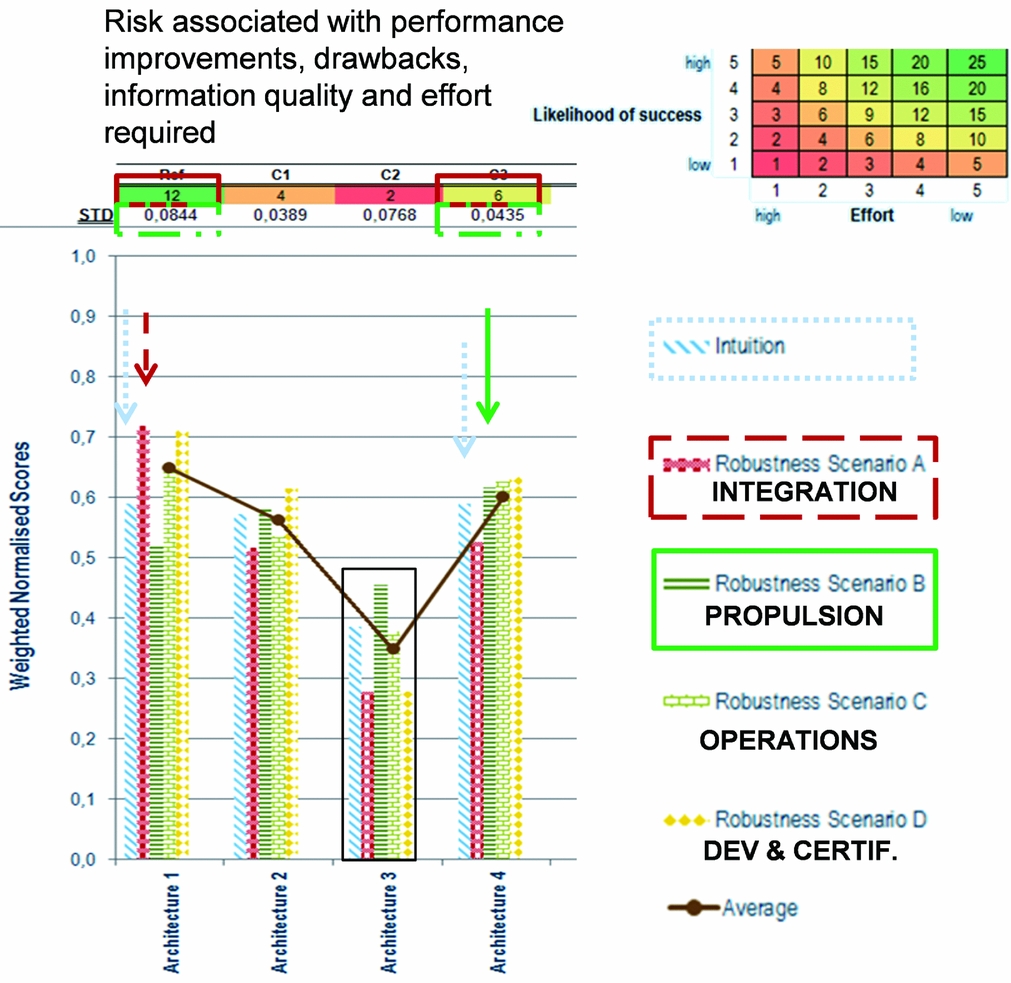
Figure 6. Results of robustness analysis of hybrid-electric propulsion architectures.
ARCH 1 scored the highest when integration is given the highest relevance. ARCH 4 has a lower standard deviation in the scoring compared to ARCH 1, hence providing a more robust solution but exhibiting more risk. A targeted aircraft performance improvement of 20% or more block fuel reduction is achievable with an “Electrical Booster +Exchangeable Batteries” concept, and thus, it has a higher risk value compared to ARCH 1 due to the influence of battery performance in the technology outlook. Irrespective of this, ARCH 4 out-performs every other concept with regards to propulsive performance including emissions and aero-propulsive efficiency (dark green bars in the chart shown in Fig. 6).
ARCH 3 did show some merit, however, due to forecasted levels of battery energy density, it obtained the lowest score regarding integration, development, certifiability and operational criteria. Such an outcome should not preclude revisiting this solution in future investigations provided higher battery energy densities can be realised.
3.2 Multi-disciplinary constituents
This section describes the components that constitute advanced VJB motive power systems. Performance targets and efficiencies are presented mindful of EIS 2030.
3.2.1 Electrical power chain and batteries
Electrical architectures indicative of ARCH 1 and ARCH 4 need to ensure reliable and steady power supply from either the thermal engine generator or electrical storage device. Figure 7 displays a simplified schematic of the necessary architectural interfaces and offers a general description of important facets. Electro-mechanical conversion is to be performed using an Alternating Current (AC) voltage machine, whereas, electrical storage utilises Direct Current (DC). As no AC power sources are to be used in parallel with another one, the main power transfer will be performed via a DC link. To this end, each electrical machine has a dedicated AC/DC converter. Battery current regulation needs are addressed using current-controlled AC/DC converters. In this fashion, no additional DC/DC converters are to be used, thus allowing for weight reduction and ameliorating failure mode cases.
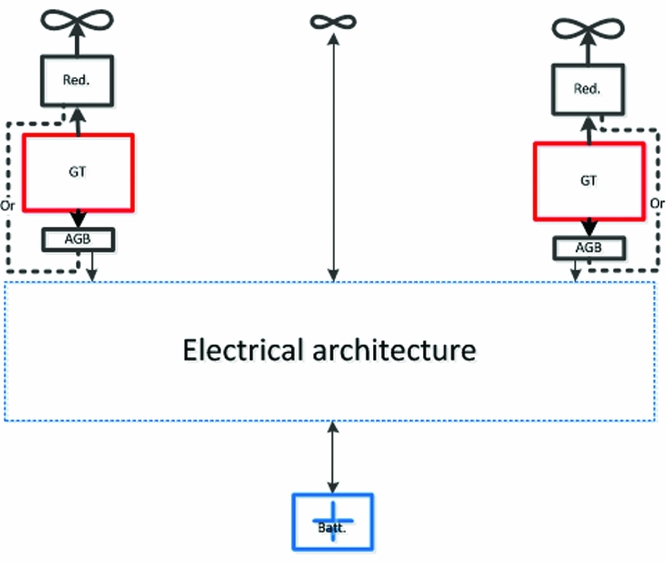
Figure 7. Electrical architecture interfaces compatible for ARCH 1 and ARCH 4.
3.2.2 Properties and performance targets
Table 4 gives an overview of properties as well as performance targets for electrical component options. A discussion motivating the targets given for electrical machines, power electronics and thermal management is also provided.
Table 4 Properties and electrical component performance targets; * denotes system-level requirement

Propulsive Element
Permanent magnet rotors have the highest power-to-weight ratio and are expected to achieve 9.0 kW/kg by year 2030(Reference Galea38). This approach does impose the use of an inverter to control speed. This inverter is to include the latest Si-C components, thereby limiting internal loss. These kinds of converters may reach a high level of efficiency; however, since it will need to be used in a reversible fashion, e.g. in an emergency case, and are required to control propeller speed, this would tend to reduce its efficiency to around 95%. The power density linked to this element is considered to reach 10.0 kW/kg. As a result, the global propulsion system is projected to have 4.8 kW/kg with a corresponding 90% in overall efficiency.
Electrical Energy Generation
In order to allow use of generators for non-propulsive loads, a three-stage generator has been chosen since it can easily manage failure modes and allows for RMS voltage control by way of digital excitation. This kind of generator is expected to exhibit 90% efficiency at 5.0 kW/kg by EIS 2030. It supplies a Thyristor Rectifier Unit that controls the output current. Thyristor Si-C technology is postulated to be sufficiently mature by technology freeze year 2025 with an expected efficiency of 97% and corresponding power density of 15.0 kW/kg. Overall electrical energy generation performance is targeted to be 10.0 kW/kg with 87% efficiency. If required, design power coincides with the order of magnitude of the aircraft generator (to provide electrical power to the aircraft systems); these generators have a possibility of being shared.
Electrical Storage
Electrical storage includes the electro-chemical cell, balancing system and packaging. These aspects are taken into account because no safe use of chemical cells can be realised. Two characteristics are used for storage sizing: (1) energy to be stored and (2) power to be supplied. Li-S battery technology has been selected due to the potential for high energy and power mass densities (500 W.h/kg and 1000 W/kg, respectively) at system-level. At this point in time, this technology is not sufficiently mature for use on aircraft; however, there is scope for the first generation of Li-S to be used by year 2035(Reference Barchasz39).
Electrical System Robustness
When surveying the overall electrical architecture the least reliable element is the inverter, which is tasked with supplying the propeller. This aspect needs to be compensated through redundancy. Moreover, as its power is high, use of two inverters supplying a hexa-stator machine may increase system availability significantly without invoking a penalising mass impact. In view of this consideration, the final electrical system architecture adopted for the design candidates is depicted in Fig. 8.
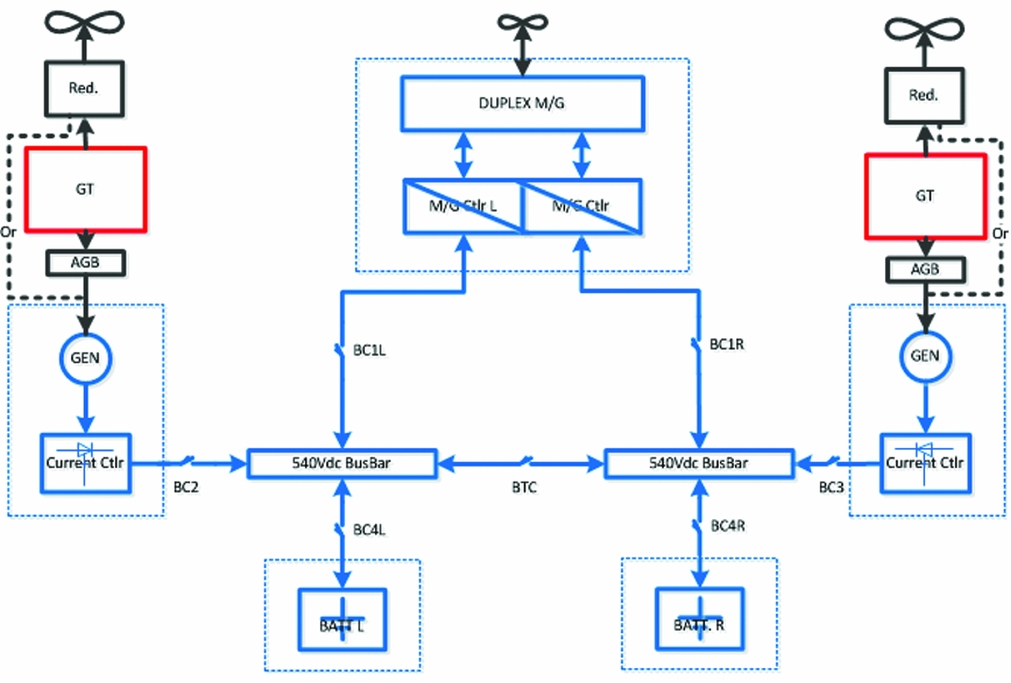
Figure 8. Final electrical system architecture incorporating fail-safe features.
Thermal Management
In view of the electrical power channel facilitating a significant amount of power, thermal losses need to be managed thoughtfully, and such a consideration is linked to electrical power conversion, high-power density and efficiency. As the storage power density is taken to be rather low, the need for a dedicated heat exchanger does not exist. In addition, since the batteries are stored in a non-severe environment (not close to the thermal engines), problems associated with overheating are not envisaged. A connection to the aircraft ventilation system is used to maintain the battery at its appropriate operating temperature range during pull-up and pull-down phases. Contemporary controlled rectifiers have a sufficient efficiency to be cooled using forced air devices. In contrast, electrical generators need to be cooled, and a typical approach involves an oil cooling system. As such, this will have a mass impact on the global system.
Electrically driven propellers, including power electronics and electrical motors, are the most critical elements since they operate at the highest power level. It may be installed close to or within the aircraft air flow, and even if an optimised heat exchanger is incorporated, this will impose a significant mass impact. To take into account the penalty of a global cooling system, in-house knowledge assessed the penalty in mass to be 1.5 kg per extracted thermal kilo-Watt. Moreover, additional heat exchangers might be required to ensure improved global system efficiency. The potential additional drag expected by this type of device may be at least compensated partially (even completely) with an adequate integration that fully exploits the Meredith effect(Reference Piancastelli and Pellegrini40), i.e. a radiator that provides adequate cooling flow and reduces the drag associated with the installation.
3.2.3 Engine design specific to hybrid-electric applications
In general, designing an engine is a complex process taking into account different constraints. The final design cycle and performance are the results of the best compromise found between constraints of operability, integration, aging, cost and fuel consumption for a given aircraft and mission. In such a process, some specific operating points are critical even though they are operated for a very short period of time compared to the whole mission. Take-off represents one of the critical and constraining design conditions. It lasts for a short amount of time, but it imposes limits on the temperatures and engine size for the rest of the operations. In fact, engines typically reach maximum allowed temperatures at T/O for maximum power, and any thrust demand including both safe operation and failure modes need to be taken into account within the design.
The T/O phase has very little impact on total fuel consumption; nevertheless, due to stringent operating conditions, the engine needs to be oversized for safe operation. Therefore, longer phases such as cruise are impacted by this oversizing and their performance is a consequence of it. Removing some design constraints to optimise the engine for cruise and assisting the engine during the critical phases is investigated in this paper.
The PACIFYC(E) version for VJB application needs to be optimised for cruise performance, and, as such should be, compared to REF2030(E). The performance of the PACIFYC(E) is calculated at design and off-design points that are the most constraining in terms of power. These calculations determined:
-
• The extent to which electrical assistance is advantageous at high-power operating points such as T/O.
-
• The gain in performance at some mission points both at engine-level and aircraft-level.
With regards to iso-shaft power, the new cycle was designed at a higher cruise OPR (13.8) and a higher T41 (1,350 K). The cruise T41 has been increased by 45 K to improve engine efficiency. Assuming the same material technology is applied to both engines, this T41 increase will have an influence on the engine component lifetime. Evaluating such an impact is not addressed in this technical article as is requires detailed information about the materials concerned.
The other parameters, such as the High-Pressure Compressor (HPC) rotational speed, were adapted to these modifications accordingly. The implication of this was to add approximately 0.5-1.0 % points of polytrophic efficiency to the compressor and turbines.
The impact on critical mission points should also be quantified to estimate the required amount of electrical power assistance deemed to be of high importance in the context of the global energy balance. Assuming EIS 2030 limitations, reducing the core size of the engine at cruise will limit the T/O available power. The thermal engine alone cannot provide this power as the mechanical speed would exceed the limitation of 39,000 rpm and the HPT inlet temperature would surpass an upper limit of 1,380 K. Therefore, the maximum power that could be delivered by this new engine at take-off, the most critical point of the mission, is assessed by running the model to its maximum limits.
At maximum T41 T/O, the thermal engine power was found to be lacking 14.1% of the total required power and this difference has to be provided by the electrical system. This difference in power was imposed upon the design specifications of electrical production, conduction, conversion and corresponding storage systems.
Improved turbo-component efficiencies associated with the specially designed PACIFYC(E) is shown in Table 5. The comparison is made assuming SoAR(E) as well as REF2030(E), and as it can be readily observed, a significant improvement in turbo-component efficiencies can be gained when attempting to customise the thermal engine for hybrid-electric applications.
Table 5 Turbo-component efficiencies during cruise of PACIFYC(E); cruise as the design point

The performance outcome showed a 5.9% improvement in TSFC over and above the REF2030(E) according to this redesign assumption. In addition, the PSFC during cruise was predicted to be –4.3%.
3.3 Operating economics analysis
In an effort to foster more realistic product development considerations related to aircraft sizing, this initial technical assessment activity coupled Cash Operating Cost (COC) into the scheme. Cost of Ownership (which includes depreciation, interest and insurance costs) was intentionally neglected owing to considerable uncertainties in establishing the value of such advanced engineered products(Reference Isikveren, Pornet, Vratny and Schmidt9). The methodology and pertinent array of critical assumptions was based upon those published in Ref. Reference Isikveren, Pornet, Vratny and Schmidt9.
The COC sums up expenditures for fuel, crew, maintenance, airport and en route charges. The principal crew cost model is based on the Association of European Airlines (AEA) methodology where crew hourly rates are a function of MTOW and number of PAX(41,42) . It was subsequently tuned according to scaled data found in Ref. 43. An explicit model addressing additional costs associated with handling battery modules during turn-around was not devised. For purposes of this study, the handling of battery modules was taken to be analogous to that of cargo containers. The cargo container handling cost constituent model is expressed as a function of MTOW(Reference Ploetner, Wesseler and Phleps44); and since VJB-based aircraft concepts have a tendency of generating higher MTOW candidates compared to any baseline or seed aircraft, it was argued such an approach would serve as a suitable proxy for capturing incremental costs associated with battery module handling.
The Direct Maintenance Cost (DMC) covers labor and material cost associated with airframe and engine. Operational dependencies, such as flight cycle and flight time are also considered. The airframe DMC are calculated with an analogous costing method given in Ref. 45 and the engine DMC are determined using parametric cost functions in Ref. 46 and tuned in accordance with information found in Refs Reference Majeed47 and 48. Appropriate capture of airframe and propulsion DMC related to VJB-based designs involved the following modifications (itemised according to Air Transport Association, ATA, chapter convention):
-
• ATA 32 Landing Gear – variation in certified design weights
-
• ATA 53 Fuselage – variation in certified design weights
-
• ATA 54 Nacelles and Pylons – housing of additional motive power components based upon electrical machines
-
• ATA 71 Power Plant – additional power transmission bill-of-material items
All analysis results reflect a year-2012 standard and the working currency was assumed to be US dollars (USD). Also, the results reflect a “Year-1” study neglecting aging or deterioration effects. Kerosene fuel price was nominally assumed to be USD3.30 per USG(49), and with intent to gauge sensitivities, a lower value of USD2.00 per USG and an upper limit of USD6.00 per USG were declared. The global average electrical energy price weighted according to total flight operations in 2012 accounts for USD0.1109 per kWh(Reference Baranowski50). By using this min-nominal-max bandwidth of values, it provided a means of treating the operating economics analysis in a non-deterministic manner.
Figure 9 presents cost component breakdowns for the REF2030 and VJB-based motive power design option called ARCH 4 covering 430 nm. See Section 4 for details about the morphological and integration strategies associated with the ARCH 4 concept together with the ARCH 1 alternative.
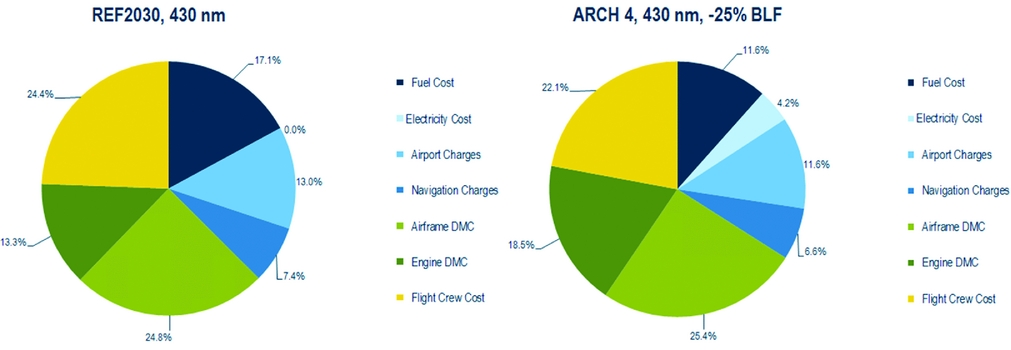
Figure 9. Generic block fuel reduction multi-objectives for overall aircraft sizing.
Prior to proceeding with the complete analysis, it was noted from Ref. Reference Isikveren, Pornet, Vratny and Schmidt9 that cost constituents like landing fees and navigation charges could unfairly distort costs because of an explicit functional relationship with design weights. Since VJB-based aircraft tend to be heavier in weight, it was reasoned these cost components should be held fixed, i.e. equal to the REF2030 projected turboprop only aircraft, in recognition of the significant emissions reduction potential of aircraft employing VJB motive power systems versus those that do not. In the results to follow, this adjustment has been incorporated.
3.4 Aircraft design axioms and heuristics
For the sake of simplification, all component efficiencies were considered to be invariant with operating time (changes in loading behaviour). Except for structural systems, all specific weights were taken to be independent of scale (sizing variations). All aircraft variations away from the REF2030 aircraft reflect a common all-axes dimensional wing scaling and constant wing loading, thereby retaining the same en route buffet onset characteristics. The empennage was primarily scaled with wing geometric variation according to a constant volume coefficient approach; however, where appropriate, sizing did take stock of minimum control speed vertical tail control power requirements.
Identical application of operational rules, payload, stage length, and where possible, flight technique were employed to that of the REF2030 aircraft attributes presented in this treatise. The integrated performance analysis employed here utilised simplified flight mechanical and performance methods in order to map required power and energy profiles during the integrated takeoff, three-phase climb, cruise and descent subject to transversality conditions, and, landing phases.
The fuselage geometry was initially kept fixed for all variations away from the REF2030 aircraft, and as a result, it was conceivable some analysed candidates would violate minimum volume allocations for cargo and/or the alternative energy source. Displaced volume due to presence of batteries and associated thermal management system was assumed using a linear volumetric specific energy model computed from the product of battery energy density and 1,000 kg/m3 as given in Table 4. Any changes to the fuselage Outer Mould Lines (OML) due to increased volumetric to house batteries were implemented including account of incremental wetted area and fuselage weight. The fuselage weight was predicted in accordance with methods found in Refs Reference Isikveren, Pornet, Vratny and Schmidt9, Reference Pornet and Isikveren10, Reference Pornet, Kaiser, Isikveren and Hornung13 and Reference Pornet, Gologan, Vratny, Seitz, Schmitz, Isikveren and Hornung14, and takes into account fuselage geometry modifications. Moreover, the Maximum Zero-Fuel Weight (MZFW) depends upon battery sizing whose weight is included within the Operating Weight Empty (OWE) book-keeping, thus imparting an influence on the overall aircraft MTOW. Finally, apart from the application of simplified geometric rules, such as the centre-of-gravity being placed according to a constant non-dimensional longitudinal fuselage location of the wing MAC, aircraft balance and any associated impact to trim have been neglected.
A pool of aircraft morphological candidates able to facilitate the integration of a tri-prop propulsion system is presented in Fig. 10. Assuming two of the propellers shall be arranged as on-wing podded installations, possibilities include a nose-mounted tractor (denoted as “A”), cruciform empennage-mounted tractor (similar to the Britten-Norman Trislander, denoted as “B”), “H-tail” empennage with pusher (denoted as “C”), and the “V-tail” empennage with pusher (denoted as “D”). When choosing the most appropriate morphology, issues related to propeller efficiency and blockage, avoidance of channel flow (localised super-velocity formation), simplification of bill-of-material, nose-wheel collapse and tail-scrape geometric limitations, blade-off ramifications, detrimental colocation of essential systems, motor cooling, aircraft balance, propensity to excessively perturb OML, clearances including that of ground and avoidance of sonic fatigue on localised structure, as well as aesthetic appeal were reviewed. After carefully weighing the relative merits (or otherwise) of each morphological option, the decision was made for ARCH 1 to adopt the “H-tail” empennage with pusher, and ARCH 4 to employ the V-tail empennage with pusher.
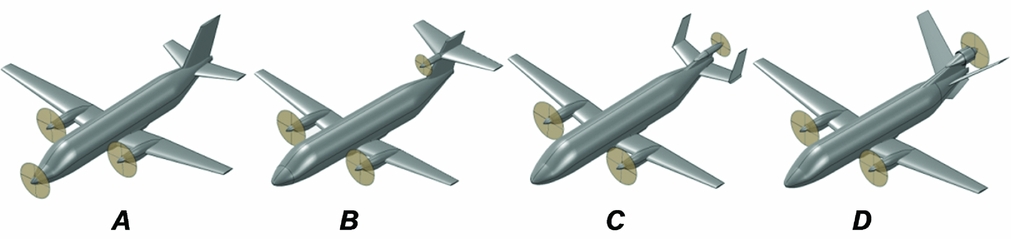
Figure 10. Aircraft morphological candidates that were considered (A) nose-mounted tractor, (B) cruciform empennage-mounted tractor, (C) “H-tail” empennage with pusher and (D) “V-tail” empennage with pusher.
3.5 Sub-space coupling and analysis flow
Figure 11 describes the sizing loop of ARCH 1. The main objective was to align the need in terms of electrical power to the need in energy provided by the battery. By decreasing the reference thrust of the thermal engines, correspondingly, required electrical power and energy tends to increase. Due to the fact that the need in energy grows faster than the required electrical power, the best compromise in the design scenario can be reached when all the usable battery energy is consumed.
Figure 11. ARCH 1 sizing loop.
The second concept, ARCH 4, also utilises a third propeller driven by an electrical motor with electrical energy supplied by a battery. The objective in this instance is to achieve at least 20% fuel burn reduction for the 430-nm mission. The consequence on the design is the overriding reliance on batteries, which are to be replaced at the end of the mission. The baseline to this concept used the results of ARCH 1 with its already optimised engines.
The electrical systems design of ARCH 4 focused on the 430-nm mission. The necessary quantity of battery to reach the 20% fuel burn reduction goal is inserted into the aircraft along with a de-rating of the thermal engines (see Fig. 12). The off-design missions were realised by establishing an adequate energy repartition between the fuel and the batteries. In order to complete the 700-nm mission, part of the batteries were removed from the hybrid vehicle to make room for additional fuel, thereby invoking a useful energy load trade for sake of completing the maximum design. Regarding the 150-nm mission, the engine was systematically “flexed” (reduced power) until the electrical system capabilities were fully exploited.

Figure 12. ARCH 4 sizing loop for the 430-nm mission.
To round off, the 19 PAX hybrid-electric concepts were sized based upon a two-pronged set of objective functions: (1) relative block fuel reduction; and (2) operating economics. The objective function of operating economics serves as a counterpoint to the relative block fuel result, thus ensuring a more pragmatic selection is made when it concerns electrical-to-kerosene energy storage ratio, power-split between propulsive device types and associated relative utilisation (with respect to time) afforded by the motive power device associated with each energy source.
All computational work was performed using the PACE suite of tools(51). These included Pacelab APD™ for overall aircraft conceptual design sizing and integrated performance analysis, and, Pacelab SysArc™ used to perform multi-layered integrated systems sizing. All OML visualisation was conducted using the OpenVSP open source parametric geometry toolkit developed by NASA(52).
4.0 PACIFYC GENERAL DESIGN DESCRIPTION, EVALUATION AND BENCHMARKING
The ARCH 1 and ARCH 4 motive power system configurations were evaluated in terms of design, performance and operational characteristics. These solutions were then compared against representative reference aircraft (SoAR and REF2030) assuming identical mission roles.
4.1 Overall design sizing outcomes
A synopsis of important aircraft characteristics for the SoAR, the REF2030 and the selected ARCH 1 and ARCH 4 designs is given in Table 6. It is highlighted all relative values quoted in the data table and discussion text hereafter adhere to the convention of fractional change. The analytical basis of fractional change operates with the underlying premise that the designer/analyst begins with a seed condition or aircraft. By considering an increment in variable x as dx or Δx, a fractional change to a new value x 1, small or otherwise, from a seed parameter x o is defined as
Table 6 Comparative synopsis of important aircraft characteristics

*Electrically powered ground manoeuvring
**Denotes neutral energy expenditure of battery
 $$\begin{equation}
\triangleleft x = \frac{{\Delta x}}{{{x_o}}} = \frac{{{x_1} - {x_o}}}{{{x_o}}} = \frac{{{x_1}}}{{{x_o}}} - 1
\end{equation}$$
$$\begin{equation}
\triangleleft x = \frac{{\Delta x}}{{{x_o}}} = \frac{{{x_1} - {x_o}}}{{{x_o}}} = \frac{{{x_1}}}{{{x_o}}} - 1
\end{equation}$$
Notional differences in sizing when comparing the SoAR aircraft (not optimised for 700-nm maximum design range assuming 102 kg/PAX), the REF2030 and the proposed ARCH 1 and ARCH 4 is shown in Fig. 13. The SoAR block fuel for a 430-nm stage length was established to be +34% in relation to the REF2030. A significant increase in MTOW and wing area is associated with ARCH 4 compared to the REF2030; in fact, the values are both +40%. Although it might appear discouraging, the reader is reminded that the payload-range working capacities of the aircraft are identical.
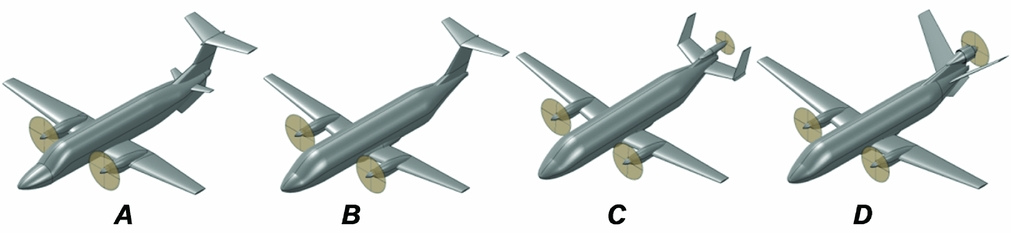
Figure 13. Notional contrast in sizing between the (A) SoAR (Beech 1900D), (B) REF2030, (C) ARCH 1 and (D) ARCH 4.
From the perspective of expended energy, Fig. 14 presents profile data indicative of a 430-nm stage length. It was readily observed that the SoAR aircraft requires a total of 7.3 MW.h to complete the entire block operation, whereas REF2030 expends a total of 5.4 MW.h. Both ARCH 1 and ARCH 4 aircraft highlight significantly improved ◁ESAR attributes compared to REF2030 when one inspects the lower slope of the expended energy curve with respect to distance travelled. Figure 14 also displays the battery expended energy profile for both ARCH 1 and ARCH 4. The battery supporting ARCH 1 is utilised during taxi-out, take-off and en route climb phases, and upon reaching top-of-climb, ARCH 1 systems switch over to battery recharge and energy recovery modes for the remainder of the block operation until completion of landing. The battery is then expended during the taxi-in phase, yet still results in an overall battery neutral energy expenditure state due to the extent of recharge/recovery performed during the en route phases. One interesting aspect upon inspection of the top-of-climb points between SoAR, REF2030, ARCH 1 and ARCH 4 is the fact that the ARCH 1 aircraft initiates cruise after a much shorter climb distance (with correspondingly slower cruise speed) compared to the others. This is attributable to the need of devising an aircraft flight technique that ensures a neutral energy expenditure outcome (through recharging and energy recovery) for the battery supporting ARCH 1.

Figure 14. Block energy profiles of SoAR, REF2030, ARCH 1 and ARCH 4 aircraft completing a 430-nm stage length.
Evaluation of ARCH 1 for the design and off-design missions show even though the fuel burn goals of this study are not reached, the VJB aircraft candidate has very promising results in terms of block energy efficiency (see ◁ESAR in Table 6 and Fig. 15). A non-negligible advantage of this solution is the operational flexibility offered by an in-flight battery recharge capability. Indeed, a battery energy neutral expenditure scenario (denoted by HE = 0 in Table 6) is conceivable by coupling the design with flight profile adjustments. A flight technique is suggested here to land with an equal State-of-Charge to that of the beginning of the mission. As can be observed in Table 6, this customised flight technique tends to slow down the cruise speed, increasing flight time by 4–6 minutes.

Figure 15. Review of SoAR and design candidates versus the REF2030 (datum).
It is highlighted that a variety of scenarios are possible with ARCH 1. Firstly, the minimum energy required to complete a mission is independent of the range. On top of the optimised energy case on the design mission plus the battery energy neutral-expenditure possibilities, this concept is also able to complete two hops of 150 nm under the constraint of ground recharge. Results have shown that this concept is able to complete different types of scenarios with different objectives for the mission: whether it is to optimise the fuel burn, or have a net battery energy expenditure equal to zero. This could be investigated even more to get an electrically self-sufficient aircraft with optimised fuel consumption and acceptable time impact depending on the operational context of the aircraft. This new function could be an enhancement of the already existing Flight Management System that integrates a new input: State-of-Charge of the battery pack.
Significant improvements in terms of fuel burn reduction are obtained with the ARCH 4 concept. As has been stated in Ref. 9, this outcome can be explained by an increase in the overall propulsion system efficiency by virtue of increasing HP,use. Together with a favourable L/D effect, which is proportional to aircraft weight increase, an improved ESAR outcome generates an overall energy expenditure benefit.
Upon completion of this exercise, the authors recommend a future VJB aircraft with a suitably flexible hybrid-electric architecture incorporating attributes of ARCH 4 (to permit significant emission reduction) and ARCH 1 (to permit dispatch under all circumstances) could be fashioned, allowing possibility for the aircraft to complete any required city-pair operations (within the legitimate payload-range working capacity) irrespective of exchangeable batteries being available at a given station.
A sensitivity study was conducted assuming variation in kerosene price. It was deemed from the outset any variation in kerosene price from the nominal value, i.e. USD3.30 per USG, the nominal electrical energy price of USD0.1109 per kWh would remain fixed. This assumption was drawn by taking an analogue of studies presented in Ref. 53. For ARCH 1 and ARCH 4, recalling the lower threshold of USD2.00 per USG for kerosene, 1-3% higher relative COC was found to occur compared to REF2030. An increase to USG6.00 per USG for kerosene resulted in 1-5% lower relative COC compared to Table 6. This indicates a significant impact of changes in kerosene price.
4.2 Benchmark against previous efforts
Table 7 presents numerical particulars associated with the ARCH 4 design undertaken in this study as well as those published in Ref. Reference Isikveren, Pornet, Vratny and Schmidt9. Both the 70 and 180 PAX VJB aircraft concepts employ tri-fan (two under-wing podded gas-turbines and one aft-fuselage mounted, S-duct configured electrically driven motor) morphologies with corresponding typical cruise speeds of M0.75-76. In addition, taxi-in/out were assumed to be performed using gas-turbines only for the 70 PAX and 180 PAX VJB aircraft as opposed to the 19 PAX VJB, which employs electrically powered ground manoeuvring. Furthermore, all candidates presented in Table 7 utilise Normal Conducting Machines delivering shaft power output of 1.1 MW, 4.5 MW and 8.5 MW for the 19 PAX, 70 PAX and 180 PAX, respectively.
Table 7 VJB-based aircraft design for 85th percentile stage length, Max PAX

*Estimated based upon assumptions for design life, ageing effects, target state-of-charge and sensing requirements
**Flight fuel quoted instead due to PGT070 and PGT180 assumed taxi-in/out performed using gas-turbines
***Data gleaned from Ref. 9
All aircraft presented in Table 7 share a common analysis methodology for operating economics and are characterised by a ◁COC result of around +10%. As posed in Ref. Reference Isikveren, Pornet, Vratny and Schmidt9, a challenge to the industrial and academic engineering communities was made in seeking ways to decrease the specific weights of electrical sub-systems/components as well as ameliorating the VJB DMC impact is necessary in securing an overall cost neutral outcome. Assuming 85th-percentile stage lengths, for similar battery cell-level energy densities and block fuel outcome of 15-20% reduction, it can be readily observed that a striking similarity in parametric values occurs irrespective of scale effect and mission role (passenger accommodation and flight technique): common values of HP,use = 0.42-0.51 and HE = 0.12-0.16 appear evident. Furthermore, it can be seen these parametric descriptor values tend to generate quite similar values in ◁MTOW, ◁OWE, Release Energy Weight (◁WENR, includes both block and reserves-contingency) and PPS Weight (◁WPPS).
5.0 CONCLUSIONS
This technical paper focused on setting technical targets for a future 19-passenger commuter aircraft employing hybrid-electric, battery-based Voltaic-Joule/Brayton (VJB) motive power systems with no additional electrical energy drawn from generators mechanically coupled to thermal engines. The adopted morphological solution was a tri-prop comprising two on-wing podded turbo-props and one aft-fuselage mounted electric motor configured as a pusher-on-pylon installation. Assuming a Battery System-level Gravimetric Specific Energy (referred to as “battery energy density”) of at least 500 Wh/kg, block fuel reduction of up to 39%, 25% and 10% for 150 nm (Design Service Goal), 430-nm (85th-percentile) and 700-nm (maximum range) stage lengths, respectively, could be realised. All utilise electrically powered ground manoeuvring and quoted comparisons are against a suitably projected turbo-prop only year-2030 aircraft. From a Cash Operating Cost perspective, all investigated stage lengths were predicted to be around 8-14% higher relative to the datum of a projected turbo-prop only year-2030 aircraft. Upon comparison of this 19 PAX VJB to previously studied 70-passenger and 180-passenger VJB concepts, a common theme of Degree-of-Hybridization for Useful Power, HP,use = 0.40-0.50, and Degree-of-Hybridisation for Stored Energy, HE = 0.120-0.150, for a given block fuel outcome of 15-20% reduction, appeared evident.
ACKNOWLEDGEMENT
Gratitude is conveyed to the following individuals for their contributions to the analysis and work presented in this technical article:
-
• Aurelie Boisard, SAFRAN S.A.
-
• Gäetan Chesneau, SAFRAN S.A.
-
• Radu Cirligeanu, SAFRAN S.A.
-
• Anthony Gimeno, SAFRAN S.A.
-
• Nawal Jaljal, SAFRAN S.A.
-
• Hugo Jouan, ISAE-SUPAERO Intern
-
• Julien Labbe, SAFRAN S.A.
-
• Pierre-Alain Lambert, SAFRAN S.A.
-
• Samer Maalouf, SAFRAN S.A.
-
• René Meunier, SAFRAN S.A.
-
• Benoit Rodriguez, SAFRAN S.A.
-
• Arturo Santa Ruiz, Georgia Tech Intern
-
• Andy Turnbull, SAFRAN S.A.


