


INTRODUCTION
The last two decades have witnessed an unprecedented speed of transformation in emerging economies, such as China (e.g., Bosworth & Collins, Reference Bosworth and Collins2008). The appearance of the Chinese economy in the world stage has coincided with a shift towards domestic economic liberalisation, openness to trade, and foreign investment. Recently, Chinese companies are rapidly approaching the global technology frontier by investing in the early stages of the innovation–productivity chain (Duysters, Cloodt, Schoenmakers, & Jacob, Reference Duysters, Cloodt, Schoenmakers and Jacob2015).
Despite their achievements at the macro level, Chinese firms must improve their innovative behaviour to catch up with global leaders. Firstly, only a small percentage of firms is currently active in research and development (R&D). Furthermore, large differences exist across different types of Chinese firms with respect to their innovative behaviour. For example, Huawei, a privately-owned telecommunication manufacturer, has heavily invested in R&D to catch up with global leaders, whereas ZTE, a major state-owned company in the sector, invests less than 10% of Huawei's R&D investment. Even if Chinese companies are driven by various innovation behaviours and strategies (e.g., Fu, Reference Fu2015; Lee & Lee, Reference Lee and Lee2018), different types of firms can still develop towards an innovation-driven economy in China.
Secondly, the policy of China's ‘market for technology’, which is regarded as an important policy engine for a technology-poor country, has been criticised or re-evaluated owing to the limited technological spillovers received from multinational corporations (MNCs) (Li, Reference Li2014; Zheng, Jiao, & Cai, Reference Zheng, Jiao and Cai2018). Although research has indicated that foreign MNCs increasingly shift innovation activities to their foreign subsidiaries, empirical evidence shows that the R&D intensity of these firms is still lower than that of domestic companies (OECD, 2009). Whether (or not) firms from developing countries can rely on foreign technology to catch up with their counterparts in the industrialised world is a timely question to address. These phenomena drive us to explore the micro heterogeneity of innovation performance among different types of companies. Given that these innovation strategies led to an increase in firm-level productivity and innovation output during China's transition from a planned-market to a mixed-market economy, various types of Chinese firms have differently responded in their strategies to the extent of market competition. However, research rarely addresses the question as to what extent do innovation strategies vary among the types of Chinese firms depending on the form of market competition. In this context, we address this gap by linking market competition and firm ownership by using a CDM model (Crépon, Duguet, & Mairesse, Reference Crépon, Duguet and Mairesse1998).
Research on firm-level innovation–productivity chains has extensively relied on the use of the CDM model to examine the patterns of firm-level innovation in developed (e.g., Mairesse & Mohnen, Reference Mairesse and Mohnen2004; OECD, 2009) and developing countries (e.g., Benavente, Reference Benavente2006; Jefferson, Huamao, Xiaojing, & Xiaoyun, Reference Jefferson, Huamao, Xiaojing and Xiaoyun2006; Friesenbichler & Peneder, Reference Friesenbichler and Peneder2016). Despite a surge of research in the tradition of CDM modelling, recent studies have started to distinguish between foreign- and domestic-owned firms (Siedschlag & Zhang, Reference Siedschlag and Zhang2015). However, different ownership structures exist for businesses in China, ranging from state-owned enterprises (SOEs) and privately-owned (PO) firms to companies based on Hong Kong-, Macau-, or Taiwan-funded ownership (HMT) and foreign-funded ownership (FFO). The CDM model can provide advantages in investigating the innovation strategies of Chinese manufacturing firms. Firstly, the model can be used to examine the extent to which these firms effectively deploy and utilise R&D resources. Given that the firm-level performance of Chinese companies depends on their ability to innovate, acquire and diffuse new technologies, understanding their contribution to the world's stock of industrial knowledge is important (Jefferson et al., Reference Jefferson, Huamao, Xiaojing and Xiaoyun2006). Secondly, the model can investigate Chinese firms according to their ownership structure. These types of firms are embedded in different institutional environments affected by determinants, such as the tax system and the forms of government subsidies (Huang, Wu, Mohnen, & Zhao, Reference Huang, Wu, Mohnen and Zhao2013). These determinants can, in turn, influence firm behaviours and innovation strategies, which provides a unique and ideal place through which various roles of ownership can be explored (Lee & Lee, Reference Lee and Lee2018). An augmented CDM model is used to empirically investigate the innovation strategies of different ownership types of Chinese companies to catch up, depending on the extent of competition in the industry.
THEORETICAL BACKGROUND AND HYPOTHESES
Business decision making among different types of firms follows distinct behavioural patterns termed ‘routines’, which plays the role as being played by genes in biological evolutionary theory (Nelson & Winter, Reference Nelson and Winter1982). Specifically, the unique DNA in each ownership type determines the possible behaviour and the persistent feature of the organism. Focusing on the types of firms in China in terms of their ownership, this study explores the effects of different forms of market concentration on innovation decisions and performance. The innovation routines of each ownership type of Chinese company within a modified CDM framework are examined, accounting for the extent of market concentration in the industry.
Different types of firms vary in the way they address the different stages in the innovation – productivity chain according to the various technological regimes and institutional environments they operate in. To investigate the impact of innovation on firm productivity, the CDM model argues that firm decisions at the four stages of the innovation – productivity chain must be analysed. (1) Firstly, firms must decide whether (or not) to engage in innovative activities. (2) If firms decide to engage in innovation, then a specific amount of resources must be allocated to invest in R&D activities. (3) Subsequently, innovative input leads to innovative output (e.g., new products). (4) Finally, innovative output affects firms’ labour productivity.
Different ownership structures exist for businesses in China, ranging from SOEs and PO to HMT and FFO. Given that SOEs are, by law, mostly operating in a concentrated industry, they display several characteristics expected from state-directed companies. Corporate governance in these enterprises means that the state is involved in each decision at the firm level due to their legal form with the state being the main shareholder. Furthermore, SOEs represent the state interest during each stage of national economic development, from a latecomer to the current period in China.
With regard to the DNA of SOEs, state ownership is an important factor in managing SOEs to decide whether to invest in R&D. SOEs can make this decision more easily than other types of Chinese firms due to their focused strategy and the ample supply of available resources, which are also supported by the national strategy of the Chinese government. For SOEs, with the state as the main shareholder, policy decisions are their driving investment, rather than management decisions responding to market conditions. SOEs are better equipped in terms of possessing high-quality innovation resources, such as R&D funding, human resources and cooperation with local universities (e.g., Chen, Li, Shapiro, & Zhang, Reference Chen, Li, Shapiro and Zhang2014), than other firms in China. Moreover, government intervention and a lack of incentives for managers cause these SOEs to maximise individual interests in the short term rather than generating long-term profits (Xia & Walker, Reference Xia and Walker2015). Therefore, managers in SOEs likely invest in production projects that can quickly provide revenues rather than innovation projects that involve long-term costs and are prone to high risks. The State Council of China is increasingly requiring SOEs to innovate and to catch up with Western competitors, forcing them to further engage in innovative activities. As a result, Chinese state-owned firms make additional efforts during the first two stages of the innovation – productivity chain to catch up with their international competitors at the global technology frontier. This kind of policy-driven innovation incentivises state-owned firms to invest in R&D resources to complete their ‘task’ as mandated by the government. However, these firms may have little incentive to increase their subsequent innovative outcomes and labour productivity. As a result, Chinese state-owned firms are prone to engage in R&D activities and allocate additional resources to the R&D process independent of the effect on their innovation output and productivity gains.
Given that most SOEs are operated in concentrated markets or are managed as large firms, their routines are mainly determined by policy decisions and market conditions. Castellacci (Reference Castellacci2011) proposed an extension of the CDM approach to examine the effects of market competition on innovative behaviour by proposing that the Schumpeterian effect (i.e., a negative effect of the degree of competition on firms’ R&D and innovation activities) is mainly relevant during the first two stages of the innovative process. By contrast, the escape-competition effect (i.e., a positive effect of this relationship) is likely observed when the focus is on the subsequent two stages. These effects have not been examined for SOEs. Chinese SOEs have low productivity no matter how strong the market competition is (e.g., Zhang, Zhang, & Zhao, Reference Zhang, Zhang and Zhao2001). However, SOEs, which face competition with each other in the same sector or competition from emerging non-SOEs and privatised SOEs, may drive managers to decide in favour of investing in R&D and to produce additional innovation products. The degree of market competition, to a certain degree, promotes SOE firms’ R&D activity and innovation performance. From this argument, we derive the following hypotheses:
Hypothesis 1a: The probability of SOEs deciding to engage in innovation and the amount of resources allocated to R&D are higher compared to other types of firms.
Hypothesis 1b: The probability of SOEs deciding to engage in innovation and the amount of resources allocated to R&D are not affected by market competition.
Hypothesis 1c: Market competition favours SOEs to produce additional innovative products but does not affect the improvement of their labour productivity.
Compared to domestic firms, FFO companies enjoy advantages from the ownership of specific assets, such as technology, brand image and marketing and management capabilities (Dachs, Ebersberger, & Lööf, Reference Dachs, Ebersberger and Lööf2008). Foreign firms transfer these advantages from their home market to the host country. FFO firms are engaged in two types of innovation strategies: asset-exploiting and -seeking (Narula & Zanfei, Reference Narula and Zanfei2005). Firms pursuing an asset-exploiting strategy mainly replicate the innovation activities of the parent company given the centralisation of activities in the home country. The main R&D activities at the foreign subsidiary level are related to modifying products or processes to adapt them to local conditions (Dachs & Ebersberger, Reference Dachs and Ebersberger2009). For example, any attempt to coordinate international innovative activities is overly costly due to the difficulties of collecting and controlling relevant information across national borders (Vernon, Reference Vernon1966). Host countries and foreign subsidiaries can then play a key role in adopting and diffusing technology that has been developed at home. Firms using an asset-seeking strategy aim to improve their existing assets or to acquire or create completely new technological assets through R&D facilities located abroad. Such firms mainly rely on the knowledge stock and quality of the host country.
Even though research has indicated that foreign firms increasingly shift innovation activities to their foreign subsidiaries, the empirical evidence also shows that the R&D intensity of foreign firms remains lower than that of domestic firms (OECD, 2009). With respect to innovation output, previous research has demonstrated that foreign firms are more innovative than domestic firms (Love & Roper, Reference Love and Roper2001; Sadowski & Sadowski-Rasters, Reference Sadowski and Sadowski-Rasters2006). Currently, most foreign firms in China adopt an asset-exploiting strategy because China is a technology latecomer. Furthermore, these firms take China as their manufacturing base, owing to cheap labour and raw materials. Compared to SOEs, foreign firms are inclined to exert less efforts during the first two stages of the innovation – productivity chain but achieve high innovation and productivity performance. By investing in innovative activities and utilising the embeddedness in the national innovation system, foreign firms can escape fierce competition and raise technological entry barriers whilst simultaneously producing high innovation output and labour productivity (e.g., Dachs et al., Reference Dachs, Ebersberger and Lööf2008).
Most foreign firms in China are at the technology frontier in their respective fields. Considering the frequent product improvement and competition in other domestic latecomers, foreign firms must be proactive in developing their new products to escape fierce competition and raise technological complexity and technology barriers. Therefore, foreign firms are more efficient in their innovation activity than domestic private firms in competitive markets compared to less concentrated industries. Labour productivity improvements are realised over the long term and determined by the ‘genes’ of foreign firms to a lesser extent by the external environment. These arguments lead to the following hypotheses:
Hypothesis 2a: Foreign firms have high labour productivity in general, which is not influenced by market competition.
Hypothesis 2b: Foreign firms can produce additional innovative products if they are operating in a competitive market.
Another type of foreign firm in China is the so-called Hong Kong-Macau-Taiwan (HMT) company. Firstly, HMT companies are technically foreign firms with a high degree of technology accumulation and extensive experience in cooperating with other foreign companies. Secondly, HMT companies are more familiar with the Chinese environment than other types of foreign firms because the senior managers know the Chinese language and culture well and may have relatives or other kinds of guanxi in mainland China. Most HMT firms invest in labour-intensive industries (such as Foxconn) and gain cost advantages based on cheap materials, labour and potential large markets. Although HMT companies can achieve higher innovation performance than private firms, they are not inclined to invest substantial innovation resources in China. Huang and Sharif (Reference Huang and Sharif2009) found that HMT firms contribute to productivity growth in Guangdong domestic manufacturing companies but are less active than those domestic firms in pursuing R&D and innovation activities. To achieve cost advantages, HMT companies invest additional resources to organise their companies, thus improving labour productivity if they are operating in a competitive market. Based on these statements, the following hypotheses are proposed:
Hypothesis 3a: The probability of HMT firms deciding to engage in innovation and the amount of resources allocated to R&D are low.
Hypothesis 3b: HMT firms have high labour productivity in general, and this effect can be strengthened if they are operating in a competitive market.
METHODS
Data, Indicators, and Descriptive Evidence
To examine the joint effect of ownership and market competition on the innovation – productivity chain during the dramatic period of growth in China before the 2008 crisis, we tested our hypotheses by using data from the Chinese Industrial Enterprises database. Owing to the limited availability of data on innovation investment and innovation output, the data for the period 2005–2007 can be used. We employed a rigorous procedure to generate our sample and to effectively utilise the database.Footnote [1] Firstly, we excluded all observations where the number of employees is fewer than eight (given that such enterprises neither have reliable accounting systems nor any R&D capability). Secondly, we eliminated observations for firms that did not comply with the financial accounting system. For example, total assets are less than current assets, total assets are less than the net value of fixed assets or accumulated depreciation is lower than current depreciation. Thirdly, we dropped cases where the value for training is less than 0 and the industrial added value is less than 0. Lastly, we deleted observations for enterprises with sales of less than 5 million RMB. After this procedure, our sample included 776,196 firm-level observations (341,898 companies in total). Among these companies, innovative firms accounted for 14.60%. The percentage of firms with state ownership was 2.61% (8,911 firms). The share of foreign firms was 11.54% (39,468 firms). The proportion of firms with HMT ownership was 10.61% (36,306 firms), and the share of private firms was 77.47% (264,880 firms).
We used the following indicators for the empirical analysis, all of which were available for the companies in the sample and had identical definitions throughout the reporting periods.
LP: Labour productivity calculated by main business income divided by employment, log (1+).
IO: Innovation output calculated by the turnover from the commercialisation of new products and their share of total value of industrial output, log (1+)
R&D: R&D intensity calculated by R&D investment divided by main business income.
Prob(R&D): A dummy variable that indicates whether firms perform R&D activities each year.
HHI: Hirschman-Herfindahl Index defined as the sum of squares of firms’ main business income shares in each four-digit industry all over China.
We used the classification provided by the State Statistical Bureau of China to clearly define ownership for the different types of firms. Based on this classification, we divided enterprises into four categories: state-owned companies (SOE, registration codes: 110, 141, 143, 151); private firms (PO, registration codes: 120, 130, 131, 142, 149, 159, 160, 171, 172, 173, 174, 190); HMT-funded ownership companies (HMT, registration codes: 210, 220, 230, 240) and foreign-funded companies (FFO, registration codes: 310, 320, 330, 340).
Certain control variables were included in the analysis. (1) Size, number of employees (log); (2) Age, report year minus firm's open year and add one; (3) Exporting, a dummy variable that indicates whether a firm exports products; (4) Debt Ratio, liabilities divided by assets to measure firms’ state of operations, log (1+) and (5) Training, expenditure on training divided by the number of employees to measure firms’ capability of exploiting R&D, log (1+). In addition to these variables, we also used the control variables of the industry structure in each city. In specifically, we consider all four-digit sectors i fall exclusively under a two-digit sector S g, where g = 1, 2, …, G. Specialisation (SPE Index) is calculated by Hirshman-Herfindahl index of employment in two-digit sectors in each city, given by $Spe_r = \mathop \sum \nolimits_{g\in S_g} \lpar {{E_g} \over {E_r}}\rpar ^2$ , where E g is the employment in sector g in city r, and E r is the total employment in city r,. In line with Frenken, Van Oort, & Verburg (Reference Frenken, Van Oort and Verburg2007), related variety (RV Index) is measured as the weighted sum of entropy at four-digit level within each two-digit sector. It is calculated as $RV = \mathop \sum \nolimits_{g = 1}^G P_gH_g$
 , where $H_g = \mathop \sum \nolimits_{i\in S_g} {{p_i} \over {P_g}}log_2\left({{1 \over {p_i/P_g}}} \right)$
 and P g is the share of employment in two-digit sector over the total employment in a city. The entropy at the two-digit level of unrelated variety (UV Index) is given by $UV = \mathop \sum \nolimits_{g = 1}^G P_glog_2\left({{1 \over {P_g}}} \right)$
 . UV Index measures the degree to which employment shares are evenly distributed across unrelated sectors.
Table 1 presents the basic descriptive statistics and the pairwise correlation coefficients for each firm-level variable. It is about 10.9 percent of observations conducting R&D activities. It shows that almost 28% of Chinese firms are doing exporting business, which confirms the export-oriented economy of China. Firms also likely use financial levers according to debt-to-asset ratio (Debt Ratio). In general term, the coefficients of correlation do not indicate the presence of any major problem of multicollinearity among the variables.
Table 1. Descriptive Statistics and correlation coefficients

Notes: A star (*) is added to correlations significant at 1% level after Bonferroni adjustment.
Model Specification and Estimation Methods
We introduced different indicators of firm ownership to reveal how companies are affected by competition in their efforts to innovate. We also included certain control variables, such as firm size and training investment. Furthermore, we defined dummy variables for export activities and industry structure. In line with the CDM model, four estimation equations were indicated: (1) firms’ decision to undertake investments in R&D; (2) the intensity of firms’ commitment to innovation (i.e. R&D or other innovation efforts); (3) a function for knowledge production that links R&D intensity with innovation output and (4) a productivity function taking innovation as an input.
In Equation (1), dependent variable $Prob\lpar {R \& D} \rpar$ is binary, that is, the dependent variable is equal to one if firms invest in R&D input and zero if they do not. We adopted a random effects logit model with robust variance calculation to consider the panel data structure. To show the effect size of independent variables on dependant variable, we will report the coefficients and odds ratio. The model was estimated for the whole sample, including innovative and non-innovative firms. The remaining equations focused on innovative companies only. Equation (2) determines how the R&D intensity of firms is affected by a set of firm-specific characteristics. A random effects model was applied using the GLS estimator to consider the panel data structure.
A random effects estimator is used because it exploits the within and between components of the variability and is therefore efficient. This advantage of the random effects versus that of the fixed effects estimator becomes crucial when the time variation of the data set is limited. For variables that change only slowly over time, the between part of the variance is substantially larger than the within component, and this situation makes fixed effects estimates inefficient and unreliable (Plümper & Troeger, Reference Plümper and Troeger2007). Given the limited time variation in the data set, a fixed effects model cannot estimate the parameters of interest with sufficient precision, whereas the random effects estimator, through exploiting the large cross-section variability of the data set, leads to an efficient estimation in this type of innovation survey context.
Equation (3) estimates the effects of R&D investment on innovation output for firms. We focused on a specific form of innovation output, namely, the commercialisation of new products. Equation (3) is calculated as the share of new products in the total value of industrial output (using a logarithmic function). Lastly, we analysed the effect of innovation output on labour productivity using Equation (4).
An econometric issue with respect to the application of the CDM model is related to the endogeneity of certain explanatory variables. The original CDM model estimates equations simultaneously for cross-sectional data (Crépon et al., Reference Crépon, Duguet and Mairesse1998). Considering the unbalanced panel data structure in our sample, the process of estimation follows Castellacci (Reference Castellacci2011). In particular, Equations (3) and (4) use a 2SLS estimation method to address the possible problem of endogeneity in the following explanatory variables: innovation input (R&D) and HHI in Equation (3) and innovation output (IO) and (HHI) in Equation (4). In Equation (3), the two endogenous variables were instrumented using the following indicators: (1) one-year lag of innovation input (L.R&D), (2) share of innovative companies for each two-digit industry, (3) average firm size, (4) industry concentration (C1), (5) variation of labour productivity (log) in each industry, (6) average labour productivity (log) and (7) average productivity gap in each industry. The first variable was selected as an instrument for the innovation input variable, which indicates the innovation opportunities encountered by each company in each sector. The five other variables measured industry-level characteristics that are used as instruments for HHI. The same instruments are used for HHI in Equation (4). We introduced a one-year lag of innovation output (L.IO) as an instrument for the innovation output variable. This procedure allows the definition of the dependent variable (LP) in a way that the procedure cannot determine the IO in previous years (L.IO). Nevertheless, L.IO is considered related to the current IO.
RESULTS
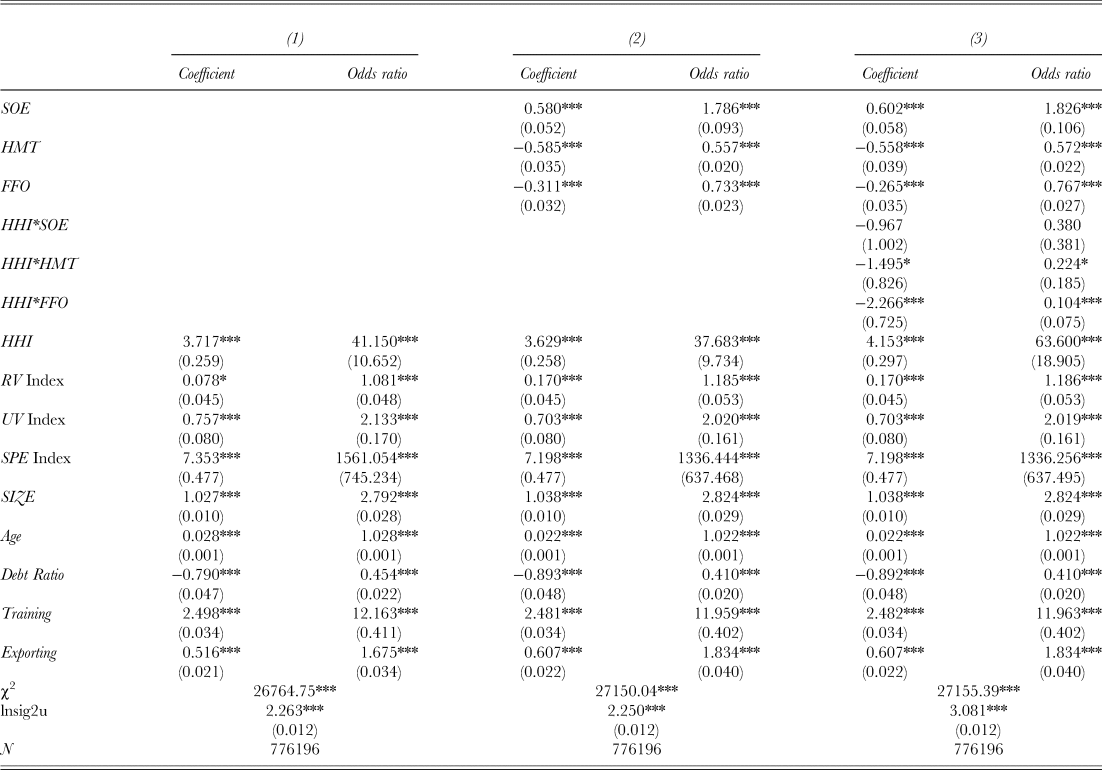
The results from the estimations of the four equations are presented in Tables 2–5. Table 2 focuses on the equation for the propensity to innovate, which estimates the probability that a firm was engaged in R&D activities during the period. Compared to private firms, SOEs (SOE) likely conduct innovation activities, whereas firms with a certain form of foreign ownership (i.e., HMT or FFO) do not likely engage in innovation. The odds ratio shows that the possibility of innovation for SOEs is 1.8 times higher than that of private companies, while firms with foreign ownership have a lower odds ratio which is below one. This result is in line with Hypothesis 1a and Hypothesis 3a. Moreover, foreign firms primarily regard China as a production base, rather than as an R&D base. Compared with firms in the FFO category (odds ratio is 0.8), companies with HMT ownership less likely conduct innovation activities (odds ratio is 0.6), thus reflecting the heterogeneity among foreign companies in terms of R&D investment in the Chinese market.
Table 2. Regression Results (Dependent Variable: Prob(R&D))
Notes: All regressions include a constant, industry dummies, province dummies and time dummies; standard errors in parentheses; * p < 0.1, ** p < 0.05, *** p < 0.01
Table 3. Regression Results (Dependent Variable: R&D intensity)
Notes: All regressions include a constant, industry dummies, province dummies and time dummies; standard errors in parentheses; * p < 0.1, ** p < 0.05, *** p < 0.01
Table 4. Regression Results (Dependent Variable: IO)
Notes: All regressions include a constant, industry dummies, province dummies and time dummies; standard errors in parentheses; * p < 0.1, ** p < 0.05, *** p < 0.01
Table 5. Regression Results (Dependent variable: LP (log))
Notes: All regressions include a constant, industry dummies, province dummies and time dummies; standard errors in parentheses; * p < 0.1, ** p < 0.05, *** p < 0.01
The positive and significant coefficient for the market competition index (HHI) in all regressions in Equation (1) indicates that firms in concentrated industries have, on average, a greater propensity to engage in R&D activities than those in competitive sectors, thereby indicating the existence of the Schumpeterian effect. However, heterogeneity among different types of firm ownership in response to market competition is also present. The insignificant coefficient of HHI*SOE suggests that the innovation probability for SOEs is not mainly influenced by market competition, thus supporting Hypothesis 1b. The negative coefficient of HHI*FFO reveals that the probability of a foreign firm deciding to engage in R&D is higher in a competitive market than in a concentrated environment. The coefficient of HHI*HMT is negative and significant at 0.1 statistical level, which shows the role of market competition in promoting HMT firms to conduct innovative activities.
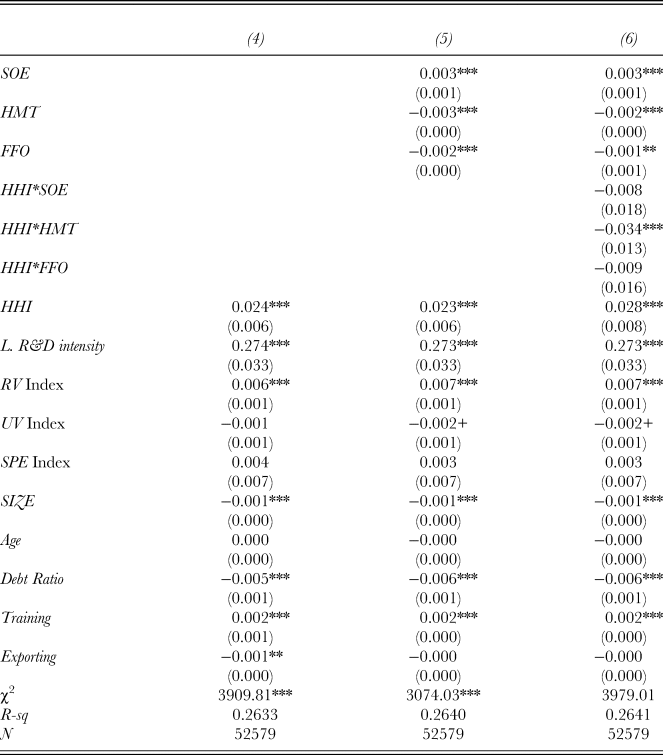
Table 3 presents the results from the estimations of Equation (2), which focuses on the determinants of R&D intensity. Similar to the findings on innovation decision, SOEs, with a positive and significant coefficient (0.003), have a higher R&D investment intensity than private firms, whereas HMT and FFO firms invest less in R&D, with a positive and significant coefficient (−0.002 and −0.001).
The coefficient of variable HHI is positive and significant in all regressions reported in Table 3. Thus, the amount of resources invested in R&D by an enterprise is, on average, greater in an oligopolistic market than in a competitive industry. This result provides further evidence of the existence of the Schumpeterian effect, according to which a high degree of competition decreases firm incentives for investing in R&D and vice versa.
Compared with the interaction variable for ownership and HHI, the interaction variable HHI*HMT is negatively related to the dependent variable, which are significant at the 0.01 level. This again confirms the role of market competition for HMT companies in conducting R&D activities. Hypothesis 1b is supported that market competition has a lower impact for SOE companies to conduct innovation activities.
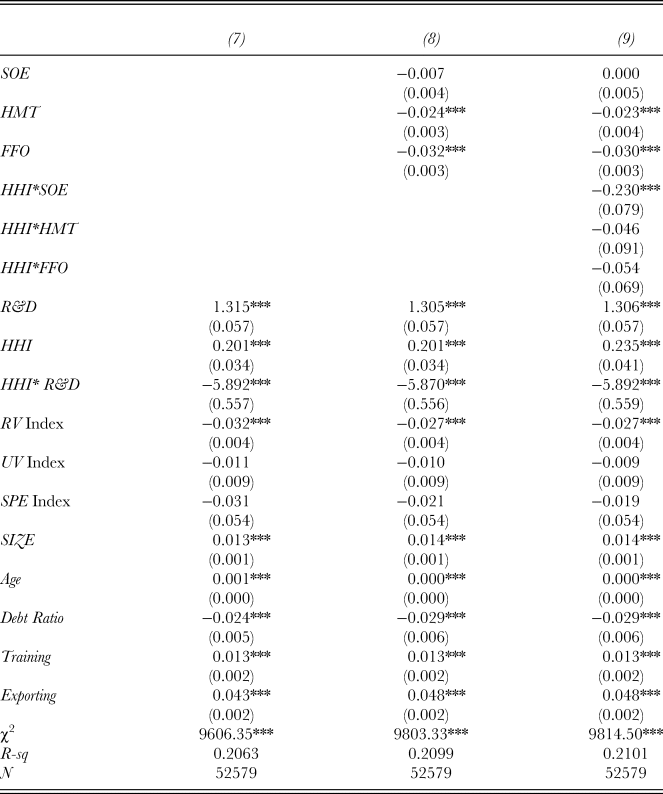
Table 4 reports the results from the estimations of Equation (3), which focuses on the relationship among R&D intensity, innovation output and a set of firm-specific characteristics. The R&D intensity variable, as expected, is positively related to the innovation output dependent variable. The input – output relationship is affected by the level of market concentration, as suggested by interaction variable HHI*R&D. The estimated coefficient for this interaction variable is negative and significant at the 1% level, indicating that the elasticity of innovation output with respect to R&D input is high in competitive industries (existence of the escaping competition effect). The interpretation of this result is that small firms in competitive markets typically have a narrow product range and low turnover. Therefore, the commercialisation of any given number of new products can have a relatively stronger impact than large enterprises in concentrated sectors.
Despite the low innovation performance of SOEs, they can be active in new product development whilst operating in a competitive market according to the negative coefficient of interaction term HHI*SOE (−0.230). The estimates for HMT and FFO firms are negative and significant at the 1% level, revealing the poor firm performance in terms of innovation output. We did not find any support for Hypothesis 2b stating that foreign firms generate higher innovation output if they are operating in a competitive market than in a concentrated industry (see the insignificant coefficient of interaction variable HHI*FFO in Table 4, Column 9). A possible reason is that the innovation output of foreign companies is not affected by market competition in the Chinese market, owing to their specific DNA in innovation routines.
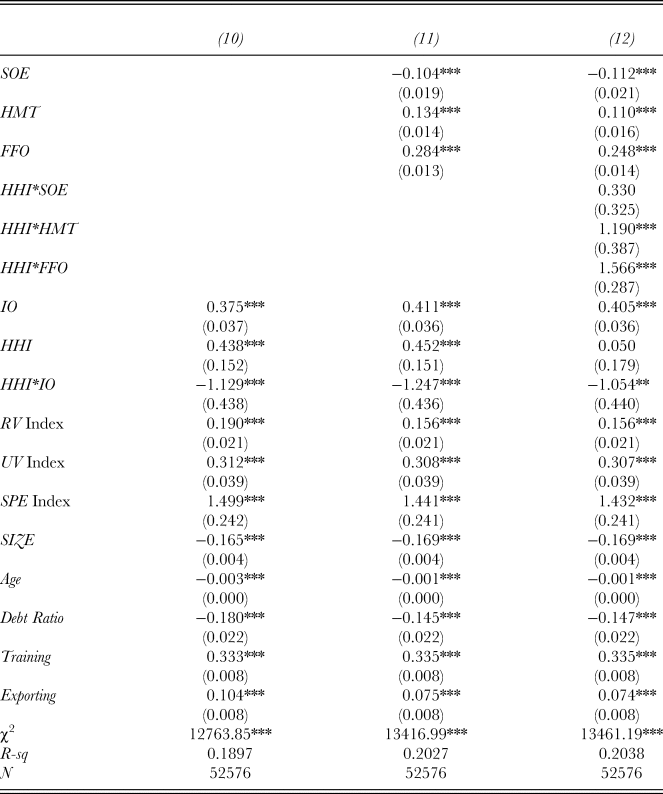
Table 5 reports the results for Equation (4), which focuses on the determinants of labour productivity. In general terms, all estimated coefficients are significant at conventional levels. IO is positively related to LP. Therefore, the commercialisation of new products allows firms to strengthen their competitive position in the market and thus increase their market share, turnover and productivity. The innovation output – productivity relationship is, however, stronger in competitive than in oligopolistic industries, as suggested by the significant and negative coefficient of interaction variable HHI*IO. This result proves the existence of an escape competition effect (Castellacci, Reference Castellacci2011).
SOEs have lower labour productivity during the reported period than private firms, revealing the poor efficiency of Chinese SOEs with respect to their competitive capabilities. The coefficient of interaction term HHI*SOE is insignificant. Thus, market competition does not affect the improvement of the labour productivity of SOEs. Considering the result in Table 4, Hypothesis 1c is supported, which states that market competition favours SOEs to produce additional innovative products but does not affect their improvement in LP.
Compared to domestic companies, foreign firms (HMT and FFO) are more productive than domestic firms as indicated by the significant and positive coefficient of the variables for FFO and HMT. This result is partly due to foreign firms’ great capability in human resource management. The size of the coefficient for FFO firms indicates that they are more productive than HMT companies. This effect can be stronger in a concentrated than in a competitive market, as suggested by interaction variables HHI*FFO and HHI*HMT. The results imply that market competition can decrease the LP of foreign companies, thus Hypothesis 2a and Hypothesis 3b are not supported. The possible reason is that foreign companies can take advantage of monopoly rents when they are operating in a concentrated market.
DISCUSSION
We distinguished among firms according to their ownership structure in SOEs, FFO firms, HMT-owned firms and private companies. We adopted a modified version of the CDM model to investigate the effects of market concentration on the innovation strategies of these types of companies and their performance. By accessing a rich set of panel data on large and medium-size manufacturing firms from 2005 to 2007, we focused on the extent to which competition affects the relationship between innovation and productivity for different types of firm ownership.
Our results reveal that Chinese firms with different types of ownership structure use various innovation strategies. Specifically, SOEs are more active in making innovation decisions and pursuing innovation investments but are less efficient in terms of IO and LP, whereas foreign-owned firms have relatively high LP but are relatively not active during the first three stages of the innovation – productivity chain. By contrast, private firms exhibit their best innovation performance in terms of shares of new products, given that they can be flexible in changing their product design and production based on demand or spill overs from other innovative firms. We did not find any evidence that market competition drives SOEs to decide innovation activities in the first stage of the innovation chain. Nevertheless, market competition favours SOEs to invest more resources and produce additional innovation products. This work has demonstrated a positive effect of market competition on the innovation output for HMT companies. Furthermore, foreign firms are efficient in LP if they are operating in a concentrated market.
Heterogeneity is also observed among the types of firms with respect to their innovation strategies. The empirical results reveal that foreign firms mainly use China as a production base, rather than an R&D base. The main task for foreign firms is to exploit assets and utilise their parent company's knowledge stock. SOEs substantially invest in R&D to catch up with the technological leading companies but usually fail to achieve a high share of new products and increased LP.
Our results have certain implications for technology transfer in emerging economies. Given that SOEs provide a wide range of social services to employees and their families to maintain social stability, managers may focus on increasing (rather than maximising) output. The advantages SOEs enjoyed under a favourable government policy have not led to the expected productivity gains. However, the reallocation of innovation resources (financial and human) from the government sector to the private sector may still yield social welfare gains. On the one hand, this reallocation provides possibilities for outsourcing R&D activities and opportunities for private companies. On the other hand, it can provide incentives that motivate private firms with potential of innovative capability that can stimulate market competition. Previous research on Chinese SOEs (e.g., Bai, Lu, & Tao, Reference Bai, Lu and Tao2009) has proposed that privatisation – like gene therapy – can activate functions within firms leading to high innovation efficiency and labour productivity. Local Chinese firms can easily catch up through technology spillovers from firms under HMT ownership. However, most HMT firms are active in labour-intensive industries, where technology spillovers are not a significant factor affecting innovation strategies. Policymakers should encourage HMT firms to move into knowledge-intensive sectors in Chinese industries, which may lead to increasing technology and knowledge spillovers. In China, foreign firms still play an important role in technology transfer. However, most of them merely replicate technology developed at home during this period. Policymakers can foster technology transfer by inviting other foreign firms to locate in China and encouraging them to set up research centres and cooperate with local firms in various ways. This policy enhances the innovation capability of local firms that may, in turn, stimulate market competition and promote technology transfer and can further lead to increased cooperation and high performance for foreign and local firms. Policy intervention is necessary, targeting foreign firms’ low propensity to engage in innovation activities, to unleash foreign firms’ full innovative potential and to generate the greatest local value from international corporate networks. However, given that the role of competition as a determinant of labour productivity is limited, improving labour productivity by focusing on firm-specific characteristics, such as the quality of the labour force and R&D capabilities, may be viable.


