


Introduction
Weeds directly compete with crop yield in agricultural systems; thus, weed management is consistently a top priority among farmers. Despite centuries of eradication efforts, weed communities remain viable across the agricultural landscape. Therefore, if weed communities cannot be completely eliminated from the agroecosystem, it may be useful to address the potential utility of those weed communities. Biodiversity has been shown to provide many ecosystem services; thus, increasing the biodiversity of the weed community may provide significant benefits to the crop and surrounding ecosystems. These benefits might include: improvement of soil chemical, physical and biological characteristicsReference El Titi, Glen, Greaves and Anderson1, improvement of habitat for beneficial insects and natural enemies of weedsReference Altieri2 and reduced soil erosion and chemical runoffReference Zimdahl3. Moreover, a diverse weed community may prevent the rapid accumulation of a single weedy species, due to interspecific competitive interactions. Modern agricultural practices have led to a decline in the diversity of weeds in agroecosystems due to widespread use of herbicides and simplicity of crop rotationsReference Leeson, Sheard and Thomas4, Reference Murphy, Clements, Belaoussoff, Kevan and Swanton5. Herbicide use reduces weed species diversityReference Mahn6–Reference Menalled, Gross and Hammond9, whereas crop species diversity promotes weed species diversityReference Palmer and Maurer10. This suggests that complex crop rotations may lead to an increase in weed diversityReference Murphy, Clements, Belaoussoff, Kevan and Swanton5. Organic agricultural certification prohibits the use of synthetic herbicides and requires the use of soil-building crop rotations11. As a result, many now view organic agriculture as a means of protecting biodiversity within agroecosystems.
Biodiversity can be measured using two components: species richness and species evenness. Species richness is the total number of species in a given ecosystem and species evenness is the relative proportion of each species in the ecosystemReference Hooper, Chapin and Ewel12. A diverse community maintains high species richness and high species evenness. There are several methods for measuring weed density and diversity. The above-ground weed population sampling is a common method for quantifying current weed communities, and recent studies have demonstrated an increase in the diversity of the weed community in organic systems using this methodReference Hald13–Reference Davis, Renner and Gross17. Seedbank sampling is another method used to quantify weed communities, but is different as it characterizes the past, present and future of the weed community for a given agricultural field. Seedbanks act as the ‘memory’ of a weed community, because many weed seeds persist in the soil for more than one year, and may not represent the total or potential above-ground community in a particular yearReference Cavers18, Reference Thompson, Bakker and Bekker19. The longevity of many weed species in the seedbank contributes to the ‘buffering effect’ of the seedbank communityReference Buhler, Hartzler and Forcella20. Despite the above-ground management practices, the seedbank acts as a reservoir of biodiversity for arable weed species due to this buffering effectReference Barberi and Lo Cascio21. Overall, the weed seedbank is a better indicator of weed pressure than the above-ground measurements of populationReference Mayor and Dessaint22. The weed stand will vary by year depending on the weather, whereas the weed seedbank is relatively less sensitive to year-to-year differences in weed population, and can reflect the interaction of weeds and management strategies over time. The increase of weed diversity in organic systems has also been demonstrated using the weed seedbank sampling methodologyReference Menalled, Gross and Hammond9.
The diversity of the weed seedbank may not always correlate to the diversity of the above-ground weed community. In a previous study, the total weed biomass and the above-ground diversity were greater in an organic system compared to conventional, but weed seedbank species diversity was lower in the organic systemReference Davis, Renner and Gross17. The persistence of a few dominant weed species in the seedbank may artificially drive weed species evenness lower, leading to an overall decrease in the weed seedbank species diversityReference Squire, Rodger and Wright23, Reference Hyvonen and Salonen24. However, weed management practices often prevent the domination of one weed species in the above-ground weed community, resulting in increased weed species evenness in the standing communityReference Legere, Stevenson and Benoit25. If dominant weed species are not managed, organic agriculture may not be a viable solution for the maintenance of biodiversity in agroecosystems. If dominant weed species are managed, one could expect the weed seedbank and the above-ground diversity to be greatest in organic systems, due to the complexity of crop rotationsReference Murphy, Clements, Belaoussoff, Kevan and Swanton5 and least in conventional systems, due to the intensive use of herbicidesReference Mahn6–Reference Menalled, Gross and Hammond9. While the relationship between organic cropping systems and weed diversity has been well established in the above-ground weed community, fewer studies have examined this relationship in the weed seedbank community of long-term crop rotations.
Crop rotation, weed density management and nutrient inputs may also have an effect on the weed seedbank diversity and relative quantity of grass and broadleaf species within a system. Grass and broadleaf weed populations are often related to the growth habit, phenology and morphology of the different crops in rotationReference Menalled, Gross and Hammond9, Reference Liebman and Dyck26, Reference Barberi, Silvestri and Bonari27. A rotation that includes perennial forage such as alfalfa favors grass weed species and winter annuals that can withstand multiple cuttings, and in turn reduces the population of summer annual broadleaf weedsReference Clay and Aguilar28–Reference Cavigelli, Teasdale and Conklin31. The source of nutrient enrichment in a rotation may also influence the composition of the weed community. Menalled et al.Reference Menalled, Liebman and Buhler32 observed a 64% increase in waterhemp (Amaranthus rudis, a broadleaf weed species) biomass, due to the application of composted swine manure compared to the no-compost control. Therefore, the complexity of the rotation, the individual crops in rotation and the form of nutrient enrichment (e.g., animal manure, green manure and synthetic fertilizer) all may influence the weed community. Understanding the factors that influence weed communities in long-term crop rotations will be especially useful to organic farmers, who consistently rank weed management as the most important research priorityReference Walz33, 34.
The objective of this study was to evaluate weed seedbank density, weed species richness, evenness and diversity, along with the above-ground grass and broadleaf weed abundance and broadleaf weed diversity, within and among organic and conventional crop rotations. We hypothesized that (1) weed species richness, evenness, diversity, density and above-ground biomass will each be greatest in the organic crop rotations and (2) within organic and conventional crop rotations, the species richness, evenness and diversity will increase and weed density and above-ground biomass will decrease as the diversity of the rotation and management system increases. The results of this study will generate insights useful for designing appropriate crop rotations and weed management strategies that aim to minimize weed density and above-ground biomass while increasing biodiversity.
Materials and Methods
Cropping systems
A long-term crop rotation experiment was conducted at the University of Nebraska Agricultural Research and Development Center near Mead, Nebraska, USA. It was initiated in 1975 and redesigned in 1996 to evaluate the productivity of organic and conventional rotations (CRs) that differed in crop rotational diversity, weed management and nutrient inputs. The dominant soil type at the site is a Sharpsburg silty clay loam (fine, smectitic, mesic typic Argiudoll) with 0–5% slopesReference Lesoing35. The total area of the experiment is 4 ha and fields have been managed without irrigation since initiation.
The experiment was designed as a split-plot randomized complete block with four replicate blocks and 13 experimental units (whole plots) per block. Whole plot treatments in this study consisted of management treatments within crop rotations, which are appropriate for long-term cropping systems researchReference Drinkwater36. Treatments within a block included four management treatments: CR, diversified conventional rotation (DIR), organic animal manure rotation (OAM) and organic green manure rotation (OGM). These four management treatments were established in 1996. While the organic treatments were not certified, they have been managed according to Organic Crop Improvement Association (OCIA, Lincoln, Nebraska, USA) certification guidelines since 1996. From 1975 to 1995, previous treatments at this site included continuous corn with synthetic fertilizer and herbicides (HFI CC), a 4-year rotation with synthetic fertilizer and herbicide inputs (HF), a 4-year rotation with manure only (ORG) and a 4-year rotation with only synthetic fertilizer inputs (FO). In 1996, the HFI CC treatment was converted to CR, the HF converted to DIR, the ORG was renamed the OAM treatment (but did not change in practice) and the FO was converted to OGM. A panel of local farmers was consulted in the design and management of crop rotations at the onset of the experiment, and prior to the changes in 1996. Thus, the rotations in this experiment include crops and management practices typical to eastern Nebraska.
The current DIR, OAM and OGM treatments were each replicated four times within each block so that each entry point of the 4-year crop sequence was present each year within each block. The CR treatment is present in only one experimental unit per block; therefore, each entry point of its 4-year crop cycle is not represented in each block. Each whole-plot experimental unit in the study was 0.047 ha (12.2 m×38.4 m). Split-plots were created in 1996 resulting in two crop rotation sequences within each whole-plot management treatment. The split-plot sequences were added to include sorghum in the corn phase of each rotation.
Detailed crop sequences for the four management treatments are summarized in Table 1. The CR treatment was maintained in a corn–soybean–sorghum–soybean (sequence 1) or sorghum–soybean–corn–soybean (sequence 2) rotation with synthetic fertilizer, herbicides and mechanical tillage. The DIR treatment was in a corn–sorghum–soybean–winter wheat rotation (sequence 1) or a sorghum–corn–soybean–winter wheat rotation (sequence 2), and was also managed with synthetic fertilizer, herbicides and mechanical tillage. The OAM treatment included soybean–corn–soybean–winter wheat (sequence 1) or soybean–sorghum–soybean–winter wheat (sequence 2), and was typically managed with frequent mechanical tillage for weed control and bovine manure applications before the corn/sorghum or winter wheat phase of the rotation. Lastly, the OGM treatment included an alfalfa–alfalfa–corn–winter wheat rotation (sequence 1) or an alfalfa–alfalfa–sorghum–winter wheat rotation (sequence 2). Management of the OGM treatment included frequent mechanical tillage for weed control and limited bovine manure applications to alleviate potential phosphorus deficiency. Based on a 13-year average analysis of the bovine feedlot manure source utilized in the organic treatments, the total nitrogen content was 1.42% and the total phosphorus content was 0.72% (dry matter basis).
Table 1. Rotational sequences for each management treatment in the Long-Term Crop Rotation experiment at the University of Nebraska Agricultural Research and Development Center near Mead, Nebraska. The experiment was initiated in 1975 and the crop rotation sequences indicated were initiated in 1996: conventional rotation (CR), diversified conventional rotation (DIR), organic animal manure rotation (OAM) and organic green manure rotation (OGM). The 2007 season concluded the third cycle of the current rotation sequences.

For analysis of the weed community, the two sequences within a management treatment were always pooled, because weed communities were similar between the corn and sorghum split-plots. The differences between split-plot sequences were considered for yield and economic analysis (data not shown).
For the OGM treatment, alfalfa was planted in rows spaced 0.25 m apart and typically occurred between early August and late September. Alfalfa was then cut and baled three times per season and destroyed with a moldboard plow at the end of the second year. For the DIR, OGM and OAM treatments, wheat also was planted in rows spaced 0.25 m apart. Wheat was typically planted between mid-October to mid-November. Soybeans in the DIR treatment were planted in rows spaced 0.25 m apart, but for all other treatments soybeans were planted in rows spaced 0.76 m apart to allow mechanical inter-row cultivation. The timing of soybean planting was typically mid-May to late-May for all treatments. Corn and sorghum were planted in rows spaced 0.76 m apart for all treatments. Corn was typically planted between late-April to mid-May, while sorghum was planted between mid-May to late-May. The timing of field operations for corn, sorghum, soybean and wheat within each treatment are summarized in Tables 2–5, respectively.
Table 2. Typical field operations and rates for corn in four long-term cropping systems at the UNL ARDC near Mead, Nebraska in 2007 and 2008. Numbers in parentheses indicate the years in which the particular application occurred. CR, conventional; DIR, diversified conventional; OAM, organic animal manure based; OGM, organic green manure based.

1 Spring disking occurred twice on April 20, 2007 and twice on May 13, 2008 in all treatments.
2 Field cultivation occurred on May 14, 2007 in all treatments.
3 PRE herbicides were applied to the CR and DlR treatments on May 17, 2007 and May 21, 2008.
4 In 2007, corn was planted on May 14 in the CR and OAM treatments and on May 17 in the DIR and OGM treatments. In 2008, corn was planted on May 15 in all treatments.
5 In 2007, inter-row cultivation occurred on June 7 and 21 in the OAM and OGM treatments and June 21 in the CR and DIR treatments. In 2008, inter-row cultivation occurred on June 19 in all treatments.
6 In 2007, the OAM and OGM treatments were rotary hoed twice on May 17 and once more on May 21. In 2008, the OAM and OGM treatments were rotary hoed twice on June 3.
7 In 2008, the OAM treatments were hand weeded on August 1, and all treatments were hand weeded on August 13 or 20.
Table 3. Typical field operations and rates for sorghum in four long-term cropping systems at the UNL ARDC near Mead, Nebraska in 2007 and 2008. Numbers in parentheses indicate years in which the particular application occurred. CR, conventional; DIR, diversified conventional; OAM, organic animal manure based; OGM, organic green manure based.

1 Spring disking occurred twice on April 20, 2007 and twice on May 13, 2008 in all treatments.
2 Field cultivation occurred on May 21, 2007 in all treatments.
3 PRE herbicides were applied to the CR and DlR treatments on May 23, 2007 and May 21, 2008.
4 Sorghum was planted on May 22, 2007 and May 20, 2008 in all treatments.
5 POST herbicides were applied to the CR and DIR treatments on July 3, 2008.
6 Inter-row cultivation occurred on June 20, 2007 and July 1, 2008 in all treatments.
7 In 2007, the OAM and OGM treatments were rotary hoed on June 7 and 11. In 2008, the OAM and OGM treatments were rotary hoed on June 3 and 10.
8 In 2007, the OAM and OGM treatments were hand weeded on July 24. In 2008, the OGM treatment was hand weeded on July 23, the OAM treatment was hand weeded on August 1, and all treatments were hand weeded on August 13 or 20.
Table 4. Typical field operations and rates for soybean in three long-term cropping systems at the UNL ARDC near Mead, Nebraska in 2007 and 2008. Numbers in parentheses indicate years in which the particular application occurred. CR, conventional; DIR, diversified conventional; OAM, organic animal manure based.

1 Spring disking occurred twice on April 20, 2007 and twice on May 13, 2008 in all treatments.
2 In 2007, field cultivation occurred on May 21 in all treatments and once more on May 29 in the CR and OAM treatments. In 2008, field cultivation occurred twice on June 3 in the unplanted OAM plots and once in the CR treatment.
3 In 2007, PRE herbicides were applied to the DIR treatment on May 17 and to the CR treatment on May 31. In 2008, PRE herbicides were applied to the DIR treatment on May 21.
4 In 2007, soybeans were planted on May 21 in the DIR treatment, May 21 or May 29 in the OAM treatment and on May 29 in the CR treatment. In 2008, soybeans were planted on May 20 in the DIR treatment, May 20 (early) or June 4 (late) in the OAM treatment and on June 4 in the CR treatment.
5 In 2007, POST herbicides were applied to the CR and DIR treatment on July 12 or 16. In 2008, POST herbicides were applied to the CR treatment on June 17, July 30 and August 4 and to the DIR treatment on July 3.
6 In 2007, inter-row cultivation occurred on June 21 in the CR and OAM treatments and again on July 18 in the OAM treatment. In 2008, early soybeans in the OAM treatment were cultivated on June 30 and July 11 and the late soybeans in the OAM treatment were cultivated on July 2 and July 10. The CR treatment was cultivated on July 10 and 31.
7 In 2007, the OAM treatment was rotary hoed on June 6, 7 and 11. In 2008, early soybeans in the OAM treatment were rotary hoed twice on June 3 and once on June 10. Late soybeans in the OAM treatment were rotary hoed once on June 10 and twice on June 23. The CR treatment was rotary hoed twice on June 23.
8 In 2007, the OAM treatment was hand weeded on July 23. In 2008, late soybeans in the OAM treatment were hand weeded on July 22 and 29. All soybeans in the OAM treatment were hand weeded on August 4 or 12. The CR treatment was hand weeded on August 12.
Table 5. Typical field operations and rates for wheat in three long-term cropping systems at the UNL ARDC near Mead, Nebraska in 2006–2007 and 2007–2008 seasons. DIR, diversified conventional; OAM, organic animal manure based; OGM, organic green manure based.
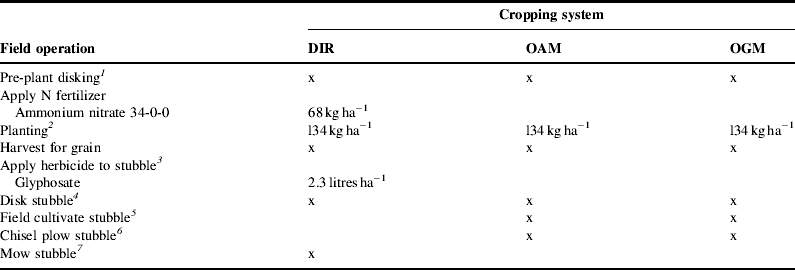
1 In 2006, pre-plant disking occurred on October 17 and 23 in all treatments. In 2007, pre-plant disking occurred on October 4 in the OAM treatment and on November 1 in the OGM treatment.
2 In 2006, winter wheat was planted on October 23 in the OGM treatment and on October 25 in the DIR and OAM treatments. In 2007, wheat was planted on October 4 in the DIR and OAM treatments and on November 1 in the OGM treatment.
3 Herbicide was applied to wheat stubble in the DIR treatment on July 12, 2007.
4 In 2006, wheat stubble was disked once on July 24 and twice more on August 31 in the OAM and OGM treatments. The DIR treatment was disked once on August 31. In 2007, wheat stubble was disked on July 17 and August 1 in the OAM and OGM treatments and once more on September 6 in the OAM treatment. The DIR wheat stubble was disked twice on September 6.
5 Wheat stubble was field cultivated once in the OAM treatment and twice in the OGM treatment on September 7, 2006 and August 15, 2007.
6 Wheat stubble was chisel plowed on July 24, 2006 in the OAM and OGM treatments.
7 Wheat stubble was mowed on August 29, 2006 in the DIR treatment.
Weed community sampling
The above-ground weed sampling was coupled with weed seedbank analysis to quantify the differences among treatments in grass and broadleaf weed pressure and weed species diversity. Two methods were used to measure the weed seedbank: elutriation of soil seedbank samples and weed emergence from soil samples placed in greenhouse conditions. Weed seedbanks were sampled in late fall (post-harvest) following the 2007- and 2008-cropping seasons. Twelve 3.18-cm diameter cores were taken from each split-plot to a depth of 20 cm in 2007 (JMC Large Diameter Sampling Tube, JMC Soil Samplers, Newton, Iowa, USA). In 2008, cores were taken to a depth of 10 cm. Soil cores were taken from each split-plot in an ‘X-pattern’Reference Colbach, Dessaint and Forcella37. In 2007, each core was split into two sections (0–10 cm and 10–20 cm depths) and the samples were pooled by split-plot and depth. The 0–10 cm depth represented the tillage layer (the maximum depth of tillage operations in the CR, DIR and OAM treatments) and the 10–20 cm depth represented the plow layer (the additional depth of tillage operations in the OGM treatment).
The samples were homogenized, dried, and a sub-sample weighing 200 g was elutriated and the remaining seeds were sorted and counted. To select a sub-sample, soil was passed through a sieve with 12.5 mm openings. Soil aggregates too large to pass through the screen were gently broken with a mortar and pestle. Soil was then poured through a funnel over a pie-chart grid. Soil particles and seeds fell randomly onto the grid and a wedge-shaped area of the pie chart was selected; the width of the wedge increased until 200 g of soil were obtained. Seeds were separated from soil by water using an elutriator based on designs outlined by Wiles et al.Reference Wiles, Barlin, Schweizer, Duke and Whitt38. One sub-sample was placed in a 100 mesh strainer screen measuring 6.0 cm in diameter, 17.5 cm in length, capped (Tube Cap No. 372, Niagara Plastics, Erie, Pennsylvania, USA) then washed in the elutriator for 2 h. The material remaining in the strainer screen was drained on a coffee filter, allowed to dry on a greenhouse bench then stored in a coin envelope. Envelope contents were later poured onto a plate marked with a grid upon which weed seeds were selected, identified and counted. Seeds of the Amaranthus genus were pooled with Chenopodium album seeds, due to the difficulty of identifying similar small-seeded weed species.
In 2008, an additional 800 g sub-sample of soil was spread in a 25.4×25.4 cm greenhouse flat to evaluate weed seedbank community diversity using the greenhouse emergence methodReference Teasdale, Mangum, Radhakrishnan and Cavigelli30. The greenhouse temperature was maintained between 18 and 30°C and the samples were exposed to natural daylight hours from January–March. The samples were evenly spread over a 3 cm layer of sterile greenhouse potting soil and watered once every 48 h with a heavy mist. Seedlings were identified, counted and removed from the flats as they emerged. After 6 weeks of emergence, the samples were dried and exposed to an average outdoor temperature of −2°C for 1 week to break the seed dormancy of weed species. The samples were then placed back in the greenhouse and monitored for an additional 5 weeks before termination. The greenhouse emergence method measures the viable non-dormant weed seedbank, while the elutriation method measures the total weed seedbank.
The above-ground weed biomass (2007 and 2008) and broadleaf weed species diversity (2008) were sampled at physiological maturity of the crop in each treatment (early July in the wheat phase and mid-September in the corn, sorghum and soybean phases). These samples were not taken in the alfalfa phases of the OGM treatment. The above-ground weed biomass and weed species diversity were obtained by clipping all weeds at the soil surface in three randomly selected 1.16 m2 quadrats (0.76 m×1.52 m) per split-plot. Clipped plants were counted by weed species (2008), divided into grass and broadleaf weed species, then dried at 50°C to constant mass and weighed.
Data analysis
The following equation was used to determine weed seedbank density; D=(N∗1.16∗10∗10,000)/200, where D is the weed seedbank density m−2 of a given soil depth, N is the number of individuals in a given sample, 1.16 is the average soil bulk density of the experimental site (g cm−3), 10 is the depth of the soil sample (cm), 10,000=cm3 m−3 and 200 is the mass of each subsample (g).
Using the weed seedbank data and the above-ground weed species density, we calculated the indices of weed species diversity, evenness and richness for each split-plot. Diversity (H′) was calculated using the Shannon diversity index; H′=−∑ Pi(Ln Pi), where Pi=Ni/N total, where Ni is the number of individuals of species i (plants m−2) and N total is the total number of individuals (plants m−2). Evenness (J) was then calculated as J=H′/Ln (S), where S is the species richness calculated as the total number of species per plotReference Sosnoskie, Herms and Cardina39.
Estimates of H′, J and S for the weed seedbank, along with weed seedbank density of grass and broadleaf weed species were then compared among management treatments using PROC MIXED (SAS Version 9.1, SAS Institute, Cary, North Carolina, USA). Fixed effects in the model included current crop, management treatment (e.g., OAM), crop sequence, year, block and year×management treatment (to determine if the data could be pooled across years). Crop sequence and the current crop were then pooled by common management treatment (e.g., OAM sequence 1 and OAM sequence 2 for all current crops combined into OAM) for comparison among management treatments using orthogonal contrasts. Current crop and rotation sequences were pooled by management treatment in the model for weed seedbank analyses, because many weed seeds persist in the soil for more than a yearReference Cavers18, Reference Thompson, Bakker and Bekker19. Thus, the long-term management and crop rotation were more likely to explain the variability of the weed seedbank. The tillage layer (2007 and 2008) and the plow layer (2007) were both analyzed for differences in weed seedbank density among management treatments, but for weed seedbank diversity only the tillage layer was analyzed, as seeds in this layer were more likely to emerge.
PROC MIXED also was used to analyze the above-ground grass and broadleaf weed biomass within each crop (excluding alfalfa) of the four management treatments. The standing weed community is often influenced by current crop and management systemReference Liebman and Davis40; thus, the current crop and management treatment were both included in the model along with year, block and year×management treatment. Rotation sequences were pooled by common management treatment within crops (e.g., OAM sequence 1 pooled with OAM sequence 2) for comparison among management treatments using orthogonal contrasts. A significance level of α=0.05 was chosen to indicate the statistical difference in all analyses.
Results and Discussion
Weed species diversity
The Shannon index for diversity (H′) of the weed seedbank ranged from 0.37 to 1.12, depending on the management treatment and year (Fig. 1a, d), when using the weed seedbank elutriation method. Weed seedbank diversity was generally greater in 2008 than 2007, and greatest in the OGM treatment in both years. In 2007, the diversity did not differ between the CR and OAM treatments or between the DIR and OAM treatments, but the diversity was greater in the DIR treatment compared to the CR treatment. In 2008, the diversity in the OGM treatment was greater than the diversity in the OAM and DIR treatments, but not the CR treatment (P=0.064). The diversity did not differ between the CR, DIR or OAM treatments. When the organic treatments (OAM and OGM) were contrasted with the conventional treatments (CR and DIR), the diversity was greater in the organic treatments in 2007 and 2008.

Figure 1. Weed seedbank (a, d) diversity, (b, e) evenness and (c, f) richness in 2007 (a–c) and 2008 (d–f) based on the Shannon diversity index from the 0 to 10 cm soil depth in CR, DIR, OAM and OGM treatments. Data collected using the seedbank elutriation method. Bars represent the standard error of the mean. Letters above the bars represent differences between treatments (P<0.05).
The evenness (J) of weed species within the seedbank ranged from 0.31 to 0.61, depending on the management treatment and year (Fig. 1b, e). As with diversity, the evenness was generally greater in 2008 than 2007 and greatest in the OGM treatment in 2007. Evenness was not different between the CR and DIR treatments or between the CR and OAM treatments, but was greater in the DIR treatment compared to the OAM treatment in 2007. In 2008, the evenness of the weed seedbank was not different among the OGM, OAM and CR treatments, but was greater in the OGM treatment compared to the DIR treatment.
Richness (S) within the weed seedbank ranged from 2 to 6 weed species, depending on the management treatment and year (Fig. 1c, f). In 2007, the weed seedbank richness was greatest in the OGM treatment, followed by the OAM treatment, the DIR treatment and the CR treatment. In 2008, the weed seedbank richness was again greatest in the OGM treatment, but was not different among the remaining treatments. Weed species richness in the seedbank was greater in 2008 than 2007.
The greenhouse emergence method was only utilized in 2008 and resulted in greater estimates of the weed species diversity relative to the seedbank elutriation method (1.07–1.38 compared to 0.84–1.12), because the seedbank elutriation method may exclude small-seeded weed species, due to the size of sieves used in the elutriation process. The sample size used in the greenhouse method was also larger (800 g of soil compared to 200 g elutriated). Thus, the probability of collecting a low-density weed species is greater in the greenhouse emergence method. Moreover, the Amaranthus spp. were not pooled with the C. album individuals in the greenhouse emergence method as they were in the elutriation method. Despite the benefits of the greenhouse emergence method, the elutriation method is necessary to account for dormant seeds.
Weed seedbank diversity (H′) was greatest in the OAM and OGM treatments in 2008. The diversity did not differ between the CR and DIR treatments (Fig. 2a). Weed seedbank evenness (J) did not differ among any treatments (Fig. 2b), whereas weed seedbank richness (S) was greatest in the OGM treatment, followed by the OAM treatment, and richness did not differ between the conventional treatments (Fig. 2c).

Figure 2. Weed seedbank (a) diversity, (b) evenness and (c) richness based on the Shannon diversity index from the 0 to 10 cm soil depth in CR, DIR, OAM and OGM treatments in 2008. Data collected using the greenhouse emergence method. Bars represent the standard error of the mean. Letters above the bars represent differences between treatments (P<0.05).
The above-ground broadleaf weed diversity was only measured in 2008 and was lower than the weed seedbank species diversity, ranging from 0.34 to 0.78. The above-ground broadleaf weed diversity (H′) was greatest in the OGM treatment in 2008, but the diversity did not differ among the remaining treatments (Fig. 3a). Weed species evenness (J) did not differ between the OGM and CR treatments, but evenness was greater in the OGM treatment compared to the DIR and OAM treatments (Fig. 3b). Weed species richness (S) of the OGM treatment was greater than the CR and DIR treatments, but not the OAM treatment. Richness of the OAM treatment was greater than the CR treatment, but not the DIR treatment. There was no difference in the weed species richness between the conventional treatments (Fig. 3c).

Figure 3. Above-ground broadleaf weed species (a) diversity, (b) evenness and (c) richness based on the Shannon diversity index in CR, DIR, OAM and OGM treatments in 2008. Bars represent the standard error of the mean. Letters above the bars represent differences between treatments (P<0.05).
Across all sampling methods, weed species diversity was generally greatest in the OGM treatment. Weed seedbank diversity was greatest in the OGM treatment in 2007 using the elutriation method and in 2008 when measuring the above-ground broadleaf diversity. The OGM treatment shared the greatest diversity with the CR treatment using the seedbank elutriation method and the OAM treatment using the greenhouse emergence method in 2008. The greater diversity observed in the OGM treatment may be the result of several factors. Similar to the DIR treatment, the crop rotation in the OGM treatment contains a diverse selection of crop species. While the DIR treatment contains the most crop species (four), the OGM treatment contains one summer annual, one winter annual and one perennial crop, resulting in the greatest phenological diversity. However, there appeared to be other factors driving weed diversity across treatments.
Due to the greater level of crop richness and diversity of crop phenology present in the DIR treatment compared with the CR treatment, we expected greater levels of weed diversity (H′) in the DIR treatmentReference Palmer and Maurer10, Reference Liebman and Dyck26. We observed this in 2007; weed seedbank diversity using the elutriation method was greater in the DIR treatment compared to the CR treatment. The diversity did not differ between the two conventional treatments using any method in 2008. While weed diversity was greater in the DIR treatment in 2007, the inconsistent relationship between crop diversity and weed diversity across years suggests that the use of herbicide inhibits any weed diversity that may have been favored by increased crop diversity. An increasing diversity of crop species has been shown to promote a greater diversity of weed speciesReference Palmer and Maurer10, but there appear to be other factors contributing to the varying levels of diversity in this study.
The diversity of management practices in a cropping system may contribute to the diversity of the weed community. During the corn, sorghum and wheat phases of the OGM treatment, management was similar to management of the OAM treatment, consisting of mechanical field cultivations and rotary hoeing during the corn or sorghum phase and no mechanical weed control during the wheat phase. The inclusion of perennial forage in the OGM treatment required an entirely different management scheme. For 2 years of the 4-year cycle, mechanical cultivation and rotary hoeing were no longer required and weeds were managed as a result of the hay cuttings that occurred three or four times through the growing season. Furthermore, at the conclusion of the 2-year alfalfa stage, the treatment was moldboard plowed to destroy the forage crop. These two additional management measures increased the diversity of management within the OGM treatment, which may have contributed to the increased levels of weed species diversity.
Cutting alfalfa three or four times per growing season shifted the competitive advantage to grass weed species in the OGM treatment. The grass weed species can withstand multiple cuttings (unlike many broadleaf weed species) and the lower crop canopy following a cutting allows light to reach many grass weed speciesReference Clay and Aguilar28–Reference Teasdale, Mangum, Radhakrishnan and Cavigelli30. Furthermore, it is unlikely that many dominant summer annual broadleaf weed species (e.g., pigweed) were able to produce seed due to the multiple cuttings. The competitive advantage of a group of weed species is unlikely to shift in the OAM, DIR and CR treatments, because the weed management tactics are relatively static within a given treatment throughout the 4-year cycle (with the exception of wheat and soybeans planted to 0.25 m rows, which eliminated mechanical cultivation as a management option). This was evident while observing the population density of Amaranthus/Chenopodium spp. in the OAM treatment. The density of these two broadleaf weed species in the OAM weed seedbank greatly exceeded that of all other treatments (data not shown), likely due to a lack of diverse crop phenology and management practices in the rotation, which allows competitive weed species to dominate the weed community. The increased density of Amaranthus/Chenopodium spp. was also due to the dense population of these seeds found in the animal manure source (data not shown). Seeds of both weed species are very small with a hard seed coat, allowing many seeds to remain viable even after passing through the animal's digestive systemReference Mt. Pleasant and Schlather41. The introduction of these weed species through the application of bovine manure in the OAM treatment lowered the species evenness of the weed community and thus the overall weed species diversity.
Previous studies have shown that weed species evenness (J) is greater in monoculture systems coupled with the intensive use of herbicides compared to diverse rotations coupled with low inputsReference Squire, Rodger and Wright23–Reference Legere, Stevenson and Benoit25. These results were not observed in our study, as there was no consistent difference among treatments, and when there was a difference, the OGM treatment exhibited the greatest levels of weed species evenness. As previously discussed, the diversity of management schemes required when perennial forage was included in the rotation likely reduced the dominance of many summer annual broadleaf weed species in the weed community. The management of those dominant broadleaf weed species led to greater levels of evenness, thus greater weed species diversity.
Weed seedbank richness (S) was also greatest in the OGM treatment, followed by the OAM and conventional treatments. These results are consistent with previous studies, in that the use of herbicides may eliminate small populations of susceptible weed speciesReference Hume42 resulting in relatively greater weed species richness in low-input cropping systemsReference Legere, Stevenson and Benoit25. The greater level of weed species richness in the OGM treatment relative to the OAM treatment may be due to the niche that perennial forage in the rotation provides to weed species adapted to multiple cuttingsReference Clay and Aguilar28–Reference Teasdale, Mangum, Radhakrishnan and Cavigelli30.
Weed seedbank composition
In 2007, the density of broadleaf weed species in the tillage layer of the CR, DIR, OAM and OGM treatments was dominated by Amaranthus/Chenopodium spp. seeds (87, 93, 93 and 86%, respectively). The broadleaf weed seedbank density was greatest in the OAM treatment (89,073 seeds m−2), followed by the OGM treatment (57,381 seeds m−2) and was not different within the DIR (22,336 seeds m−2) and CR (14,658 seeds m−2) treatments. The Amaranthus/Chenopodium spp. seeds also dominated the broadleaf weed seedbank in the plow layer of the CR, DIR, OAM and OGM treatments (92, 97, 94 and 89%, respectively). However, in the plow layer the broadleaf weed seedbank density was greatest in the OGM treatment (52,512 seeds m−2) followed by the OAM treatment (24,675 seeds m−2) and was not different within the DIR (17,395 seeds m−2) and CR (9902 seeds m−2) treatments.
Dominant grass weed species in the tillage layer included Setaria and Digitaria spp. The grass weed species seedbank density in the tillage layer was greatest in the OGM treatment (26,978 seeds m−2), while grass weed species seedbank densities did not differ among the OAM (4769 seeds m−2), CR (2799 seeds m−2) and DIR (2224 seeds m−2) treatments in 2007. Similar to the tillage layer, grass weed species seedbank densities in the plow layer were greatest in the OGM treatment (15,817 seeds m−2) and did not differ among the OAM (1753 seeds m−2), DIR (745 seeds m−2) and CR (263 seeds m−2) treatments.
Weed seedbank density was only measured in the tillage layer (0–10 cm) in 2008. Similar to 2007, Amaranthus/Chenopodium spp. dominated the broadleaf weed species community in the tillage layer of the weed seedbank in the CR, DIR, OAM and OGM treatments (86, 87, 85 and 73%, respectively). The broadleaf weed species seedbank density was greatest in the OAM (41,415 seeds m−2) and OGM (37,567 seeds m−2) treatments and did not differ between the DIR (19,281 seeds m−2) and CR (12,007 seeds m−2) treatments. Also similar to 2007, the grass weed species seedbank community was dominated by Setaria and Digitaria spp. Grass weed species seedbank density was greatest in the OAM treatment (14,345 seeds m−2), followed by the OGM treatment (10,699 seeds m−2) and did not differ between the DIR (3941 seeds m−2) and CR (3094 seeds m−2) treatments. Total weed seedbank density was greater in 2007 than in 2008. Determining weed seedbank density using the elutriation method is useful for viable dormant seeds, but total densities may be inflated due to the inclusion of some non-viable weed seeds.
Overall, the broadleaf weed species seedbank density in the tillage layer was greatest in the OAM treatment and lowest in the two conventional treatments in both years. The density of the broadleaf weed species in the OAM treatment was greater than that of the OGM treatment in 2007. The greater density observed in the OAM treatment relative to the OGM treatment was expected. Several studies have shown that the inclusion of a perennial forage crop in a rotation can reduce broadleaf weed populations in low-input or organic systemsReference Clay and Aguilar28, Reference Kegode, Forcella and Clay43–Reference Porter, Huggins, Perillo, Quiring and Crookston45. Perennial forage crops in rotation can suppress weeds through competitionReference Risser46, mowingReference Norris and Ayres47, light extinction, changes in the soil thermal regimeReference Teasdale and Daughtry48 and reduced levels of weed seed germination due to the lack of tillageReference Roberts and Feast49. Each of these factors may have contributed to the reduction of the broadleaf weed species seedbank density in the OGM treatment relative to the OAM treatment.
Another possible contribution to the density of the broadleaf weed species seeds in the tillage layer of the OAM treatment was the application of non-composted bovine manure every other year. Once in the seedbank, these broadleaf weed species may experience a competitive advantage in the nutrient-rich environment created in the OAM treatment. Compost applications have been shown to enhance the growth and competitive ability of common waterhempReference Menalled, Liebman and Buhler32. Amaranthus/Chenopodium spp. are able to compensate for their initial size disadvantage through rapid growth and nutrient uptake, because the plant relative growth rate is negatively correlated with seed sizeReference Seibert and Pearce50 and nutrient enrichment consistently selects for fast-growing species that outcompete slower-growing, stress tolerant speciesReference Tilman51–Reference Wedin and Tilman53. Despite the increase in broadleaf seedbank density, animal manure application in the OAM treatment consistently increased the yields of corn, sorghum and winter wheat relative to the OGM treatmentReference Wortman54.
Weed seedbank density and distribution are mainly influenced by tillage system and weed managementReference Barberi and Lo Cascio21. In this experiment, in 2007, the broadleaf weed species seedbank abundance in the plow layer (10–20 cm depth) was greatest in the OGM treatment, followed by the OAM treatment. This difference was likely due to the moldboard plow utilized to terminate the alfalfa stand every fourth year in the OGM treatment. The broadleaf weed species' seeds that may have accumulated in the tillage layer were likely inverted into the plow layerReference Ball55.
In 2007, the grass weed seedbank density of the tillage and plow layer was greatest in the OGM treatment, which was expected due to the competitive advantage gained by the grass weed species in the perennial forage phase of the rotationReference Clay and Aguilar28–Reference Teasdale, Mangum, Radhakrishnan and Cavigelli30. However, in 2008, the density of grass weed species was greatest in the OAM treatment. The lack of herbicide management and timely cultivations in 2008, along with the nutrient-rich soil environment may have contributed to the greater grass density in the OAM treatmentReference Moreby and Southway8, Reference Tilman51–Reference Wedin and Tilman53. The spring months of 2008 were unusually wet, which restricted timely cultivation in the organic rotations. As a result, grass weed species populations (e.g., Setaria spp.) became troublesome in OAM soybeans. Reduced organic weed control in unusually wet years has been demonstrated in previous studiesReference Porter, Huggins, Perillo, Quiring and Crookston45, Reference Posner, Baldock and Hedtcke56. Our results suggest that weed community shifts are driven by a combination of environmental and management factors.
Above-ground weed biomass
The broadleaf weed biomass was greater in the OAM corn treatment (923 kg ha−1) than in the CR and DIR corn treatments (42 and 254 kg ha−1, respectively) in 2007 and 2008 (Fig. 4). The broadleaf weed biomass in the OGM corn treatment (613 kg ha−1) was not different from any other treatment. However, when the organic treatments were contrasted with the conventional treatments, the broadleaf weed biomass was greater in the organic treatments. In soybean, the broadleaf weed biomass in the OAM treatment (309 kg ha−1) was greater than the biomass in the CR and DIR treatments (59 and 15 kg ha−1, respectively). There were no differences in the broadleaf weed biomass among any treatments in sorghum or wheat (Fig. 4). The broadleaf weed biomass in sorghum for the CR, DIR, OAM and OGM treatments was 175, 123, 225, and 250 kg ha−1, respectively. Similarly, the broadleaf weed biomass in wheat for the DIR, OAM and OGM treatments was 188, 108, and 167 kg ha−1, respectively. These results may suggest that sorghum and wheat are more competitive with summer annual broadleaf weeds, making these crops more competitive options in organic cropping systems with greater weed pressure. The phenology (winter annual), dense plant spacing and tillering capacity of wheat may prevent the germination and growth of many dominant summer annual weeds. Both sorghum and wheat have demonstrated allelopathic effects on weeds, but one would expect this to impact weed populations in the subsequent cropReference Hoffman, Weston, Snyder and Regnier57, Reference Ma58. There were no differences in the broadleaf weed biomass within the organic rotations. This was somewhat unexpected, due to the high broadleaf weed seedbank density observed in the OAM treatment across both years. While including perennial forage in the rotation may aid in the reduction of the broadleaf weed seedbank, in this study, the above-ground weed biomass was unaffected.

Figure 4. Above-ground dry broadleaf weed biomass in corn, sorghum, soybean and wheat among CR, DIR, OAM and OGM treatments for both 2007 and 2008. Bars represent the standard error of the mean. Different letters above the bars represent differences between treatments (P<0.05). An ‘N/A’ above a treatment indicates that the crop is not included in the treatment.
The grass weed biomass in corn was greatest in the OGM treatment (3102 kg ha−1; Fig. 5). The grass weed biomass in the OAM treatment (1565 kg ha−1) was greater than the biomass in the DIR treatment (37 kg ha−1) but not the CR treatment (22 kg ha−1). In sorghum, the grass biomass was greatest in the OGM treatment (3737 kg ha−1) followed by the OAM, DIR and CR treatments (2335, 110 and 13 kg ha−1, respectively). In soybean, the grass weed biomass was greatest in the OAM treatment (1715 kg ha−1) and did not differ between the CR and DIR treatments (34 and 0 kg ha−1, respectively). In wheat, the grass weed biomass was greatest in the OGM treatment (562 kg ha−1) and did not differ between the DIR and OAM treatments (28 and 84 kg ha−1, respectively; Fig. 5). These results were expected due to the lack of herbicide management in the organic treatments and the greater grass weed seed production during the alfalfa stage of the OGM rotationReference Clay and Aguilar28–Reference Teasdale, Mangum, Radhakrishnan and Cavigelli30. Given the high grass weed seedbank density observed in the OGM treatment combined with a lack of timely mechanical weed control, due to early season rain events, the exceptionally high grass weed biomass in the OGM treatment was not unexpected. These results emphasize the importance of minimizing the seedbank density to reduce the above-ground weed biomass in subsequent years.

Figure 5. Above-ground dry grass weed biomass in corn, sorghum, soybean and wheat among CR, DIR, OAM and OGM treatments for both 2007 and 2008. Bars represent the standard error of the mean. Different letters above the bars represent differences between treatments (P<0.05). An ‘N/A’ above a treatment indicates that the crop is not included in the treatment.
Conclusions
The results of this study demonstrate that the inclusion of perennial forage such as alfalfa in organic cropping systems may contribute to the increase of weed biodiversity. Moreover, organic cropping systems that rely heavily on animal manure applications for soil fertility will decrease weed biodiversity. The potential for the addition of weed seed and the nutrient-rich environment created by the frequent bovine manure applications may shift the competitive advantage in the agroecosystem to a few dominant summer annual weeds. This dominance was evident in the abundant weed seedbank populations of broadleaf weeds such as Amaranthus/Chenopodium spp. in the OAM treatment. It is important to manage the abundant weed seedbank populations of grass weed species that may accumulate during the perennial forage stage of the rotation by improving the timing of alfalfa cuttings and increasing the population density and uniformity of the alfalfa stand to prevent grass weed seed shatter. The density of the weed seedbank influences the effectiveness of weed control, especially in organic systems, so it is important to prevent the accumulation of the weed seedbankReference Zasada, Linker and Coble59, Reference Buhler60.
Organic weed management is heavily reliant on mechanical cultivation, which is often limited by the weather in a given growing season. If the weather conditions permit the timely use of mechanical cultivation, the above-ground weed biomass can be managed at acceptable economic thresholds and organic crop yields are often comparable to conventional crop yieldsReference Porter, Huggins, Perillo, Quiring and Crookston45, Reference Posner, Baldock and Hedtcke56. The high weed seedbank populations observed in this study also demonstrate the importance of timely weed management in organic crop rotations. Special attention should be given to additional management tactics for reducing weed seedbank density so as to increase the effectiveness of timely mechanical cultivations in organic cropping systems. An ecological approach consisting of multiple physical, biological and cultural tactics is likely the most effective method for reducing weed seedbank density on organic farmsReference Bond and Grundy61. This approach employs a diverse range of weed management tactics (e.g., crop rotation, cover cropping, inter-cropping, soil amendments, rotary hoeing, flaming, etc.) that individually are weak, but together are strongReference Liebman, Davis and Francis62. This ecological approach to weed management was described by Liebman and GallandtReference Liebman, Gallandt and Jackson63 as the ‘many little hammers’ approach where the cumulative effect of many ‘little hammers’ will approach the effectiveness of a ‘big hammer’ (e.g., synthetic herbicides)Reference Liebman, Gallandt and Jackson63. Moreover, an ecological approach to weed management may select for a more diverse weed community (of those weeds that remain). In this study, increasing the diversity of management operations in the OGM rotation seemed to contribute to greater levels of weed diversity.
While the OGM rotation increased crop and weed diversity and minimized broadleaf weed populations compared to the OAM rotation, grain yield loss was incurred primarily due to deficiencies in soil fertilityReference Wortman54. Between 1996 and 2007, all grain yield differences among the conventional treatments (CR and DIR combined) and the OAM and OGM treatments were significant (α=0.05). Relative to the conventional treatments, the yield in the OAM and OGM treatments was reduced by 13 and 33% in corn, 16 and 27% in sorghum, respectively, and in wheat OAM yield increased by 9% while OGM yield was reduced by 15%Reference Wortman54. Thus, a combination of management practices from the OAM and OGM treatments may be most appropriate for maximizing the yield and biodiversity, while minimizing weed density and the above-ground biomass.
The conservation of biodiversity is often seen as a moral, aesthetic, social or economic issue, but there is increasing evidence that the biodiversity of weed communities in agroecosystems provides several valuable ecological functionsReference Marshall, Brown, Boatman, Lutman, Squire and Ward64. Maintenance of a diverse weed community is one step toward optimizing the sustainability of agroecosystemsReference Swift, Anderson, Schulze and Mooney65 through improved nutrient cycling and pest controlReference Altieri2, improved soil chemical and physical propertiesReference El Titi, Glen, Greaves and Anderson1 and the reduction of soil erosionReference Zimdahl3. Furthermore, managing weed species diversity will promote the overall diversity of other trophic levels in the agroecosystem, including insects, birds and larger animalsReference Marshall, Brown, Boatman, Lutman, Squire and Ward64, Reference Mader, Fliebbbach, Dubois, Gunst, Fried and Niggli66. These potential benefits were not directly measured in this study, nor can we determine the level of plant diversity necessary to achieve these benefits. While the increases in weed diversity and weed species richness observed in this study are modest, they are significant. Further studies should be conducted to determine whether the gains in weed species diversity observed in organic cropping systems are sufficient to realize ecosystem services.
Previously, the task of preserving biodiversity had been left to unmanaged natural ecosystems, but unmanaged ecosystems are disappearing from the landscapeReference Marshall, Brown, Boatman, Lutman, Squire and Ward64. As this happens, agroecosystems may emerge as a practical alternative ecosystem for the conservation of biodiversityReference Mineau and McLaughlin67. Future studies in agroecosystem diversity should be directed toward developing organic cropping systems that maximize diversity while minimizing weed seedbank density and the above-ground biomass.
Acknowledgements
The authors acknowledge Tomie Galusha and Lee Klossner for assistance in conducting the field experiment and processing weed seedbank elutriation samples. This project was funded in part through North Central Region Sustainable Agriculture Research and Education (NCR-SARE), a USDA supported program.


