Neurological injury occurs during surgical repair in 30–70% of children with CHD.Reference McKenzie, Andropoulos, DiBardino and Fraser 1 – Reference Sarajuuri, Jokinen and Puosi 3 Sensitive MRI is often required to delineate these otherwise clinically silent lesions. McQuillen et al prospectively compared preoperative and postoperative MRIs in 53 newborns with CHD, showing that 36% had new brain damage. Characteristics of this injury included focal strokes and ischaemic lesions in both superficial and deep white matter. Factors associated with postoperative brain injury included flow rates during cardiopulmonary bypass, intraoperative acidosis, and postoperative hypotension.Reference McQuillen, Barkovich and Hamrick 4 In a single centre study of neonates undergoing cardiopulmonary bypass, Andropoulos et al found that 36% of infants had new white matter injury, infarction, or haemorrhage, with brain immaturity and low systolic blood pressure identified as risk factors for developing white matter injury on preoperative and postoperative MRIs.Reference Andropoulos, Ahmad and Haq 5
Clinical findings suggest “silent” neurological injuries as patients with complex CHDReference Kaltman, Andropoulos and Checchia 6 possess high rates of neurocognitive deficits and behavioural problems compared with those without CHD. Notably, 50% of the survivors of CHD surgery in one study required some form of academic remediation, and ~33% had symptoms of attention deficit and hyperactivity.Reference Hogue, Palin and Arrowsmith 7 – Reference Hovels-Gurich, Konrad, Skorzenski, Herpertz-Dahlmann, Messmer and Seghaye 13 Although the aetiology of these deficits is unclear, the major mechanism of brain injury during cardiac surgery for older children and adults results primarily from cerebral embolism and/or reduced cerebral blood flow.Reference Selim 11 Perioperative neurological deficits, both transient and permanent, can result from cerebral hypoperfusion during bypass, particularly when patients have cerebral vascular disease.Reference Ferguson, Hammill, Peterson, DeLong and Grover 14 – Reference Moraca, Lin and Holmes 17 The implications in our youngest patients and in those with immaturity of cerebral and vascular development may result in unique perioperative vulnerabilities.Reference Rhee, Kibler and Easley 18 Despite the acknowledged risk for and potential relationship of acute and long-term neurological deficits with perioperative blood pressure management, we lack the diagnostic means to detect brain injury during surgery, to evaluate new therapies for reducing brain injury, and to preserve long-term cognitive outcomes; therefore, preventing neurological injury is the modern challenge for the paediatric heart surgery team.Reference McKenzie, Andropoulos, DiBardino and Fraser 1 , Reference Lee, Easley and Brady 19
One method of detecting potential periods of brain hypoperfusion is cerebrovascular autoregulation monitoring. Autoregulation of cerebral blood flow is mediated by changes in the diameter of cerebral resistance vessels. Although cerebral blood flow autoregulation monitoring assesses the relationship between slow fluctuations in cerebral blood flow and perfusion pressure, cerebral vascular reactivity can be assessed by quantifying the correlation between changes in cerebral blood volume and perfusion pressure.Reference Czosnyka, Brady, Reinhard, Smielewski and Steiner 20 , Reference Czosnyka, Smielewski, Kirkpatrick, Laing, Menon and Pickard 21 The most common method for monitoring cerebrovascular reactivity is the pressure reactivity index that uses intracranial pressure as a surrogate for cerebral blood volume.Reference Czosnyka, Brady, Reinhard, Smielewski and Steiner 20 , Reference Czosnyka, Smielewski, Kirkpatrick, Laing, Menon and Pickard 21 Low-frequency changes in intracranial pressure are assumed to indicate cerebral blood volume changes resulting from the collective increase in the size of arterial resistance vessels. A positive pressure reactivity index indicating a direct correlation between intra-cranial pressure and perfusion pressure is associated with both mortality and poor neurological recovery from traumatic brain injuryReference Czosnyka, Brady, Reinhard, Smielewski and Steiner 20 , Reference Czosnyka, Smielewski, Kirkpatrick, Laing, Menon and Pickard 21 ; however, assessing the pressure reactivity index requires invasive intra-cranial pressure monitoring, which limits its application in many clinical areas, including bypass.
Alternatively, near-infrared spectroscopy measurements use non-invasive technology to compare different absorption spectra of oxyhaemoglobin and deoxyhaemoglobin in relation to relative total haemoglobin. The relative total haemoglobin is obtained by measuring light absorption at the isosbestic (805 nm) wavelength and is a function of the haematocrit and the blood volume in the tissue. Similar to intra-cranial pressure, changes in cerebral relative total haemoglobin may serve as a surrogate of cerebral blood volume as changes in relative total haemoglobin reflect the collective changes in the size of cerebral resistance vessels. In both experimental and traumatic brain injury studies, a continuous correlation between relative total haemoglobin and cerebral perfusion pressure – termed haemoglobin volume index – was accurate for detecting the lower limit of autoregulation and functioned like the pressure reactivity index.Reference Lee, Kibler and Benni 22 , Reference Zweifel, Castellani and Czosnyka 23
In this pilot observational study, we have sought to correlate changes in vascular reactivity monitoring with alteration of a novel brain injury biomarker, glial fibrillary acidic protein, in children – from neonates to adolescents – with CHD and undergoing bypass.Reference Brunetti, Jennings and Easley 24 , Reference Magruder, Hibino and Collica 25 We hypothesise that impaired vascular reactivity and the magnitude of and duration for which mean arterial pressure is below the lower limit of autoregulation during bypass will result in brain injuries detectable by acute elevation in serum glial fibrillary acidic protein level.
Materials and methods
We performed a prospective, observational, multicentre study of children undergoing bypass for repair of CHD at the Texas Children’s Hospital, Johns Hopkins Hospital, and Cincinnati Children’s Hospital Medical Center. The study protocol was initiated at each study site following approval by the respective institutional review board of each study site. Because near-infrared spectroscopy monitoring is routine for paediatric cardiac surgery at these institutions, the need for written informed consent was waived. All patients received routine care, and caregivers were blinded to the measurements of cerebrovascular reactivity. All neonates, infants, and children up to 21 years of age undergoing bypass were eligible. Exclusion criteria were repair of CHD without the use of bypass – that is, coarctation of the aorta or ligation of patent ductus arteriosus – absence of near-infrared spectroscopy monitoring, and insufficient residual blood samples to document glial fibrillary acidic protein for all phases of bypass. Patients with cyanosis were defined as those with a preoperative oxygen saturation of <95% on pulse oximetry.
All patients received standard intraoperative monitoring, invasive mean arterial blood pressure monitoring, and reflectance near-infrared spectroscopy-based cerebral oximetry (INVOS and Covidien, Boulder, Colorado, United Sates of America). Non-protocolised anaesthetic management consisted of the administration of benzodiazepines, opioids, inhaled anaesthetics, and neuromuscular blocking agents at the discretion of the clinical team. Bypass was performed with a non-occlusive roller pump and priming was carried out with blood products for all patients who weighed <20 kg at the discretion of the clinical care team.
Measuring plasma glial fibrillary acidic protein
During the operating room procedure, all residual, or “waste” blood from routinely performed activated clotting time testing were timed and saved on ice for subsequent glial fibrillary acidic protein testing. Monitoring and sample times were allocated to the phases of bypass: before, cooling, rewarming, and post-bypass. At the end of bypass, each residual waste blood sample was centrifuged for 8 minutes at 3000 rpm and the plasma layer was separated. The plasma was placed into microcontainers and stored at −80°C until assayed. Assays were run in a blinded, duplicate manner, were not available to the clinical team, and had no impact on clinical decision-making. Glial fibrillary acidic protein was assayed using an electrochemiluminescent sandwich immunoassay as previously described.Reference Bembea, Savage and Strouse 26 In brief, the assay had a detection range of 0.04–40.0 ng/mL. Our glial fibrillary acidic protein assay had a lower limit of detection of 0.011 ng/mL, as defined by two standard deviations above the background of blank wells, and the signal to noise ratio was 1.17 at 0.01 ng/mL. The lower limit of quantification, defined as the lowest dilution with a calculated concentration ±20% of a known concentration, was 0.04 ng/mL; therefore, assay values <0.04 ng/mL are reported as 0. Normally individuals – neonates to adults – have an undetectable plasma glial fibrillary acidic protein level.Reference Bembea, Savage and Strouse 26 Those patients with a pre-bypass – that is, a baseline – glial fibrillary acidic protein level of >0.04 were excluded from further analysis because of potential for “occult” brain injury before initiation of vascular reactivity monitoring.
Monitoring vascular reactivity
The haemoglobin volume index was monitored and recorded using methods previously described.Reference Lee, Kibler and Benni 22 , Reference Czosnyka, Smielewski, Kirkpatrick, Menon and Pickard 27 In brief, reflectance cerebral cortical near-infrared spectroscopy-based monitoring was performed at each institution using the INVOS monitor. Arterial blood pressure (GE Marquette, Milwaukee, Wisconsin, United States of America) and INVOS monitor signals were recorded from analogue outputs using analogue to digital conversion (DT9804; Data Translation, Marlboro, Massachusetts, United States of America) sampled at 100 Hz from a bedside computer using ICM+ software (Cambridge Enterprise, Cambridge, United Kingdom). Cerebral blood volume was derived from reflectance cortical near-infrared spectroscopy using the relative total haemoglobin. This output is not a clinically available measurement on the near-infrared spectroscopy monitors, but is inversely proportional to the transmittance of light with the isosbestic wavelength of 805–810 nm, an optical density that is reported in the RS232 data stream from the INVOS monitor. This was sampled at a monitor refresh rate of 0.25 Hz. Both waveforms of arterial blood pressure and relative total haemoglobin were low-pass filtered by 10 second averaging to remove pulse and respiratory frequency waveforms. Oscillations of arterial blood pressure and relative total haemoglobin slower than 0.05 Hz were retained in the re-sampling of these filtered waves at 0.1 Hz for subsequent correlation analysis. The signals were further filtered to remove noise from arterial line blood sampling, and to remove noise in the analogue signals from cautery, by deleting arterial blood pressure changes greater than 15 mmHg in 300 seconds. A linear coefficient of correlation from the Pearson’s correlation test performed between 30 paired samples of arterial blood pressure and relative total haemoglobin yields a single haemoglobin volume index value. During dynamic monitoring, the haemoglobin volume index is refreshed every 10 seconds using the precedent of a 300 second epoch for recordings. The near-infrared-derived haemoglobin volume index value is a real-time, continuous measure of vascular reactivity that ranges from −1 to +1. When autoregulation is functional, the indices are near-zero or negative because blood pressure and cerebral blood volume are either poorly or negatively correlated – for example, increases in cerebral blood volume occur with decreases in blood pressure. When blood pressure is outside the limits of autoregulation, the index becomes increasingly more positive and approaches +1 because blood pressure and cerebral blood volume are positively correlated – for example, increases in cerebral blood volume occur with increases in blood pressure. Increasingly positive values for haemoglobin volume index indicate a pressure-passive vascular tone, suggesting impaired reactivity; and increasingly negative values of haemoglobin volume index indicate a pressure-reactive vascular tone, suggesting intact or robust reactivity. Right and left near-infrared spectroscopy data were combined for analysis unless only unilateral recordings were available. All waveform files were de-identified, except for a unique study identifier, and encrypted before transfer to Texas Children’s Hospital for analysis.
Statistical analysis
A convenience sample of 100 patients was anticipated for this observational study. Multiple study sites were included to demonstrate the feasibility of conducting these complex measurements at multiple study locations. Together, the study design was intended to provide pilot data for a larger multicentre study. Cerebrovascular reactivity was quantified by constructing an autoregulation curve for each patient by binning and averaging discrete haemoglobin volume index values according to the average arterial blood pressure (5-mmHg bins; Fig 1).Reference Brady, Joshi and Zweifel 28 Defining the individual lower limit of autoregulation in these histograms following a standardised approach requires the use of a threshold haemoglobin volume index value. Such a threshold has not been determined. On the basis of experimental data from non-bypass piglets using similar histograms of haemoglobin volume index and arterial blood pressure, we have seen that a haemoglobin volume index threshold of 0.3 was 77% sensitive and 84% specific for detecting the lower limit of autoregulation; therefore, we chose a threshold haemoglobin volume index value of 0.3 for this study as indicating the lower limit of autoregulation. The individual lower limit of autoregulation was defined for each patient by systematically reviewing individual histograms in the following manner. The mean arterial blood pressure was determined above which haemoglobin volume index values were consistently >0.3 – that is, 1 of 4 contiguous bin averages >0.3 – and below which haemoglobin volume index values were <0.3 – that is, 1 of 4 contiguous bin averages <0.3. The decision to allow 1 in 4 bins to be ignored was arbitrarily made before data analysis by two investigators independently assessing the curves. This method was an attempt to objectively demarcate blood pressure values associated with impaired autoregulation from those associated with intact autoregulation in individual patients. Figure 1 shows examples of this method applied successfully to two patients and unsuccessfully to one patient.
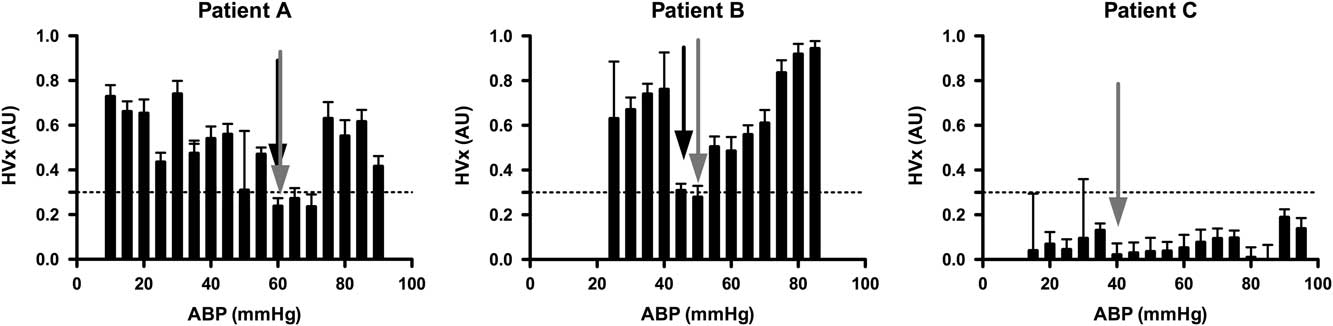
Figure 1 Examples of individual autoregulation curves for three different patients, one in each panel. In each graph, binned averages of the haemoglobin volume index (HVx) are plotted against arterial blood pressure (ABP) with their standard errors. The horizontal line at 0.3 for the HVx indicates the suspected threshold for loss of autoregulation. Patients were randomly selected to illustrate the identification of the lower limit of autoregulation (LLA) and the optimal arterial blood pressure (ABP opt) from the autoregulation curve. LLA is indicated with a black arrow and ABP opt with a grey arrow on each curve, as applicable. Patient A: A 7-month-old infant with tetralogy of fallot (TOF) undergoing complete repair. The figure demonstrates an individual’s HVx curves that meets criteria for determining both an LLA and ABP opt. On the basis of the curve, the patient maintained autoregulation to an ABP of 60 mmHg, but then lost autoregulatory function with a further drop in ABP to 55 mmHg. The lowest HVx value (ABP opt) was also at 60 mmHg. Patient B: A 2-year-old child with heterotaxy undergoing bidirectional cavopulmonary shunt. The HVx curve demonstrates both LLA at 45 mmHg and ABP opt at 50 mmHg. Patient C: 3-month-old infant with TOF undergoing complete repair. This patient’s HVx curve fails to meet criteria for demonstrating an LLA as all measurements demonstrate intact autoregulation. ABP opt was 40 mmHg.
A composite pressure autoregulation curve was constructed by summarising each patient’s haemoglobin volume index over mean arterial blood pressure histograms into an average of means for the entire cohort with equal weight assigned to individual patients. To account for within-patient correlation and inconsistently repeated measures – not every arterial blood pressure value was experienced by every patient – the effect of arterial blood pressure on haemoglobin volume index was determined using a multiple linear regression model with generalised estimating equations and robust variance estimation.Reference Moraca, Lin and Holmes 17 The “optimal” arterial blood pressure was defined as the blood pressure bin with the lowest mean haemoglobin volume index measurement as described by Zwiefel et alReference Zweifel, Castellani and Czosnyka 23 (see Fig 1).
Descriptive statistics were applied to analyse the mean and distribution between all recorded study variables including age, weight, duration of surgery, duration of cardiopulmonary bypass, circulatory arrest, and 30-day survival. Risk Adjusted Congenital Heart Surgery Score was determined for each patient using the formula published by Jenkins et alReference Jenkins, Gauvreau, Newburger, Spray, Moller and Iezzoni 29 and included in the analysis as a patient characteristic and as a marker of disease and surgical complexity. Univariate and multivariate logistic regression models were built using the method of Hosmer and LemeshowReference Hosmer and Lemeshow 30 to compare those patients with an individually estimated lower limit of autoregulation – that is, those with a lower limit of autoregulation detected – with patients for whom the method failed – that is, those with a lower limit of autoregulation not detected – as well as to children with and those without cyanosis. A two-way analysis of variance with post hoc Bonferroni testing was used to determine the significance of differences between study sites, individual lower limit of autoregulation detection, and cyanosis groups. Finally, using only the individual lower limit of autoregulation-detected group, the relationship between the individual lower limit of autoregulation and each variable of interest, namely age, lowest temperature, peak haemoglobin volume index, diagnosis, average arterial blood pressure, glial fibrillary acidic protein level, or risk-adjusted congenital heart surgery score, was modelled using linear regression.
Average arterial blood pressure, regional cerebral oximetry, glial fibrillary acidic protein level, and haemoglobin volume index are reported for the cohort by phase of bypass: before, cooling, rewarming, and after bypass. The percentage of time below lower limit of autoregulation and of change in glial fibrillary acidic protein level – baseline to peak value – was also compared along with the comparison between the highest tertile and the lowest 2/3 of glial fibrillary acidic protein level and autoregulation parameters of peak haemoglobin volume index, optimal arterial blood pressure and % time below the lower limit of autoregulation. Comparisons were made between stages of bypass using the Kruskal–Wallis analysis of variance and the Dunn multiple comparison tests. Individual lower limit of autoregulation determinations from this paediatric study were compared with the lower limit of autoregulation determinations from our previous study of a different cerebrovascular autoregulation monitoring method in children who were acyanoticReference Brady, Mytar and Lee 31 using the Mann–Whitney U test. We reported statistical significance levels at p<0.05. All statistical analysis was performed using STATA (Version 10; Stata Corp., College Station, Texas, United States of America) and Prism 5 (GraphPad Software Inc., La Jolla, California, United Sates of America).
Results
In all, 88 infants and children met enrolment criteria. A total of 31 patients were excluded based on availability of glial fibrillary acidic protein or haemoglobin volume index data for all portions of bypass: 16 for insufficient glial fibrillary acidic protein samples, nine for insufficient haemoglobin volume index data for all four phases of the bypass, and six patients with an abnormal baseline glial fibrillary acidic protein >0.04. The remaining 57 children had simultaneous haemoglobin volume index and glial fibrillary acidic protein data for all phases of bypass and formed the cohort for this analysis.
Patient characteristics and baseline study variables are summarised in Table 1. Overall, the mean age of the patients was 2.8 years (median: 7 months; interquartile range: 3.6 months to 4 years). Of the patients, 25% had single-ventricle anatomy, 21% had chromosomal anomalies, and the majority were cyanotic (71%). All patients survived to 30-days after surgery.
Table 1 Patient characteristics and baseline study parameters.

ABP opt=optimal blood pressure on HVx monitoring; CPB=cardiopulmonary bypass; DHCA=deep hypothermic circulatory arrest; F=female; GFAP=glial fibrillary acidic protein; HVx=haemoglobin volume index;LLA=lower limit of autoregulation; M=male; RACHS=risk adjustment for congenital heart surgery; SpO2=pulse oximetry.
* LLA could only be determined in 47 of 57 patients.
A summary of the haemoglobin volume index autoregulation data for this study cohort is shown in Figure 2. These results demonstrate robust autoregulation by haemoglobin volume index for arterial blood pressure >40 mmHg. Below an arterial blood pressure of 40 mmHg, haemoglobin volume index values become elevated to >0.3, suggesting impaired cerebrovascular autoregulation within this cohort during hypotension. The ability of the haemoglobin volume index to delineate autoregulation in children with cyanotic and acyanotic cardiac disease is best demonstrated in the comparison of the lower limit of autoregulation in these two groups, which can be estimated using haemoglobin volume index monitoring. There was no difference in haemoglobin volume index determined lower limit of autoregulation between patients with and those without cyanotic CHD (p=0.34, see Fig 3).
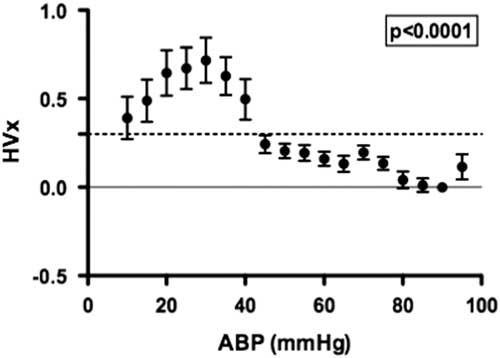
Figure 2 The distribution of the haemoglobin volume index (HVx) across binned mean arterial blood pressure (ABP) allows visualisation of the autoregulation curve in children with cyanosis (n=57). A HVx value of 0.3, indicated with a horizontal dashed line, is the LLA threshold used for this method. A significant change in HVx occurred as ABP became lower; p<0.0001 using generalised estimating equation, data are mean±SD.
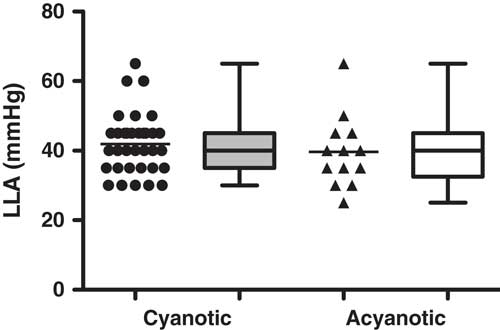
Figure 3 Individual LLA could be demonstrated in 82% (47 of 57) of children during cardiopulmonary bypass. There was no difference in LLA found between the children with cyanosis (42±9 mmHg) and those who were acyanotic (40±10 mmHg) in this study, suggesting the functionality of HVx to delineate LLA despite physiologic desaturation; p=0.3446 using Mann–Whitney U test, data are mean±SD, represented in box–whisker form with the mean, maximum, and minimum).
The mean baseline glial fibrillary acidic protein level was 0.0061 ng/mL (median: 0.001; interquartile range: 0.001–0.0039 ng/mL). During bypass, glial fibrillary acidic protein levels demonstrated significant perturbations with the highest individual and group values occurring during the rewarming phase of bypass (p<0.002 versus baseline, see Fig 4a). Though slightly lower, mean serum glial fibrillary acidic protein values remained significantly elevated into the post-bypass period from baseline values (p<0.001).
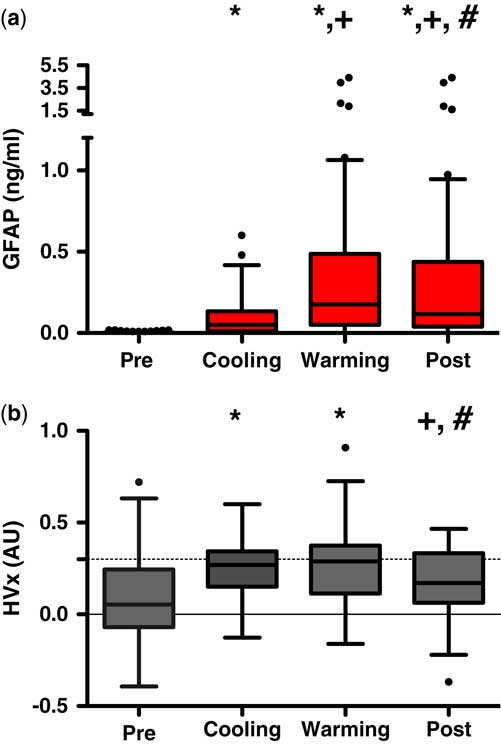
Figure 4 ( a ) Glial fibrillary acidic protein (GFAP) and ( b ) haemoglobin volume index (HVx) and relation to cardiopulmonary bypass (CPB). A significant increase in GFAP occurs during cooling and persists throughout warming and into the post-CPB phases; whereas values of HVx elevate during cooling and rewarming CPB and return to pre-CPB values in the post-CPB phase. *Significant value comparing pre- values; +significant values compared with cooling values; #significant values compared with warming values; p<0.05 using repetitive measures ANOVA with Dunnet’s post comparison.
Simultaneous recordings of cerebrovascular reactivity monitoring demonstrated a mean baseline haemoglobin volume index of 0.084 (median: 0.053; interquartile range: −0.07 to 0.25). With the initiation of bypass, haemoglobin volume index increased with lowering of arterial blood pressure and 82% of patients demonstrated a lower limit of autoregulation (median: 41 mmHg; interquartile range: 35–45 mmHg), whereas 100% demonstrated an optimal arterial blood pressure (median: 48 mmHg; interquartile range: 40–56 mmHg). Similar to the alterations in glial fibrillary acidic protein values, higher haemoglobin volume index values – suggesting more impaired autoregulation – were observed during the bypass period with peak values during rewarming (p<0.002, pre- versus rewarming, see Fig 4b). Haemoglobin volume index values were elevated during cooling (p<0.0001) and rewarming (p<0.0001) on bypass and were significantly greater than both pre- and post-bypass values. Elevation of haemoglobin volume index (values>0.3) demonstrated a specificity of 69% and sensitivity 55% for detecting glial fibrillary acidic protein associated with brain injury (values>0.4 ng/mL) with area under the receiver operator curve of 0.63 (95% confidence interval: 0.55–0.71, p value=0.0006).
There was a weak correlation between glial fibrillary acidic protein changes during bypass and peak haemoglobin volume index values (Spearman rank=0.24, p=0.07). To further explore this possible association, a tertile analysis was performed comparing the top 1/3 (n=20) – defined by high peak glial fibrillary acidic protein values >0.41 ng/mL – with the bottom 2/3 of the study cohort (n=37). Within patients with the highest glial fibrillary acidic protein values, there were significantly higher peak values of haemoglobin volume index (p=0.01) and a trend towards increasing time below the lower limit of autoregulation (p=0.07). Interestingly, there was no difference in optimal arterial blood pressure for the patients based on glial fibrillary acidic protein tertile (p=0.33) (see Table 2). This suggests that both the magnitude and duration of autoregulatory impairment related to low arterial blood pressure are associated with the highest levels of glial fibrillary acidic protein in this group, whereas arterial blood pressure aberration away from optimal arterial blood pressure that did not go below the lower limit of autoregulation were not associated with glial fibrillary acidic protein. That is, there is a margin of safety between “optimal” arterial blood pressure and arterial blood pressure at the lower limit of autoregulation, which is not associated with elevated levels of glial fibrillary acidic protein during bypass.
Table 2 Comparison of autoregulation parameters by the highest third to the lowest 2/3 of peak glial fibrillary acidic protein (GFAP) values.

The highest 1/3rd was defined as having a peak GFAP of 0.471 or above. The table shows the medians (IQR) for autoregulation derived values of peak haemoglobin volume index (HVx), mean optimal blood pressure on HVx monitoring (ABP opt), and % time below lower limit of autoregulation.
Statistical significance between groups determined by Wilcoxon’s ranked sum test, p value<0.05.
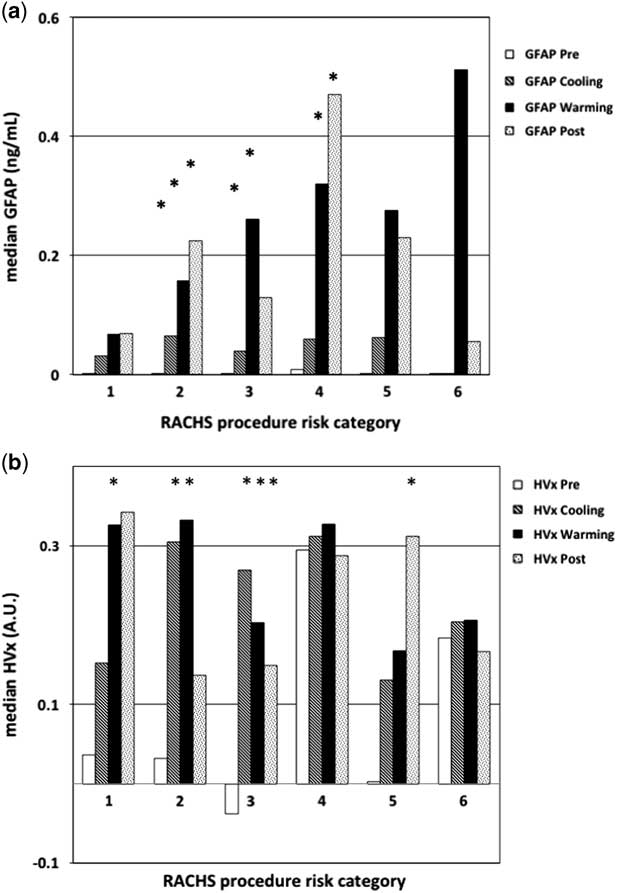
When evaluating the alterations in glial fibrillary acidic protein level and haemoglobin volume index based on risk-adjusted congenital heart surgery scores, there was a trend for higher glial fibrillary acidic protein values in patients with higher risk-adjusted congenital heart surgery scoring, though this was not significant (p=0.05 by analysis of variance, see Fig 5a). In this analysis, the majority (43%) of variation observed in glial fibrillary acidic protein values was attributable to the phase of bypass, and patient complexity accounted for only 16% of observed glial fibrillary acidic protein variation. This is largely because the majority (79%) of this study cohort had low risk-adjusted congenital heart surgery scores (⩽3), with insufficient complexity to demonstrate an association with risk-adjusted congenital heart surgery scores. For the haemoglobin volume index values, there was no association with risk-adjusted congenital heart surgery scoring (p=1.0, by analysis of variance, see Fig 5b). Together, these findings suggest that higher haemoglobin volume index values are more associated with alteration of blood pressure during the bypass procedure and less related to the complexity of surgery; however, individual patient vulnerability to this impairment and potential brain injury, indicated by the trend in elevated glial fibrillary acidic protein level, may be associated with the complexity of the patient and the surgery.

Figure 5 Graph of median glial fibrillary acidic protein (GFAP) and haemoglobin volume index (HVx) by phase of bypass and risk adjustment for congenital heart surgery score (RACHS) group. ( a ) There was a trend in higher GFAP levels by phase of the bypass procedure and by the complexity of the surgery, represented by the RACHS score. ( b ) Higher HVx values during cooling and rewarming, impairment by phase of bypass but not by the complexity of the surgery. Two-way repetitive measures analysis of variance (ANOVA) was used to compare the changes in either GFAP or HVx by phase of cardiopulmonary bypass (CPB) and RACHS score. *Significant difference compared with pre-bypass values within the same RACHS group; p value<0.05 using repetitive measures ANOVA.
Discussion
The major findings of this study are as follows: dynamic cerebrovascular reactivity monitoring using haemoglobin volume index can be conducted successfully at multiple centres in children undergoing bypass; higher haemoglobin volume index values suggestive of impaired autoregulation were associated with hypotension (arterial blood pressure<40 mmHg); and elevation in the specific brain injury marker, glial fibrillary acidic protein, during bypass was associated with a higher haemoglobin volume index. We further report the use of the haemoglobin volume index for monitoring cerebrovascular reactivity in patients with cyanosis undergoing bypass, finding no difference in the lower limit of autoregulation in patients with this condition compared with those with acyanotic CHD.
Non-invasive near-infrared spectroscopy-based vascular reactivity monitoring was developed through a series of laboratory investigations demonstrating that relative total haemoglobin could serve as a surrogate for the intra-cranial pressure waveform. In those studies, slow waves of relative total haemoglobin measured with near-infrared spectroscopy were coherent with slow waves of intra-cranial pressure.Reference Lee, Kibler and Benni 22 Applying the monitoring technique in piglet models with and without brain injury, haemoglobin volume index was significantly related to the pressure reactivity index, which is a similar measure derived from invasive intra-cranial pressure monitoring. In that study, the area under the receiver operator characteristics curve for haemoglobin volume index to detect the lower limit of autoregulation was 0.85. Subsequently, Zweifel et alReference Diedler, Zweifel and Budohoski 32 studied 40 patients with closed head injury and found there was a significant correlation between intra-cranial pressure-based pressure reactivity index and near-infrared spectroscopy-based haemoglobin volume index across individual recordings (r=0.49, p<0.0001) and across patients (r=0.56, p=0.0002). Our findings compliment and further develop these earlier findings and suggests that haemoglobin volume index monitoring might have potential value for patients undergoing cardiac surgery even when routine bedside measurements are abnormal – for example, near-infrared spectroscopy-based cerebral oximetry is low because of cyanotic CHD – or for patients with increased intra-cranial pressure – for example, those with trauma or stroke – for whom direct intra-cranial pressure monitoring is not feasible because of anticoagulation.
Some brain injury researchers favour finding an “optimal” arterial blood pressure for targeting blood pressure management compared with defining a lower limit of autoregulation threshold.Reference Steiner, Pfister, Strebel, Radolovich, Smielewski and Czosnyka 33 They note that a lower limit of autoregulation identification requires a significant deviation in blood pressure below a patient’s lower limit of autoregulation of sufficient duration, which potentially exposes the patient to periods of impaired autoregulation and potential cerebral hypoperfusion. Ideally, clinical management of a patient should maintain the blood pressure when the autoregulation mechanism is intact and robust. For instance, favourable neurological outcomes for patients with traumatic brain injury have been associated with arterial blood pressure management that “optimises” autoregulationReference Steiner, Pfister, Strebel, Radolovich, Smielewski and Czosnyka 33 , Reference Aries, Czosnyka and Budohoski 34 ; however, in patients with cardiac disease, increasing arterial blood pressure to optimise autoregulation could potentially increase left ventricular afterload, impair cardiac function, and reduce visceral perfusion. Another approach would be to establish a baseline autoregulatory state or index for each patient, and use this value to set a threshold for optimal arterial blood pressure. Although this approach is not typically available in the traumatic brain injury population, it could be more feasible for awake and neurologically intact patients who undergo bypass.
In our study, optimal arterial blood pressure was easily identified in all patients using haemoglobin volume index and was always above the lower limit of autoregulation, suggesting the potential to design a peroperative blood pressure management strategy that would target the lowest haemoglobin volume index value which would provide both robust cerebrovascular reactivity and maintain the individual above his or her lower limit of autoregulation. Most patients’ curves demonstrating an optimal arterial blood pressure without a lower limit of autoregulation were the result of patients being above their lower limit of autoregulation for the entire monitoring period, thus precluding identification of their lower limit; however, almost all patients had a point of maximal autoregulation or vascular reactivity that could be identified as their “optimal” arterial blood pressure, even in those patients that had robust autoregulation at all levels of blood pressure (see Fig 1 – patient C). Future clinical and basic science studies using dynamic autoregulation monitoring in the setting of bypass will be helpful to delineate individual and global thresholds for haemoglobin volume index and other autoregulation monitoring methods to help refine blood pressure management and bypass flow strategies. In our patient cohort, baseline autoregulatory behaviour during the pre-bypass phase of the surgery was robust for the majority of patients with 81% having a haemoglobin volume index <0.3. This suggests that 19% had impaired cerebrovascular reactivity at the start of bypass; the exact cause of this impairment is unclear as there were no haemoglobin volume index measurements made before induction of anaesthesia and placement of an arterial line.
Though our current study did not control for anaesthetic, temperature, or blood pressure management, there appears to be a relationship between hypotension and elevation in serum biomarkers. For instance, our finding of a trend between the % time spent below the lower limit of autoregulation and the magnitude of glial fibrillary acidic protein change suggests an associative relationship of impaired autoregulation from low blood pressure with increased glial fibrillary acidic protein into the serum from injured neural tissue. Though speculative, the most likely mechanism for brain injury would be brain hypoperfusion and clinically silent stroke – findings consistent with MRI studies of brain injury in children undergoing bypass.
Finding a serum marker for brain injury is highly desirable and there are many studies that have sought to evaluate a detectable serum biomarker of brain injury; however, early neuro-biomarkers like S100B calcium-binding protein and neuron-specific enolase were found to be non-specific or to be influenced by haemolysis and renal dysfunction, both factors found in cardiac surgery. Glial fibrillary acidic protein is an astrocyte intermediate filament protein highly specific to neural tissue and is not normally present in blood, making the presence of glial fibrillary acidic protein in the serum representative of astrocyte injury or necrosis. Our group has previously shown that during CHD, glial fibrillary acidic protein levels increase significantly during bypass phases, with peak levels observed during rewarming. In a follow up study of 116 children having CHD surgery, lower nadir oxygen delivery during bypass was associated with increased glial fibrillary acidic protein levels, suggesting that diminished oxygen delivery during CHD surgery may be contribute to neurological injury.Reference Magruder, Hibino and Collica 25 Similarly, our group has shown in adults that both hypotension, indicated by blood pressure below the optimal level, and the rewarming rate during cardiac surgery are associated with glial fibrillary acidic protein releaseReference Hori, Ono and Rappold 35 , Reference Hori, Everett and Lee 36 and that higher glial fibrillary acidic protein levels were associated with cognitive decline in patients after cardiac surgeryReference Rappold, Laflam and Hori 37 ; therefore, the haemoglobin volume index or oxygen delivery–glial fibrillary acidic protein relationship may provide a useful measure for the implementation of neuroprotective strategies in CHD surgery, including goal-directed perfusion. It is interesting that in neonates treated with whole-body cooling for hypoxic ischaemic encephalopathy, a similar pattern of peak glial fibrillary acidic protein levels with rewarming was shown to be associated with brain injury on MRI and also with worse functional outcomes.Reference Ennen, Huisman and Savage 38
In our study, dynamic haemoglobin volume index monitoring detected periods of impaired reactivity that were temporally related to periods of hypotension (arterial blood pressure<40 mmHg) and elevations in the glial fibrillary acidic protein level in our cohort of children undergoing bypass for CHD surgery. We observed significant impairment in autoregulation measurements and in the measured serum glial fibrillary acidic protein level with initiation of bypass and cooling; as evidenced by increased haemoglobin volume index and glial fibrillary acidic protein values. For the study cohort, haemoglobin volume index values and glial fibrillary acidic protein levels became significantly elevated during the rewarming period, only to normalise in the majority of patients in the post-bypass period. Though our glial fibrillary acidic protein levels were lower than those reported in the previous studies, significant elevations did occur that would have been predictive of poor neurological outcomes in those previous studies. This suggests that even transient and severe rises in the glial fibrillary acidic protein level may be indicative of the occurrence of a brain injury. The continued rise in glial fibrillary acidic protein values while haemoglobin volume index values returned to baseline in the post-bypass period may be responsible for the significant but poor performance of the receiver operator curve between peak glial fibrillary acidic protein level and haemoglobin volume index values. Though beyond the scope of this data set, future studies assessing the duration of autoregulation impairment based on time spent below the lower limit of autoregulation and on the peak value of haemoglobin volume index may be more sensitive and specific to defining periods of hypoperfusion detected by autoregulation monitoring. Such acute and sustained elevation in serum glial fibrillary acidic protein may be associated with acute neuronal injury during CHD surgery.Reference Hori, Everett and Lee 36 , Reference Rappold, Laflam and Hori 37
Limitations of the study
The design of this pilot study was to observe the feasibility of autoregulation monitoring at multiple congenital heart surgery sites and to develop a network for potential multicentre investigations. Thus, our study was not powered to correlate prolonged periods of impaired autoregulation with the incidence of stroke or other neurological complications. Another limitation is the challenge in obtaining sufficient waste blood and autoregulation data to perform correlations for all phases of the bypass. As the patients of the present study were observed and managed at the convenience of routine clinical care at their respective institutions, this did not require that the near-infrared spectroscopy probes remain in position or be replaced for the autoregulation monitoring; or that there be sufficient blood volume drawn to assure a glial fibrillary acidic protein measurement during each phase of bypass. Future studies can focus on eliminating institutional management differences and on minimising data loss through uniform management protocols and timing of blood draws.
Summary
Cerebrovascular reactivity monitoring is possible in children with both cyanotic and acyanotic CHD and can be used to identify the lower limit of autoregulation below which the brain has increased vulnerability to ischaemia. Periods of impaired autoregulation that bridge to elevated glial fibrillary acidic protein level suggest possible episodes of neurological injury from brain hypoperfusion. The elevation in both haemoglobin volume index and glial fibrillary acidic protein level were significant during rewarming, indicating the potential period of greatest neurological vulnerability.
Acknowledgements
None.
Financial Support
This work was supported in part by the American Heart Association – Southern Conference (R.B.E. Award no. 11CRP7230021) and the National Institute of Health from the subsection National Heart, Lung and Blood Institute (RO1-HL-092259).
Conflicts of Interest
The authors have the following financial conflicts of interest to disclose: K.M.B. has consulted for Somanetics, Inc. in a relationship that was managed by the committee for outside interests at the Johns Hopkins University School of Medicine; A.D.E. has developed and patented technology related to detection of glial fibrillary acid protein and this is managed by the committee for outside interests at the Johns Hopkins University School of Medicine; C.W.H. served on the advisory board and has receive lecture honorarium form Medtronic/Covidien, Inc., Minneapolis, Minnesota who manufacture the near-infrared spectroscopy monitors used in this study.
Ethical Standards
The authors assert that all procedures contributing to this work comply with the ethical standards of the relevant national guidelines on human experimentation and with the Helsinki Declaration of 1975, as revised in 2008, and has been approved by the institutional committees of Baylor College of Medicine School of Medicine, Cincinnati University School of Medicine, and Johns Hopkins School of Medicine.