1. INTRODUCTION
This paper presents a new approach to integrate the data assessed through ship-borne Automatic Identification System (AIS) transponders and space-borne Synthetic Aperture Radar (SAR). SAR is an imaging radar that is capable of providing 2-dimensional radar images with fine spatial resolution under all-weather conditions (Jackson and Apel, Reference Jackson and Apel2004). SAR data can enhance environmental assessment for naval applications in ship surveillance (Arnesen and Olsen, Reference Arnesen and Olsen2004). AIS data has the potential to contribute to the design of detection algorithms for ship identification in SAR images over wide areas when combined with various automated ship detection methods which have already been developed. There can also be discrepancy of up to several minutes between the predicted and actual satellite pass times (Vachon et al., Reference Vachon, English and Wolfe2007).
Ship detection by SAR in coastal waters and ports has several problems to overcome, since many ships of varying sizes and types (with and without AIS transponders) exist in these highly complex and busy ship traffic regions. In particular, a large number of AIS signals are transmitted from ships, and signals from different ships sometimes overlap, resulting in the loss of some signals. This causes difficulty in identifying the AIS signals corresponding to particular ships in the SAR image. Radar and AIS have a short transmission range for the exchange the vessel's identity information. However, satellite based SAR provides a large area of coverage for a particular region. The ships' information such as size, position and speed can be estimated for the targets without identity information. Exact ‘Time Matching’ between AIS and SAR acquisition is cumbersome because the satellite acquisition only occurs for a short period of time but AIS transmissions usually occur continuously.
Many researchers from different organizations and research institutions have been trying to find an appropriate way to integrate SAR (wide area coverage) and AIS (small area coverage instrument) in order to design and operate a real-time system for ship detection in coastal waters as well as in the open sea in order to discriminate and identify ships. Most general concepts presented to date are for discrimination of detected targets, where those associated with SAR-AIS contacts are defined as ‘ships’, and non-associated targets are declared as ‘unidentified targets’ (Grasso et al., Reference Grasso, Mirra, Baldacci, Horstmann, Coffin and Jarvis2009). An operational ship monitoring system has been proposed which identified the ships' position within the confined image boundary without any matching criteria between SAR-AIS correlated ships but around half of the detections had ‘no category’ assigned.
The positioning concept is also described, for example, by the Kongsberg Maritime Group, Norway (Margarit et al., Reference Margarit, Barba-Milanes and Antonio2009; Grasso et al., Reference Grasso, Mirra, Baldacci, Horstmann, Coffin and Jarvis2009) where an automatic real-time system for coastal monitoring was developed. The results of the ship detection near the coasts of Norway were considered, although the information related to SAR-and AIS-derived vessels within the confined image boundary did not contain any specific evidence of their matching criteria. The previous studies on ship detection by SARs are, of course, very useful, but many are often limited to ships in open sea rather than those in coastal regions.
The key objectives of this paper are as follows:
• To detect the ships' position in TerraSAR-X® HH-polarization image datasets (SpotLight mode) over Incheon Port in South Korea and Tokyo Bay in Japan using thresholding, morphological and concatenating operations on different dates of acquisition.
• AIS data sorting and estimation of Dead Reckoning (DR) positions.
• To perform three consequent criteria of ‘Position Matching’, ‘Size Matching’, and ‘Speed Matching’ between SAR and AIS based ships in order to achieve integrated output results with an estimate of their respective error reports along with the compensation of the azimuth position shift (Raney, Reference Rany1971; Ouchi et al., Reference Ouchi, Iehara, Morimura, Kumano and Takami2002).
• Generate graphical screen results.
The paper is organized as follows. Section 2 describes the design of the proposed integrated ship detection system. Section 3 describes the experiment including the SAR, meteorological, and AIS data; in Section 4, experimental results and discussions are given, followed by summary and conclusions in Section 5.
2. DESIGN OF AN INTEGRATED SYSTEM
Figure 1 shows the schematic flowchart to illustrate the integration of SAR and AIS. The input datasets consists of SAR images and AIS. The left hand side of the flowchart shows the SAR image data processing in which a threshold method with the morphological and concatenating matrix is applied to the SAR amplitude image to detect ships and to estimate their respective centre positions in terms of latitude and longitude along with their respective ships' hull boundaries. Correction of their respective positions is made based on the ‘true’ positions of ships at the time of the image acquisition from the AIS data processing as in the right hand side of the flowchart.

Figure 1. Flowchart to design an integrated system for ships' detection and recognition by SAR and AIS data. Red arrow indicates the conditional line arrow, which shows if matching is well performed (‘Yes’), then final output will be delivered, otherwise (‘No’) loop will continue for the next target search.
There are various advantages of integration of SAR and AIS:
• Search ‘friend’ and ‘foe’ ship targets.
• Useful for detection of various AIS and non-AIS based ships.
• Useful for validation.
• Different matching criteria (i.e., ‘Time’, Position’, ‘Size’ and ‘Speed’) between SAR and AIS based ship targets have been introduced in order to establish the exact SAR-AIS correlation.
A very large volume of AIS data is transmitted from ships and is received at ground stations. The transmission interval of AIS signals depends on the speed of a ship. If ships are stationary or at low speeds (< 3 knots), the signal transmission interval (IMO AIS User Manual, United Nations) varies between several 10 s of seconds to 3 minutes; while it is 2 to several 10 s of seconds for ships moving at high speed (> 3 knots). For each ship (unknown in the SAR image at this stage), the ‘Time Matching’ criterion is assessed first, which means, the time difference ∆t = t SAR−tAIS is established, where t SAR is the time of the SAR data acquisition at the image centre or for each SAR-derived ships' time at each line pixels, and t AIS is the time of the AIS signal reception. The AIS signal closest to the SAR image acquisition time (i.e., the smallest ∆t) is then extracted. The AIS signal includes information on the ship's position, speed and course; therefore, the position of the ship at the time of SAR data reception can be estimated from the time difference ∆t. Two different cases are analysed based on the time difference ∆t, as follows.
2.1. Case 1 – AIS Information Available
The comparison is carried out for the SAR and AIS times. If a ship has AIS information before and after the image acquisition, it is not difficult to extract the signal for which the reception time is closest to the SAR data acquisition time; the ship's position at the time of an image acquisition is estimated using the time difference ∆t and the previous AIS information and known as the DR position. If the ship has a slant-range velocity component, its position in the SAR image is shifted from the true position in the azimuth direction (Raney, Reference Rany1971; Ouchi et al., Reference Ouchi, Iehara, Morimura, Kumano and Takami2002). Since the ship's speed is known from the AIS information, correction can be made on the DR position by taking into account the azimuth image shift.
Case 2 – No AIS Information Available
If there is no AIS information for a ship before image acquisition, a reverse method can be applied which means the first position, course, and speed can be chosen for each ship. With the consideration of ∆t; the DR position can then be retrieved and corresponds to the position at the time of an image acquisition.
Once the ‘Time Matching’ criterion is performed and satisfied, an appropriate search bounding box is set around the obtained positions, where the size of the box is variable and depends on the speed, course, and heading. This box represents the cut-off for the certain number of ships around DRs which means it determines the distances from DRs to each ship within the box and will ignore the targets which are outside, in order to avoid confusion when searching and matching other SAR-derived ships in an image.
A ‘Position Matching’ criterion, based on a nearest neighbour re-sampling method, is then applied to find the corresponding ships in the SAR image based on the nearest distance estimation between each SAR-AIS correlated ships.
The nearest neighbour distance (d) which is represented in terms of ‘d1, d2, d3, d4, d5' can be estimated using the following relationship:
where:
(x_ DR, y_DR) is the DR position (obtained through closest previous position of the ships with respect to image acquisition time).
(x_ SAR, y_SAR) is the SAR-derived ships' position (obtained through concatenating operation).
Once the ships are identified based on the ‘Position Matching’ criterion, Size Matching’ and ‘Speed Matching’ criteria are then applied in order to validate whether the correlated ships are ‘well-matched’ or ‘not-well-matched’ in terms of their respective position, size and speed errors under a limit of 20%. If the matching result is satisfactory, the final output is delivered with an error estimate; otherwise the search loop continues to find a ship that matches the AIS data. If no matching ship is found, the loop closes reporting ‘no match’. Various consequent problems such as incorrect shipboard AIS implementation, position differences and errors in SAR geo-referencing may produce an error in the matching results.
3. EXPERIMENTAL DATA ANALYSIS
3.1. SAR Data Observation
Two different research sites with different geo-locations were chosen in order to perform the integration test. Figure 2 illustrates the Incheon research site, on the left is the TerraSAR-X® image HH-polarization (SpotLight mode) data acquired on May 02, 2010 over the Incheon Port in South Korea, overlaid on the optical image. The area indicated by the white rectangular box in the left of Figure 2 was selected as the area to test the proposed technique and is shown in the enlarged image in the right of Figure 2. It contains the images of six ships indicated by circular/elliptical white dashed boundaries.

Figure 2. Research site (Left). Experimental test site of Incheon port with overlaid TerraSAR-X HH-polarization image (Ascending: SpotLight mode) acquired on 2 May 2010. Research site (Right). Enlarged image of the white rectangular area on the left shows six ships with various signatures and are surrounded by circular/elliptical boundaries.
Figure 3 shows the experimental research site and the TerraSAR-X® HH-polarization (SpotLight mode) data acquired on May 30, 2011 over Tokyo Bay, Japan. Region-A (black dotted square box) and -B (red dotted square box) shows the presence of different types of ship signatures with various navigation status. The specification of the TerraSAR-X® image data used for this study is tabulated in Table 1 for both the datasets.
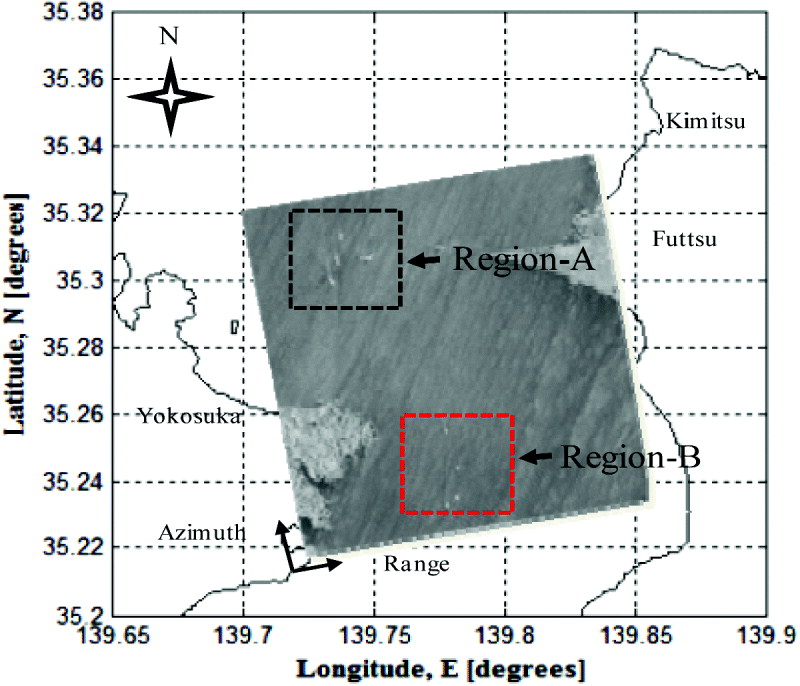
Figure 3. Research site for Tokyo Bay, Japan. TerraSAR-X image HH-polarization (SpotLight) data acquired on 30 May 2011. Two different regions, Region-A and Region-B, represent the region for the ships' detection with presence of various ship signatures. AIS oriented regions are unknown at this stage.
Table 1. SAR data specification.

3.2. AIS Data
AIS is a system used for tracking and identification of vessels at sea and is widely employed for maritime and navigation safety and security. The messages are transmitted at intervals of 2–10 seconds, depending on the vessel type and its speed. The position of the ship is provided by the ship's navigational sensors, usually Global Navigation Satellite System (GNSS), and the signals are transmitted by the AIS transponder operating in the VHF band and received at ground stations (Wahl et al., Reference Wahl, Eldhuset and Skole1993).
AIS data contains the static and dynamic information of a ship. The static information includes the Maritime Mobile Service Identification (MMSI) number, type and size of the ship. The dynamic information includes the Speed Over Ground (SOG), Course Over Ground (COG), navigation status, heading, Message Identity (ID), expected time of arrival and departure, and other details (Lehner et al., Reference Lehner, Brusch and Fritz2009). AIS signals can be received on their own as well as simultaneously with ground-based radars. In the latter case, AIS signals and ships' radar echoes can be overlaid on a radar Plan Position Indicator (PPI) and matched. For the former case without ground-based maritime radars, however, it is difficult to correlate the AIS signals and the corresponding ships in SAR images. In coastal waters and ports, many ships are either anchored or underway, and very large volumes of AIS messages are generated randomly. Thus, selection of AIS signals at and around the times of SAR data acquisition is necessary for the identification of ships transmitting the AIS signals at the same time as a SAR image is taken.
4. EXPERIMENTAL RESULTS AND DISCUSSION
This section describes the analysis, results and discussion for the integrated system as explained in the previous section.
4.1. Integrated System Result, 2 May 2010
Figure 4 shows the extracted six SAR-derived ships along with their centre positions marked by cyan crosses (others such as MMSI, DR-A/B, and numbers will be explained later). Ship detection is performed by image thresholding and morphological operation with a mathematical tool that permits analysis of the object in greyscale / binary images. The position of each ship is determined by a concatenating operation which determines the centroid for each and every grouped pixel present in the morphological images and mapped in terms of latitude and longitude. Among all the morphological structuring elements, a disk shape element with certain pixels of radius provides the shape of the ship in the images (Soille, Reference Soille1999). Based on this morphologically structured element, the SAR-derived ship signal boundaries can easily be predicted for the further steps of a size matching criterion. It should be noted, however, that the SAR-derived shape of a ship is very approximate, since it depends on the backscattering mechanism as well as the effects of ship's motion, and thus, the estimated size does not always reflect the true size.

Figure 4. The detected centre positions (cyan crosses) are of ships in the SAR image shown in Figure 2. The white circles are the positions of AIS signal reception with MMSI number, times [UT] of signal reception, and [cruising speed in knots, COG in degrees]. The open white circles correspond to the ships' positions at the time of SAR data acquisition estimated by DR. The white lines are the courses of Ships 3 and 4 estimated from the AIS data, and the white triangles show the positions of corresponding ships after correction of azimuth image shift. Ships 1, 2 and 6 were anchored but they drifted a small distance. Ship 5 did not transmit AIS signals.
All six ships in the image, prior to matching, could be verified through the AIS datasets. The AIS-reported positions were projected to the expected pixel locations in the imagery based on AIS position for the vessel and the imaging geometry. It shows the ship identification information such as MMSI numbers, the time of AIS signal transmission (indicated as ‘Time’, particularly for Ships 3 and 4), and [s, COG] meaning [cruising speed in knots, which will be changed later to m/s for further processing, course over ground in degrees].
Ships 3 and 4 are underway as mapped by the AIS trajectory indicated by white lines. These lines are obtained after mapping the AIS positions over the confined image boundary. In this dataset, the AIS information status is found to be ‘Yes’ before as well as after the image acquisition (as per first condition of the flow chart in Figure 1). These images are displaced in azimuth direction from their original positions due to the effect of azimuth image shift caused by the slant-range speed components of the moving ships.
‘Time Matching’ between SAR and AIS data acquisitions is carried out in order to estimate the DR position based on the known previous position (white dot) for two ships which are in the middle of the image (e.g., Ships 3 and 4), where DR = f (u, ∆t, COG). Since the DR indicates the geo-location of a ship with respect to the GPS antenna position attached to the deck of the ship, it is necessary to shift the DR location to the centre of the ship's deck in order to obtain accurate position matching results for the further steps. Ship wakes can also be partly seen behind the ships' stern for Ships 3 and 4. The azimuth shift compensation is also made at this stage based on the known speeds and courses of Ships 3 and 4. The positions found are represented with white triangles (displaced towards the north).
DRs are represented by open white circles for all ships except Ship 5, from which the AIS signal was not received. DRs are the positions obtained at the time of image acquisition and are not the shifted positions. DR-A and DR-B are located on the AIS trajectory lines (white lines in Figure 4) of the moving ships. It can be observed that these DRs are some distance from the SAR-derived detected Ships 3 and 4; hence confusion arises when assigning DR-A and DR-B to ships (i.e., to Ship 3 or Ship 4). DRs for stationary ships have also been found but with little positional difference between the AIS and SAR data. Thus, these AIS signals can be considered as having been transmitted from Ships 1, 2 and 6 in the SAR image and SAR based positions (cyan crosses); as the AIS-based DR positions are very close, it appears these ships are stationary. As shown in Figure 4, all SAR-derived ships (cyan crosses) are towards the right side of the AIS-DR plotted positions (open white circles) due to geometric registration errors or system communication problems. The white circles near to ships 1, 2 and 6 represent the AIS positions either before or after the image acquisition. These ships were stationary at the same time of an image acquisition but still there was the possibility of having their speeds before or after the acquisition (very negligible position difference as DRs and white circles are very close to each other).
Figure 5 shows the search bounding box around DR-A (yellow/orange rectangle), and around DR-B (white rectangle) with 2 km of diagonal distance (distances are variable and depends on ships' navigation status). A ‘Position Matching’ criterion is then applied based on nearest neighbour re-sampling method for estimating and searching the SAR-based potential ships for DR-A and DR-B. In the case of DR-A, Ship 3 appears closer than Ship 4 within the bounding box because of the centre distance (white arrow) between DR location and SAR contact location (d1=137·44 m). In the case of DR-B, Ship 4 is closer (d4=155·56 m) than Ships 3 and 5 within the box by means of estimated distances (yellow/orange arrows) from DR-B to the SAR contact location. This means that the potential ships corresponding to DR-A and DR-B are Ships 3 and 4 respectively and the output comes after the comparison of minimum positional error.

Figure 5. The yellow/orange and white lines indicate the search bounding boxes around DR-A and DR-B respectively. The boxes have a diagonal distance (variable) of around 2 km. The ‘Nearest Neighbour’ re-sampling method is applied to search SAR-derived ships within the bounding boxes. The estimated respective distances (white arrow) from DR-A to SAR derived Ships 3 and 4 were d1=137·44 m and d2=287·53 m. Similarly, respective distances (yellow/orange arrow) from DR-B to Ships 3, 4 and 5 were d3=330·79 m, d4=155·56 m and d5=763·84 m. Thus the potential ships corresponding to DR-A and DR-B are Ships 3 and 4 respectively.
A ‘Size Matching’ criterion is then used in order to match the size of each ship derived from SAR in terms of metres compared to the obtained ‘true’ data. The error in ships' lengths from SAR data compared with the ‘true’ values acquired from AIS for Ships 1, 2 and 6 are 3·09%, 5·99% and 20·04% respectively, and for Ships 3 and 4, they are 14·31% and 16·67% respectively (see Table 2). Thus, the measurement error by SAR is less than 20% for all the ships except for Ship 5 due to its lack of AIS data. The extraction of ships' hull boundaries through SAR imagery provides the approximate value due to various unwanted sea clutters and ships' motion observed in an image.
Table 2. Integrated system output result: 2 May 2010.

The images for Ships 3 and 4 are shifted in azimuth direction due to the slant-range velocity component and the effect can be observed with the AIS trajectory and SAR-derived ships' position. In order to satisfy the fourth criterion of ‘Speed Matching’, it is necessary to estimate the azimuth shift for Ships 3 and 4 based on the known AIS trajectory. The azimuth distance from SAR-derived ships' position to the AIS trajectory (not shown here) provides the value of shift; they are found to be very close to DR-A and DR-B and are estimated as 130·06 m and 129·28 m for Ships 3 and 4 respectively. The detailed formulae and theoretical examples about the estimation of ships' speed (Lin and Khoo, Reference Lin and Khoo1997; Tunaley and James, Reference Tunaley and James2003) were applied in our research to estimate the SAR-derived ships' speed, which was estimated as 4·82 m/s and 4·78 m/s for Ships 3 and 4 with a corresponding matching error of 14·73% and 7·53% respectively (see Table 2). Thus, the measurement error under this criterion is also found to be less than 20% and it may be taken into account for the matched output results. The final result is illustrated in Figure 6 and comes out based on the methodology as explained in the previous section.

Figure 6. Graphical screen showing the final integration result. The hull boundary of matched SAR-derived ships is shown as a blue polyline. Ship 5 does not have AIS information and is an unidentified target (red polyline). Ships 3 and 4 were acquired over the new shifted position (red dot) shown with the hull signature (black polyline) displaced to compensate for the position shifts. Information on identified ships is also displayed on the screen.
Figure 6 displays the output results on a graphical screen mapped with the image coordinates and showing the final integrated result over the mapped image. It highlights the six SAR-derived ships, of which five ships were identified through AIS and one ship assigned as an ‘unidentified target’ (as described in previous section).
The blue polyline indicates the extracted ships' hull boundary through the SAR which comes out after the ‘Position Matching’, ‘Size Matching’ and ‘Speed Matching’ criteria.
Ships 1, 2 and 6 appear to be stationary and the matched ship signatures are at the same position, and hence, SAR-derived ships signature shows the well matched output results (error accuracy less than 20%) and acquired over their respective shifted positions near to the DRs, whereas Ships 3 and 4 were moving, for which we examined the DR-A and DR-B; they acquired the azimuth shifted position (black dotted polyline) and were displaced towards the north up by distances of 58·75 cm and 172·75 cm from the SAR-derived ships' positions. This result shows that categories can be assigned by this proposed technique. Although Ship 5 has no AIS report information, its presence and size can be identified with some confidence, since the other ships over the graphical screen are approximately well matched to the AIS data. Ship 5 did not have an AIS transponder, thus the SAR-derived ship boundary is shown in red to indicate it as an ‘unidentified target’ and its size can be only be extracted through SAR. The classified ships' navigation status is also displayed onto the screen for each ship in order to show the integrated system result at the final stage of processing with the display of the error reports.
4.2. Integrated System Result, 30 May 2011
In a similar manner, the ship's position is extracted in SAR imagery. In this case, the AIS information status shows ‘Yes’ but after the image acquisition (as per second condition of the flow chart as shown in Figure 1). A ‘Time Matching’ criterion is applied to estimate the AIS-based ships' position at the time of the SAR image acquisition by considering the first AIS position, course and speed.
Figure 7 can be regarded as the processed screen for the selected Region-A. The blue circle/dot represents the SAR-derived ships' position, the black circle/dot represents the AIS-based first position, and the open red circle represents the position obtained at the time of a SAR image acquisition (assigned as DR). The black arrow represents the direction towards the DR from first AIS position. The DR for Ships 1 and 2 shows well matched results very close to the SAR-derived ships' centre position; they satisfy the ‘Position Matching’ criterion based on the nearest neighbour re-sampling method with a certain error report (not provided here).

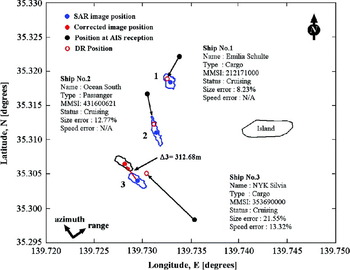
Figure 7. Graphical screen for the Region-A of Figure 3 in which the three different types of ships have been identified. Blue polylines represent the output hull pattern after the ‘matching criterion’. Ship 3 has the slant range velocity component and finally this ship acquires the azimuth shifted position (red dot) with the hull (black polyline).
A ‘Size Matching’ criterion is then applied between the SAR-derived hull patterns with ‘true’ size obtained from AIS and the results are set out in Table 3 with the output matching error of 8·23% and 12·77% for Ships 1 and 2 respectively. This error is less than 20% and can be taken into consideration for the output results.
Table 3. Integrated system result output: 30 May 2011.

In case of Ship 3, the obtained DR is found to be shifted from the SAR-derived ships' position. This shift can be used to estimate the SAR-derived speed for Ship 3 in order to satisfy the ‘Speed Matching’ criterion and the corresponding speed is found to be about 8·06 m/s, as shown in Table 3 with a measurement error of 13·32% which is also less than 20% and can be taken into consideration for the output results. The azimuth position shift is then estimated for Ship 3 with known speed and course and is found to be 312·68 m; the position is represented by red circle symbol. The size matching error for Ship 3 is 21·55% and is higher than 20%. But since this ship has been validated through the ‘Speed Matching’ criterion and, as there were no other ships nearby, Ship 3 can be assigned as the same ship target.
Finally, the ships' hull pattern can be shown on a graphical screen in order to enhance and indicate the accuracy of matching results. Furthermore, Ship 3 acquires the ‘shifted position’ (red circle symbol) with a black dotted polyline shape in order to compensate for the position shift problem. The identification details for each ship are also presented along with its name, MMSI number, status, type, and respective matching error reports are displayed on the graphical screen. This means that Ships 1 and 2 have well-matched output results on the basis of their respective position, size and speed; for Ship 3, the output result is based on ‘Position Matching’ and ‘Speed Matching’ criteria.
Figure 8 shows the graphical screen result for Region-B of Figure 3. Four ships have been detected using SAR since there is no AIS information for them. The position and size of ships were estimated based on the image processing techniques. These ships can be assigned as ‘non-AIS’ ships and the hull signatures are represented by the red polyline which is an indication of unidentified ships (as already described). The estimated ships' lengths are shown in Table 3 as 109·64 m, 100·03 m, 111·78 m and 144·93 m for the unidentified Ships 4, 5, 6 and 7 respectively. This example shows the advantage of SAR for the retrieval of ships' identification using SAR with a certain level of confidence in terms of respective positions and sizes.
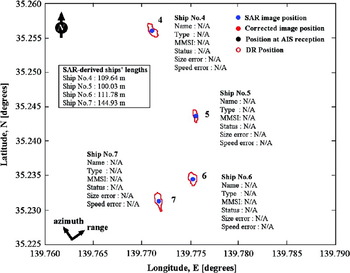
Figure 8. Graphical screen for the ships in Region-B (from Figure 3). Ships 4, 5, 6 and 7 do not have AIS information and are unidentified targets (red polyline). Ships' position and length can be extracted by SAR up to certain confidence level. The estimated ships' length is also mentioned at the top-right corner of the screen.
5. SUMMARY AND CONCLUSIONS
Our analysis demonstrated ship detection and identification by integrating SAR and AIS data. A TerraSAR-X® image HH-polarization (SpotLight mode) dataset was used for this study which was acquired over Incheon Port in South Korea and Tokyo Bay, Japan on 2 May 2010 and 30 May 2011 respectively. Specifically, ships' lengths were extracted from SAR imagery for a series of targets over the images, and a procedure for using AIS data as a validation tool was demonstrated. In the case of data acquired on 2 May 2010, very large volumes of AIS data were obtained before and after SAR image acquisition. Based on the previous AIS signal reports, DR positions were estimated for the further matching steps; five ships were detected, identified and well-matched while one ship was not validated through AIS but was detected in the SAR image and assessed with a certain level of confidence in terms of position and size. For the data acquired on 30 May 2011, the AIS data was obtained for only three ships and the DR estimation was carried out in reverse manner. Three ships was detected, identified and matched accurately with four unidentified ships acquired over the whole image area.
The following conclusions can be drawn from this research:
• The ‘Time Matching’ criterion was used to determine DR positions.
• The ‘Position Matching’ criterion was used and measurement accuracy was found to be suitable based on the nearest neighbour re-sampling method.
• The ‘Size Matching’ and ‘Speed Matching’ criteria gave a measurement error of less than 20%.
These results may be considered as a preliminary stage for the development of the integrated system for ships recognition over oceanic region. Of particular interest are that SAR-derived course and heading increases the matching accuracy. Above all, the SAR-derived ships' hull signatures and matching with AIS-based ship sizes proved to be the most important finding in this paper. It is very novel to monitor ships in coastal waters or the open sea with correction of position shifts and they are presented on the user graphical screen for better understanding of the results.
This work will contribute to the design of an operational system using a real-time satellite-based monitoring system (e.g., SAR), and ground based monitoring (e.g., AIS and radar) for ship monitoring in coastal regions with very dense traffic levels. Currently, a study is underway to develop an operational automatic system for different SAR sensors at different acquisition modes and polarizations with different acquisition geometry and different acquisition time. Only ship-borne AIS datasets have been considered for the integration. In future work, we will try to get Satellite AIS datasets for validation purposes.
ACKNOWLEDGEMENTS
This research work was supported by a grant from the Development of Korea Operational Oceanographic System (KOOS) funded by the Ministry of Land, Transport and Maritime Affairs of Korean government, the Basic Research Projects (PE98671 and PE98620) of KORDI and the Satellite Information Application Support Operation of Korea Research Council of Fundamental Science & Technology. Support by the PASCO Corporation, Japan is also appreciated. We specially thank to Mr. E. S. Won, Department of Computer Science, School of Electrical and Computer Engineering, NDA, Japan and Mr. Jung-Hwan Song, Department of Avionics, Korea Aerospace University, Korea for their valuable help toward collecting the field datasets.