INTRODUCTION
Type 2 diabetes is a growing global health problem with great socio-economic impact. It is a heterogeneous metabolic disease characterized by elevated blood glucose levels caused by insulin resistance and inadequate insulin production (American Diabetes Association, 2017). In 2015, a total of some 415 million people lived with diabetes, and most of them had type 2 diabetes (International Diabetes Federation, 2015). The association between type 2 diabetes and cognitive impairment and dementia in older people is now widely acknowledged (Biessels, Staekenborg, Brunner, Brayne, & Scheltens, Reference Biessels, Staekenborg, Brunner, Brayne and Scheltens2006; Cheng, Huang, Deng, & Wang, Reference Cheng, Huang, Deng and Wang2012), but whether diabetes affects cognitive functions already in middle age remains less clear.
For example, most research on diabetes-related cognitive dysfunction has focused on people over age 65. However, as the prevalence of diabetes is growing in younger age groups (International Diabetes Federation, 2015), there is reason to expect that cognitive symptoms will also begin to increase in middle-aged and younger people. Early detection of cognitive symptoms could help to improve patients’ quality of life and the management of diabetes, as the treatment of diabetes is mostly dependent on the patient and requires many cognitive abilities such as memory and executive functions (Tomlin & Sinclair, Reference Tomlin and Sinclair2016). Good glycemic control in midlife could in turn help to prevent late-life cognitive decline (Tuligenga et al., Reference Tuligenga, Dugravot, Tabák, Elbaz, Brunner, Kivimäki and Singh-Manoux2014). There is thus an obvious need for more information about the possible early adverse effects of diabetes on cognitive functions.
Numerous reviews and meta-analyses link type 2 diabetes to cognitive deficits and describe the multiple mechanisms underlying those deficits in older people (Awad, Gagnon, & Messier, Reference Awad, Gagnon and Messier2004; Kodl & Seaquist, Reference Kodl and Seaquist2008; McGrimmon, Ryan, & Frier, Reference McGrimmon, Ryan and Frier2012; Monette, Baird, & Jackson, Reference Monette, Baird and Jackson2014; Palta, Schneider, Biessels, Touradji, & Hill-Briggs, Reference Palta, Schneider, Biessels, Touradji and Hill-Briggs2014; Reijmer, van den Berg, Ruis, Kappelle, & Biessels, Reference Reijmer, van den Berg, Ruis, Kappelle and Biessels2010; Sadanand, Balachandar, & Bharath, Reference Sadanand, Balachandar and Bharath2015; Vincent & Hall, Reference Vincent and Hall2015). According to these studies, cognitive deficits in diabetes patients are most frequently evident in the domains of memory, executive functions, and speed of information processing. In contrast, it seems that visuospatial functions and language processes are relatively unaffected.
For example, Reijmer et al. (Reference Reijmer, van den Berg, Ruis, Kappelle and Biessels2010) conclude that patients with diabetes show worse performance than controls especially in processing speed, verbal memory, attention and executive functions, with effect sizes ranging from −0.2 to −0.8. They discuss the numerous diabetes-specific and comorbid risk factors associated with cognitive decrement, such as hypo- and hyperglycemia, microvascular complications, hypertension, depression, and stroke. Furthermore, Reijmer et al. (Reference Reijmer, van den Berg, Ruis, Kappelle and Biessels2010) point out that, even though cognitive decrement may progress slowly over time, it can already begin to appear in the pre-diabetic stages, with the presence of hyperinsulinemia and impaired glucose metabolism. Despite these findings and the numerous reviews and studies conducted in older patients with diabetes, no review or meta-analysis exists that focuses specifically on the middle-aged.
To increase awareness and improve the treatment of early cognitive decrement associated with diabetes, this meta-analysis aims to give insight into the relationship between type 2 diabetes and cognitive functions in people aged 65 or younger. Specifically, the objective was to determine the possible differences (effect sizes) between middle-aged patients with type 2 diabetes and healthy controls in the most common cognitive domains. The secondary aim was to examine whether the magnitude of effect sizes is related to the age of diabetic patients.
METHODS
This meta-analysis was conducted in accordance with Preferred Reporting Items for Systematic Reviews and Meta-Analyses (PRISMA) standards (Moher, Liberati, Tetzlaff, & Altman, Reference Moher, Liberati, Tetzlaff and Altman2009).
Selection of studies
Articles published between January 2000 and January 2017 were searched from the following electronic databases: PubMed/MEDLINE, Science Direct, Wiley Online Library, Web of Science, Scopus, Ovid, PsycARTICLES, PsycINFO, CINAHL, and Academic Search Premier. The search was conducted in January 2017. The choice of timeframe was based on advances made in neuropsychological methods from 2000 onward. The following cognitive function search terms were used: “cognition”, “cognitive function”, “neuropsychological”, “mental”, “intelligence”, “executive function”, “memory”, “processing speed”, “psychomotor speed”, “attention”, “verbal”, “visual”, “visuospatial”, “learning”, and “fluency”. These words were combined with the following type 2 diabetes-related search terms: “type 2/II diabetes”, “type 2/II diabetic”, and “diabetes mellitus 2/II”. The search terms were restricted to the title of the article. When possible, searches were limited to articles in English, articles with abstracts, and peer-reviewed journal articles. Lists of reference in the selected articles were also scanned for possible additional studies.
The search results were screened by researchers based on titles, abstracts, and full texts. Disagreements were resolved by consensus. The exclusion criteria were as follows: (1) article not available in English; (2) pharmacological study; (3) intervention study; (4) animal study; (5) case study; (6) letter, comment, opinion, poster, or only abstract available; (7) study focused on the effects of acute hypo- or hyperglycemia; (8) psychometric study (e.g., purely standardization study); (9) cognitive functions not in focus of the study (e.g., study focused only on neurophysiological/neuroanatomical/neurobiological functioning in diabetes); (10) study covered only mild cognitive impairment or dementia; (11) cognitive functions not assessed with a standard neuropsychological method; (12) review or meta-analysis; (13) age of diabetic patients over 65 based on mean and standard deviation (SD), or age not available; (14) no healthy control group; and (15) data not available to calculate effect sizes. Duplicates were also excluded.
Data Extraction and Management
One author (E.P.) independently extracted the following data from the studies: author(s), year of publication, sample sizes and demographic data including age, education and gender distribution of patient and control group, study design and sampling method, diabetes-related factors including glycated hemoglobin (HbA1c) and duration of the disease, and neuropsychological methods used. Mean scores and SDs for the groups in neuropsychological tests were also extracted for effect size calculations. If a study reported standard errors of the mean (SEMs) instead of SDs, those were converted into SDs. For purposes of assessing the quality of the studies, additional information was extracted regarding the assessment of diabetes status, participant eligibility criteria and selection methods, confounding factors controlled for, and whether studies had used blind assessment of cognitive functions. Three studies did not report the mean or SD of the age of the diabetic group, and nine had missing neuropsychological data for the effect size calculations. The authors of these studies were contacted by means of e-mail to request the relevant information.
To evaluate the effects of diabetes on cognitive functions, neuropsychological tests were assigned to one of the following cognitive domains and subdomains according to Lezak, Howieson, Bigler, and Tranel (Reference Lezak, Howieson, Bigler and Tranel2012) and Gurd, Kischka, and Marshall (Reference Gurd, Kischka and Marshall2012): information processing speed (including psychomotor speed and motor speed), attention/concentration, working memory, executive functions (including verbal fluency and others), verbal memory (immediate and delayed), visual memory (immediate and delayed), language, and perception/construction (Supplementary Material 1). The executive functions (others) category included methods evaluating functions such as inhibition, mental flexibility, planning, and abstract reasoning. Tests that could not be classified were not included in the analyses. If a study included multiple publications based on the same participants, the neuropsychological data were used only once and the most detailed article was included. In case a study had compared more than two groups, only data for the diabetic and healthy control group were extracted. In longitudinal studies, only baseline data were used to prevent the bias with using the same population twice in the same cognitive measurements.
Statistical Analyses and Assessment of Risk of Bias
To determine the magnitude of cognitive performance difference between patient and control group, standardized mean difference (SMD) effect sizes and their 95% confidence intervals (CIs) were calculated for cognitive domains and subdomains. Effect sizes were also calculated for individual tests because the same cognitive tests were grouped together in the meta-analysis for cognitive domains and subdomains. SMDs were calculated as Hedges’s g by dividing the mean group difference in scores by pooled weighted SDs among participants (Borenstein, Hedges, Higgins, & Rothstein, Reference Borenstein, Hedges, Higgins and Rothstein2009). Hedges’s g was selected because it is an unbiased estimator and corrects the upward bias in effect size in case of small sample sizes.
Random effects models were used in all analyses due to the expected variability between study populations from sources other than sampling error; fixed effects models were, therefore, not appropriate (Field & Gillett, Reference Field and Gillett2010). A negative effect size indicates that patients performed worse than controls. The presence of true heterogeneity in effect sizes was assessed with Cochran’s Q, and a p-value of 0.10 was used to indicate statistical significance due to the reported low power of the test (Hardy & Thompson, Reference Hardy and Thompson1998). Heterogeneity was also quantified with I2, which represents the percentage of total variation in effect sizes that is caused by heterogeneity rather than chance (Higgins, Thompson, Deeks, & Altman, Reference Higgins, Thompson, Deeks and Altman2003).
The association between age and effect sizes was examined with meta-regression analyses. Random-effect meta-regression analyses were performed to all main cognitive domains and the mean ages of the patient groups were used as a moderator variable. Analyses were conducted using individual effect sizes from the studies as meta-regression was not possible for data in which single outcomes were grouped into categories. All data were analyzed using Comprehensive Meta-Analysis (CMA) software version 3 (Borenstein, Hedges, Higgins, & Rothstein, Reference Borenstein, Hedges, Higgins and Rothstein2014).
Publication bias or the presence of small study effects was assessed by examining funnel plots from the main cognitive domains with individual effect sizes from studies on the X-axis and inversed standard errors (SEs) on the Y-axis. Smaller studies appear at the bottom of the graph and because of higher SE, their effect estimates tend to show more variation. In contrast, larger studies appear at the top of the graph and because of less SE, they are usually more closely clustered around the mean effect size. In the absence of publication bias the graph will resemble a funnel, but in the presence of publication bias it will be asymmetric. This is because small studies with non-significant results are less likely to be published than large studies; thus, there will be more plots to the left bottom of the graph than to the right (Borenstein et al., Reference Borenstein, Hedges, Higgins and Rothstein2009).
Planned analyses of trim-and-fill, which shows adjusted effect size after taking account of possible publication bias (Duval & Tweedie, Reference Duval and Tweedie2000), were not conducted since many studies included multiple different assessment methods within the same cognitive domain, and analyses were not possible for data in which single outcomes were grouped into categories. Instead, funnel plot asymmetry was evaluated subjectively, and if significant outliers were detected, sensitivity analyses were made by repeating the effect size calculation after removing the outliers.
In addition to publication bias, risk of bias was evaluated at the study level by assessing the methodological quality of the studies. There is currently no consensus on the best method for assessing the methodological quality of the non-randomized studies in meta-analyses. This assessment was here done using the Newcastle-Ottawa Quality Assessment Scale for non-randomized studies (Stang, Reference Stang2010; Wells et al., Reference Wells, Shea, O’Connell, Peterson, Welch, Losos and Tugwell2014), with modifications based on Cochrane Collaboration’s recommendations to meet the specific requirements of this meta-analysis (Higgins & Green, Reference Higgins and Green2011). Factors evaluated included the adequate definition and representativeness of patients and controls, control for confounding effects of age and education, and blind assessment of cognitive functions.
Adequate definition of patients means that the presence of diabetes was confirmed by medical examination, from medical records, or based on the use of antidiabetic medication and not based on self-report. Patients were considered to be representative of the total population of patients if a study used an obviously representative group or consecutive series of patients (Wells et al., Reference Wells, Shea, O’Connell, Peterson, Welch, Losos and Tugwell2014). Adequate definition of controls means that a study explicitly stated that the controls had no history or symptoms of diabetes, or excluded the diagnosis based on medical examination. Controls were considered a representative sample if the study used community controls instead of hospital controls. Confounding effects of age and education had to be controlled using matching or statistical adjustment. Finally, blind assessment of cognitive performance means that the researcher making the assessment was not aware of diabetes status.
RESULTS
Study Selection and Characteristics
Figure 1 summarizes the study selection process. The initial search identified 2,040 articles, of which 120 remained for full-text screening. None of the authors responded to the e-mailed age requests, and two authors provided the missing data for effect size calculations. The latter were included in the analyses (Kinga & Anett, Reference Kinga and Anett2016; Nazaribadie et al., Reference Nazaribadie, Asgari, Amini, Ahmadpanah, Nazaribadie and Jamlipaghale2013, Reference Nazaribadie, Amini, Ahmadpanah, Asgari, Jamlipaghale and Nazaribadie2014). One of these authors had two articles based on the same study population, reporting results for different neuropsychological methods. These two articles were treated as one study (Nazaribadie et al., Reference Nazaribadie, Asgari, Amini, Ahmadpanah, Nazaribadie and Jamlipaghale2013, Reference Nazaribadie, Amini, Ahmadpanah, Asgari, Jamlipaghale and Nazaribadie2014). The exclusion process resulted in a total of 12 studies eligible for this meta-analysis.
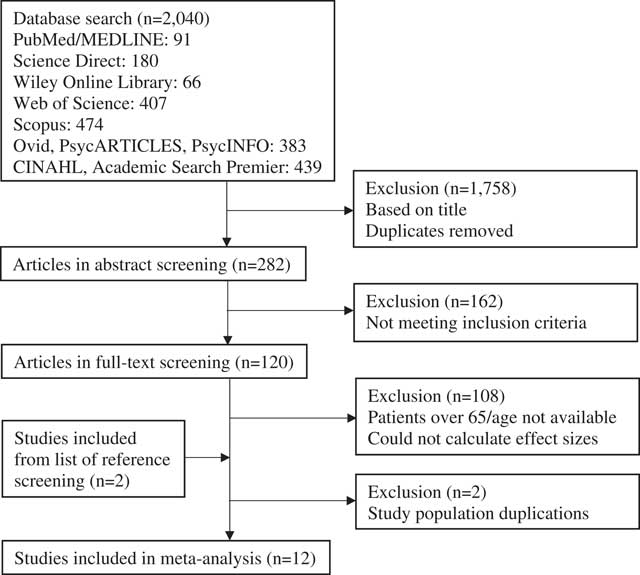
Fig. 1 Flow chart of article selection process.
Table 1 summarizes the characteristics of the selected studies. Overall, they comprised a total of 2,122 patients with diabetes and 12,287 healthy controls, with a mean age of 55.5 and 54.8 years, respectively. The mean years of education in these groups ranged from 9.9 to 18.3 in patients and from 9.9 to 18.9 years in controls. Most of the studies were cross-sectional case-control studies. Only half of the studies reported the mean duration of diabetes, which ranged from 6 to 8.5 years. Patients’ mean HbA1c (%) values ranged from 6.7 to 10.2 and were reported in eight studies. Three studies were conducted in the United States, two in India, and the other studies in Germany, the Netherlands, Spain, Romania, Bulgaria, Egypt, and Iran. SEMs had to be converted into SDs for effect size calculations in one study (Biessels, ter Braak, Erkelens, & Hijman, Reference Biessels, ter Braak, Erkelens and Hijman2001).
Table 1 Characteristics of the studies included in the meta-analysis

T2DM, type 2 diabetes patient group; C, control group; HbA1c, glycated hemoglobin; 1, prospective, population-based cohort; 2, cross-sectional, case-control; HS, high school level.
* Neuropsychological data were obtained from patients classified as patients with normal cognitive functioning (n = 20).
** Studies were combined due to the same study population.
a 37.9% high school, graduate equivalence degree, or vocational school; 27.2% college, graduate, or professional school.
b 42.3% high school, graduate equivalence degree, or vocational school, 38.6% college, graduate, or professional school.
The results for the assessment of the methodological quality of the studies are presented in Supplementary Material 2. Most of the studies confirmed the diagnosis of diabetes either based on a medical examination, from medical records, or based on the use of antidiabetic medication. Only three studies did not specify whether the diagnosis was objectively confirmed. Eight studies were considered to have a representative group of patients. Seven studies explicitly stated that the controls had no history or symptoms of diabetes, or excluded the diagnosis of diabetes based on a medical examination. Four studies did not state the origin of the control group, but the others used community controls. It should be noted that three studies included patients’ relatives as controls. Of these, only one excluded the possibility of diabetes in them with a medical examination. As for confounding factors, nine studies controlled for the effect of age and seven controlled for the effect of education either by matching or statistical adjustment. Only one study explicitly stated that cognitive functions were assessed by a researcher who was blind to diabetes status, and one study used computerized assessment.
Meta-analysis of Cognitive Functions
Patients performed worse than controls in overall information processing speed (g = −0.68). Figure 2a displays the results of the meta-analysis. The largest SMD was observed in the Grooved Pegboard Test (g = −0.81). Heterogeneity across the effect sizes was statistically significant (Q = 21.9; p = .081; I2 = 36.1%). There was no evidence of publication bias as the funnel plot appeared to be symmetrical (Supplementary Material 3). The subdomain psychomotor speed was assessed in nine studies (g = −0.68; 95% CI [−0.86, −0.5]; p <.001) and motor speed in three studies (g = −0.68; 95% CI [−1.00, −0.36]; p <.001).
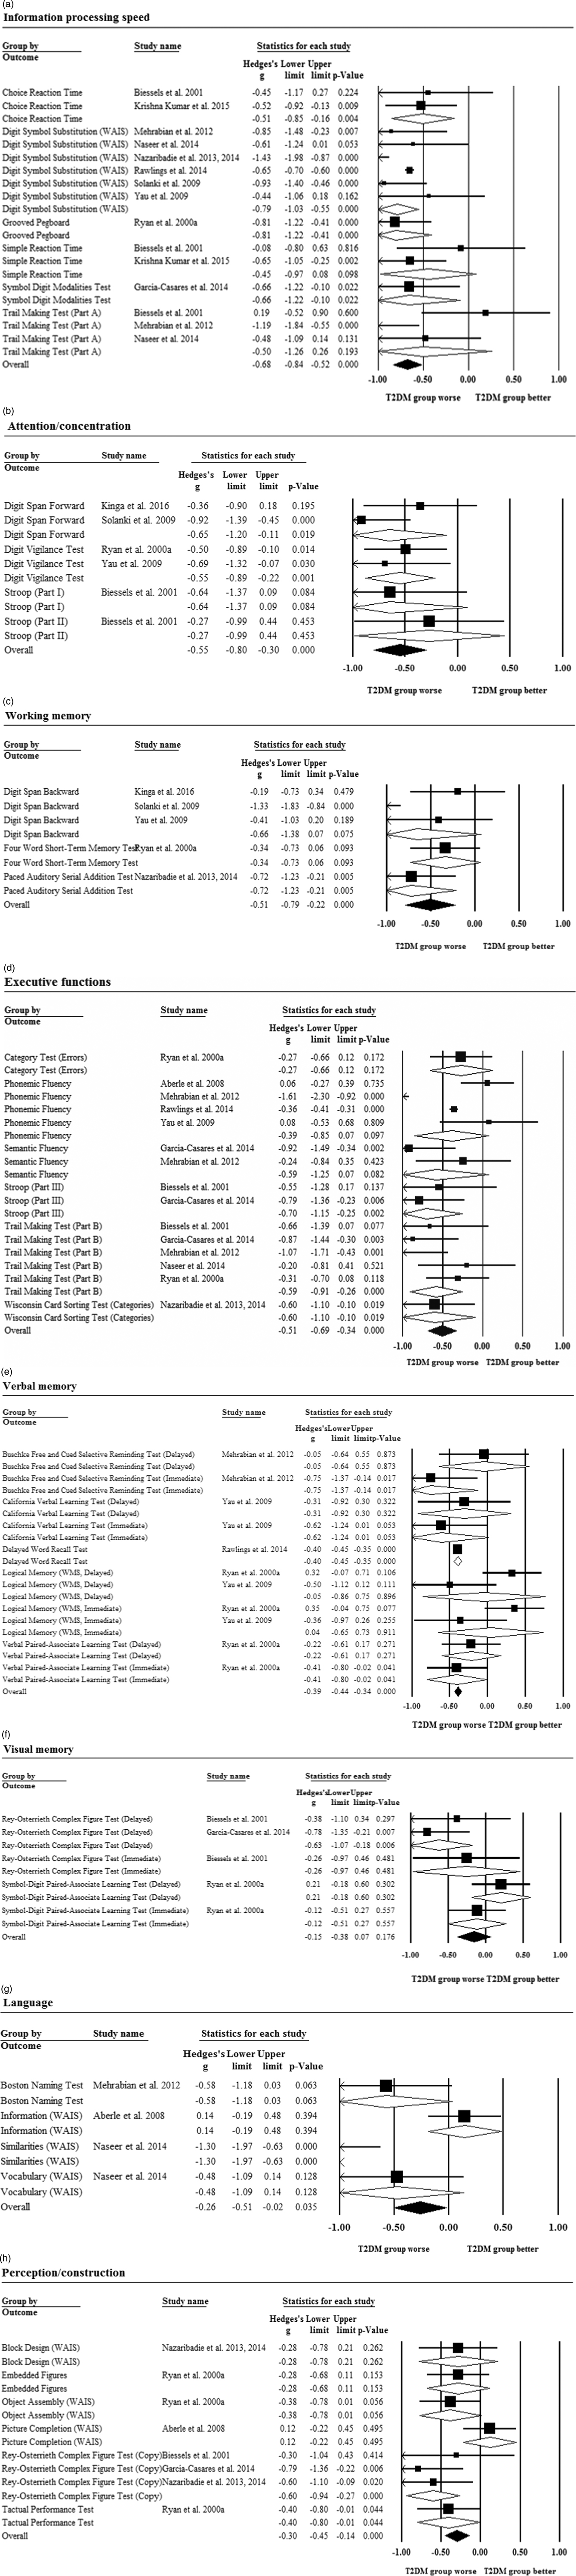
Fig. 2 Forest plot displaying standardized mean differences and 95% CIs for the (a) information processing speed, (b) attention/concentration, (c) working memory, (d) executive functions, (e) verbal memory, (f) visual memory, (g) language, and (h) perception/construction domain.
Attention/concentration was assessed in five studies and overall, patients performed worse than controls (g = −0.55; Figure 2b). The largest SMD was observed in the Digit Span Forward (g = −0.65). Heterogeneity across the effect sizes was not statistically significant (Q = 3.66; p = .599; I2 = 0.0%). There was no evidence of asymmetry in the funnel plot (Supplementary Material 3).
Working memory was assessed in five studies and overall, patients performed worse than controls (g = −0.51; Figure 2c). The largest SMD was found in the Paced Auditory Serial Addition Test (g = −0.72). Heterogeneity across the effect sizes was statistically significant (Q = 12.97; p = .011; I2 = 69.2%). There was no evidence of asymmetry in the funnel plot (Supplementary Material 3).
Patients performed worse than controls in overall executive functions (g = −0.51; Figure 2d). The largest SMD was found in part III of the Stroop Test (g = −0.70). Heterogeneity across the effect sizes was statistically significant (Q = 36.74; p = .001; I2 = 61.9%). There was no evidence of significant asymmetry in the funnel plot, but sensitivity analysis was carried out to explore the impact of one outlier with large effect size and SE (Supplementary Material 3). After the exclusion of the outlier, the effect size remained significant (g = −0.44; 95% CI [−0.61, −0.27]; p <.001). The subdomain of verbal fluency was assessed in five studies (g = −0.45; 95% CI [−0.83, −0.08]; p = .018) and others in six studies (g = −0.53; 95% CI [−0.73, −0.33]; p <.001).
Patients performed worse than controls in overall verbal memory (g = −0.39; Figure 2e). The largest SMD was found in the immediate recall of the Buschke Free and Cued Selective Reminding Test (g = −0.75). Heterogeneity across the effect sizes was statistically significant (Q = 30.2; p = .001; I2 = 66.9%). There was some evidence of asymmetry in the funnel plot, but no sensitivity analysis was performed because there were no significant outliers (Supplementary Material 3). Immediate verbal memory was assessed in three studies (g = −0.45; 95% CI [−0.72, −0.18]; p = .001) and delayed verbal memory in four studies (g = −0.39; 95% CI [−0.44, −0.34]; p <.001).
There was no difference in performance between the patient and control groups in overall visual memory (g = −0.15; Figure 2f). The largest SMD was found in the delayed recall of the Rey-Osterrieth Complex Figure Test (g = −0.63). Heterogeneity across the effect sizes was statistically significant (Q = 8.47; p = .076; I2 = 52.8%). There was no evidence of asymmetry in the funnel plot (Supplementary Material 3). Immediate visual memory was assessed in two studies (g = −0.15; 95% CI [−0.49, 0.19]; p = .394) and delayed visual memory in three studies (g = −0.16; 95% CI [−0.45, 0.14]; p = .29).
Language was assessed in three studies and overall, patients performed worse than controls (g = −0.26; Figure 2g). The largest SMD was found in the Similarities subtest of the Wechsler Adult Intelligence Scale (g = −1.30). Heterogeneity across the effect sizes was statistically significant (Q = 16.4; p = .001; I2 = 81.7%). There was no evidence of significant asymmetry in the funnel plot, but sensitivity analysis was undertaken to explore the impact of one outlier with a large effect and SE (Supplementary Material 3). After removal of the outlier, the effect size became non-significant (g = −0.105; 95% CI [−0.37, 0.16]; p = .436).
Perception/construction was assessed in five studies and overall, patients performed worse than controls (g = −0.30; Figure 2h). The largest SMD was found in the copy part of the Rey-Osterrieth Complex Figure Test (g = −0.60). Heterogeneity across the effect sizes was not statistically significant (Q = 10.69; p = .153; I2 = 34.5%). There was no evidence of significant asymmetry in the funnel plot (Supplementary Material 3).
Association Between Age and Effect Sizes
One study had exclusion criteria of age under 60 for patients and controls but did not report the exact mean age for the groups (Solanki, Dubey, & Munshi, Reference Solanki, Dubey and Munshi2009). This study could not be used in the meta-regression analyses. The results from the meta-regression are displayed in Table 2 and scatterplots in Figure 3. Age was significantly related to effect size in the domains of information processing speed (coefficient (0.056); p = .047), verbal memory (coefficient (−0.063); p = .019), visual memory (coefficient (−0.076); p = .011), and language (coefficient (0.105); p = .011). In contrast, age was not significantly related to effect size in the domains of attention/concentration (coefficient (−0.015); p = .638), working memory (coefficient (−0.013); p = .759), executive functions (coefficient (−0.002); p = .940), and perception/construction (coefficient (0.025); p = .144).
Table 2 Results from the regression of Hedges’s g on age in the main cognitive domains

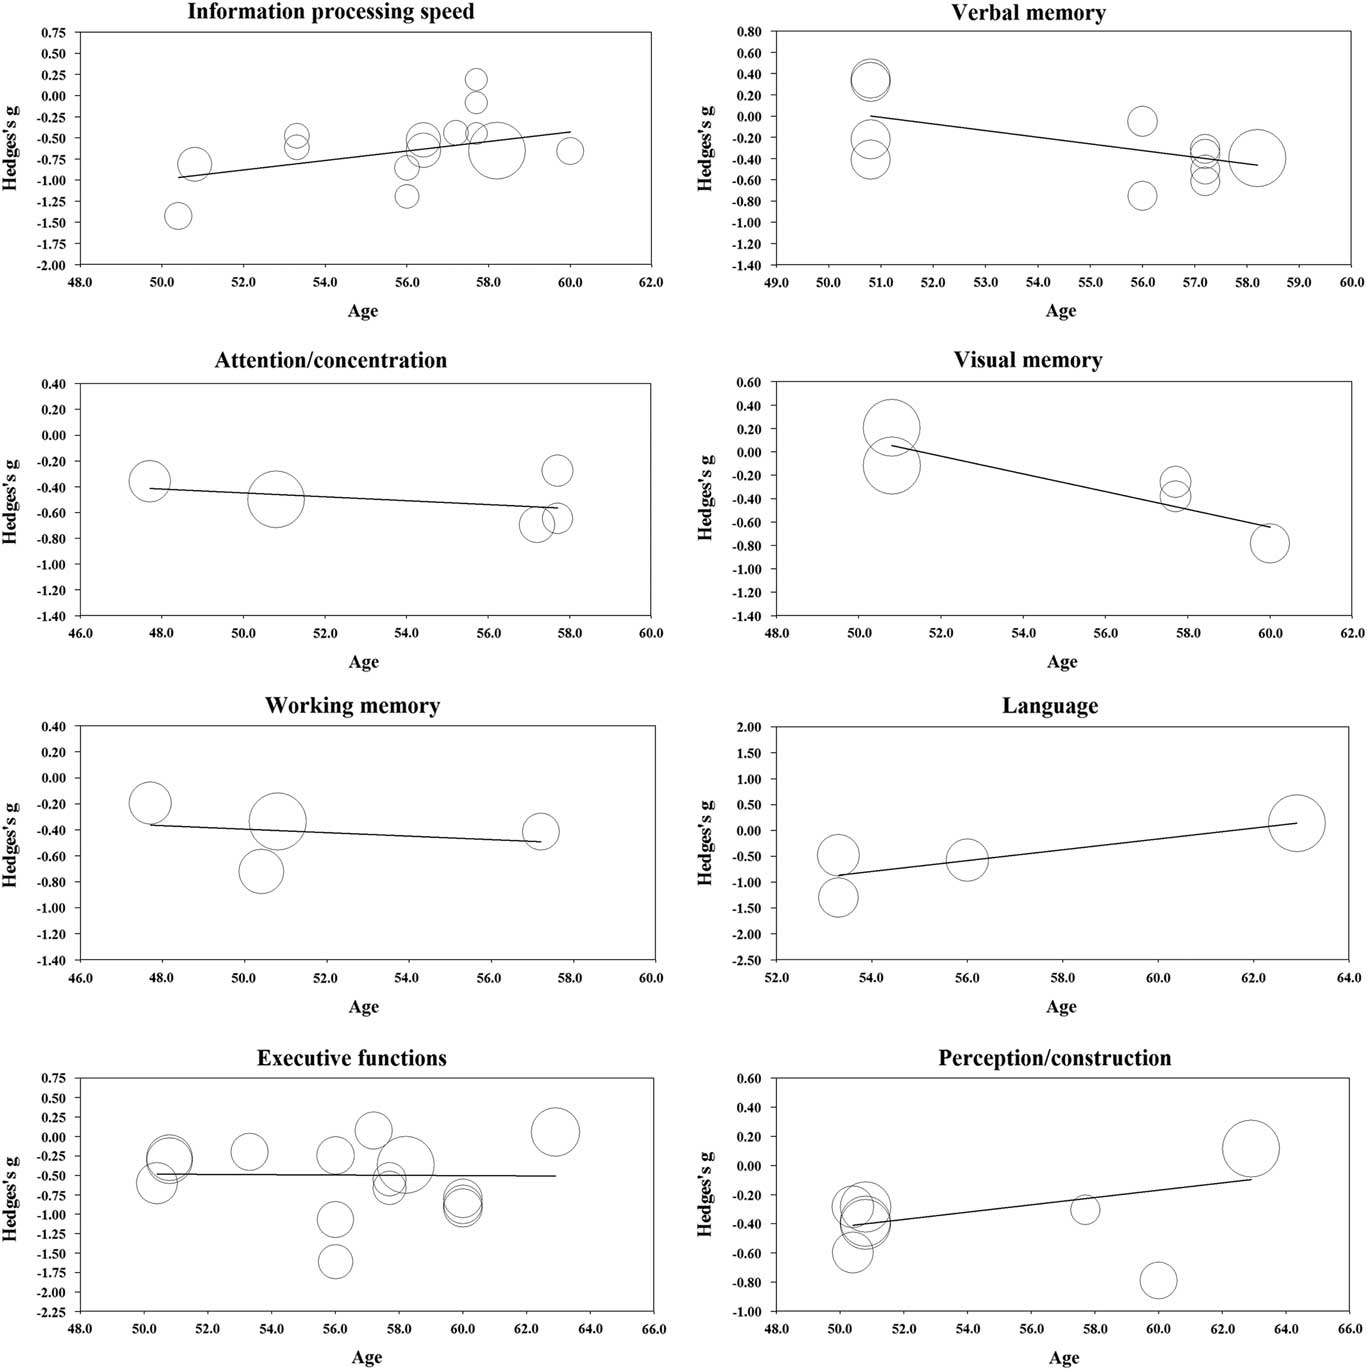
Fig. 3 Regression of Hedges’s g on age in the main cognitive domains.
DISCUSSION
This meta-analysis examined the cognitive functions of middle-aged type 2 diabetes patients compared to healthy controls. Patients tended to perform worse than controls in all the cognitive functions assessed. The largest standardized mean differences between the groups were found in the domains of psychomotor and motor speed, attention/concentration, executive functions, verbal fluency, and working memory. Significant differences were also found in immediate and delayed verbal memory, language, and perception/construction. The smallest and non-significant differences were found in immediate and delayed visual memory.
Among the main cognitive domains, information processing speed showed the largest effect size. Together with executive functions, information processing speed was also the most studied cognitive domain. The results are consistent with previous meta-analyses and reviews that mainly include older people, indicating that processing speed is one of the most affected cognitive domains in patients with type 2 diabetes (Awad et al., Reference Awad, Gagnon and Messier2004; Monette et al., Reference Monette, Baird and Jackson2014; Palta et al., Reference Palta, Schneider, Biessels, Touradji and Hill-Briggs2014; Reijmer et al., Reference Reijmer, van den Berg, Ruis, Kappelle and Biessels2010; van den Berg, Kloppenborg, Kessels, Kappelle, & Biessels, Reference van den Berg, Kloppenborg, Kessels, Kappelle and Biessels2009). However, the magnitude of effect found in this meta-analysis was greater than in previous meta-analyses. Age was significantly related to effect size in the information processing speed domain. Patients’ older age was related to smaller effect size, which suggests that patients performed worse than controls in information processing speed domain especially at younger ages. However, only 3% of the variance in effect sizes could be explained by age.
Similar effect sizes were observed in the subdomains of psychomotor and motor speed, although some studies have found that tasks with high motor demands are more affected than tasks requiring less motor functions, possibly because of the peripheral neuropathy associated with diabetes (Monette et al., Reference Monette, Baird and Jackson2014; Palta et al., Reference Palta, Schneider, Biessels, Touradji and Hill-Briggs2014). However, motor speed was assessed in only three studies, whereas psychomotor speed was included in nine of the studies reviewed in this meta-analysis. Furthermore, the strict categorization of methods into these domains is problematic as neuropsychological tests included in the psychomotor speed also involve motor requirements. Nonetheless, the results indicate that information processing speed may be one of the most notable and one of the earliest cognitive symptoms evident in patients with diabetes.
The observation of significant effect sizes in executive functions is also consistent with previous results (Palta et al., Reference Palta, Schneider, Biessels, Touradji and Hill-Briggs2014; Reijmer et al., Reference Reijmer, van den Berg, Ruis, Kappelle and Biessels2010; Sadanand et al., Reference Sadanand, Balachandar and Bharath2015; Vincent & Hall, Reference Vincent and Hall2015). A slightly larger effect size was found in the subdomain assessing inhibition, mental flexibility, planning and abstract reasoning than in the verbal fluency subdomain, although the findings were statistically significant in both cases. The magnitudes of the effect sizes in the domains of attention/concentration and working memory were quite large compared with the inconsistent and smaller effects found in previous research (Kodl & Seaquist, Reference Kodl and Seaquist2008; Monette et al., Reference Monette, Baird and Jackson2014; Palta et al., Reference Palta, Schneider, Biessels, Touradji and Hill-Briggs2014; Sadanand et al., Reference Sadanand, Balachandar and Bharath2015; Vincent & Hall, Reference Vincent and Hall2015). However, earlier studies have used widely differing categorization systems in these domains, which complicates the interpretation of these results.
Taking a broader perspective, the significant effects seen in the domains of attention/concentration and working memory can be interpreted to be consistent with the result on patients’ poorer performance in executive functions. This is because all these three domains are highly interrelated and attention and working memory can also be thought to have a role in executive functions (Alvarez & Emory, Reference Alvarez and Emory2006; Diamond, Reference Diamond2013). Patients’ significantly poorer performance in executive functions also has great clinical importance since the treatment of diabetes requires many skills related to executive functions such as maintaining a healthy diet, exercising, setting and achieving treatment goals, and adherence to medication (Diamond, Reference Diamond2013; Tomlin & Sinclair, Reference Tomlin and Sinclair2016). Significant association between age and effect size was not found in the domains of executive functions, working memory and attention/concentration.
The significant effect sizes seen in verbal memory contradict the findings of Ryan and Geckle (Reference Ryan and Geckle2000b), who suggest that memory deficits may not be evident in middle-aged patients but are restricted to older patients because of the interaction between normal ageing processes and diabetes-related metabolic changes. On the other hand, this claim was supported by results from the meta-regression analyses, in which age was significantly related to effect size in both verbal and visual memory domain. Patients’ older age was related to larger effect size; thus, patients performed worse than controls in the memory domains especially at older ages. However, as the funnel plot showed some evidence of possible publication bias in the verbal memory and as there was only a limited number of studies in memory domains, the results of this meta-analysis should be interpreted with caution. In addition, effect sizes in visual memory were not statistically significant. This is consistent with studies suggesting that in diabetes, verbal memory is affected to a greater extent than visual memory (Awad et al., Reference Awad, Gagnon and Messier2004; Reijmer et al., Reference Reijmer, van den Berg, Ruis, Kappelle and Biessels2010). However, this view is not consistent with the findings of all studies (Monette et al., Reference Monette, Baird and Jackson2014; Palta et al., Reference Palta, Schneider, Biessels, Touradji and Hill-Briggs2014), and only three studies had assessed the visual memory domain in this meta-analysis. Indeed, more research is needed into the early effects of diabetes on memory functions.
In the language domain, the performance of patients was unexpectedly significantly poorer than the performance of controls. Age was significantly related to effect size in the language domain with patients performing worse than controls at younger ages. However, these findings must be interpreted with caution as there were only three relevant studies in the meta-analysis, and after sensitivity analyses the effect size became non-significant. Furthermore, previous studies have shown that language abilities are relatively unaffected (Awad et al., Reference Awad, Gagnon and Messier2004; Reijmer et al., Reference Reijmer, van den Berg, Ruis, Kappelle and Biessels2010).
Significantly poorer patient performance was also seen in the perception/construction domain. This was again an unexpected result since it seems that these functions are not affected in older people (Awad et al., Reference Awad, Gagnon and Messier2004; Monette et al., Reference Monette, Baird and Jackson2014; Reijmer et al., Reference Reijmer, van den Berg, Ruis, Kappelle and Biessels2010). One possible explanation for this conflicting result could be that, as visuoconstructional skills have been found to decline with age (Harada, Love, & Triebel, Reference Harada, Love and Triebel2013), the difference in this domain between patients and controls is greater in middle-aged groups than in older people. On the other hand, the methods applied in the perception/construction domain also require the use of several other cognitive skills, which may result in an exaggerated effect size in this domain. For example, the copy part of the Rey-Osterrieth Complex Figure Test, where the largest effect size was found, is also related to executive functions such as planning and organizational processes (Somerville, Tremont, & Stern, Reference Somerville, Tremont and Stern2000). More research is needed into the associations between type 2 diabetes and perceptual and constructional processes. Significant association between age and effect size was not found in the perception/construction domain.
Overall, patients’ performance was unexpectedly poorer than the performance of controls in all the cognitive functions assessed. However, several factors must be considered when interpreting the results. Monette et al. (Reference Monette, Baird and Jackson2014) found some evidence that cross-sectional and case-control studies show larger effect sizes than population-based and longitudinal studies. Most of the studies included in this meta-analysis were cross-sectional case-control studies; therefore, it is possible that the differences in performance between the groups is overestimated. The results of the methodological assessment also showed that four studies could not be regarded as having a representative sample of patients, and only two studies had used blind assessment of cognitive functions. These results increase the risk for selection and detection bias, respectively. Furthermore, some studies had not controlled for the effects of age and education on cognitive performance, which may result in an exaggerated estimation of the impact of diabetes on cognitive functions.
On the other hand, it is possible that the effects of diabetes on cognitive functions are more apparent at a younger age. For example, some studies have found stronger associations between diabetes and cognitive functions in younger than in older people, possibly because ageing and increased morbidity also impairs cognitive functions in aged nondiabetic controls (van Eersel et al., Reference van Eersel, Joosten, Gansevoort, Dullaart, Slaets and Izaks2013; Winkler et al., Reference Winkler, Dlugaj, Weimar, Jöckel, Erbel, Dragano and Moebus2014). This is consistent with results from the meta-regression analyses for information processing speed, in which greater effect sizes were associated with younger age. The view is also consistent with findings that type 2 diabetes is not associated with an accelerated rate of cognitive decline, but cognitive decrement may have onset within a more limited timeframe, possibly in the early phase of the disease (McGrimmon et al., Reference McGrimmon, Ryan and Frier2012). However, there are also conflicting views (Reijmer et al., Reference Reijmer, van den Berg, Ruis, Kappelle and Biessels2010).
The strength of this study is that it is the first meta-analysis of cognitive functions specifically in middle-aged patients with type 2 diabetes, and it, therefore, provides a useful basis for future studies in this area. In addition, the analyses reviewed comprised a wide range of cognitive abilities, and the neuropsychological methods used were classified based on the widely adopted categorization of Lezak et al. (Reference Lezak, Howieson, Bigler and Tranel2012) and Gurd et al. (Reference Gurd, Kischka and Marshall2012).
This meta-analysis also has several limitations. First, it included only a limited number of studies, making generalization difficult. Generalization is also hampered by the fact that the studies were conducted in different countries and included people from different cultural backgrounds. On the other hand, this can be seen also as a strength of this study, as including studies from several countries adds to the external validity of this meta-analysis. Second, the classification of neuropsychological methods into specific cognitive domains is problematic since most of these domains require several cognitive skills. This also complicates the comparison of the results with previous meta-analyses, since different authors have used different classification systems. This problem with categorization can also explain some of the unexplained heterogeneity found in effect sizes. Third, this meta-analysis did not take into account the impact of comorbidities on cognitive performance. This is important since patients with diabetes usually have many comorbidities, such as hypertension, dyslipidemia, obesity, and depressive symptoms, which are also known to impact cognitive functions (Feinkohl, Price, Strachan, & Frier, Reference Feinkohl, Price, Strachan and Frier2015; Reijmer et al., Reference Reijmer, van den Berg, Ruis, Kappelle and Biessels2010; van den Berg et al., Reference van den Berg, Kloppenborg, Kessels, Kappelle and Biessels2009). Fourth, the results cannot be directly compared to older people (>65 years), as the studies did not report cognitive test scores stratified by both diabetes status and age.
The results of this study have great importance from a societal point of view. As the prevalence of diabetes is rapidly growing and increasing in younger age groups worldwide (International Diabetes Federation, 2015), the findings indicate that we can expect to see an increased prevalence of cognitive deficits in the working age population, too. Therefore, more research is needed to shed light on cognitive symptoms at the early stages of type 2 diabetes and to confirm these results. It is important that future studies in this field more carefully report all their results and particularly all the relevant demographic data for both the patient and the control groups, because this would eliminate the problems seen in this meta-analysis due to unreported data and also make it easier to assess the quality of the studies.
Future studies should also use consistent categorizations of neuropsychological methods, which would facilitate reliable comparison of the results. In addition, future studies should explore the underlying causes and risk factors for early cognitive decrement in diabetes. This could improve the detection of the symptoms in the early phase and help prevent later cognitive deficits. The early detection of cognitive decrement could also be improved by developing effective strategies for screening cognitive decrement in healthcare systems.
Finally, future studies should explore the manifestation of cognitive symptoms at different stages of diabetes and at different ages. As seen in this study, it is possible that the association between diabetes and cognitive decrement can vary according to age in some cognitive domains. Some decrements, such as slowed information processing speed, may already be evident at younger ages and in the early phase of the disease, whereas others, such as verbal memory decrement, may be more evident later as a result of the interaction between normal ageing and diabetes-related metabolic processes.
In conclusion, the results of this study suggest that type 2 diabetes-related cognitive symptoms are not restricted to older age, but can be evident even in middle age in several cognitive functions, including information processing speed, executive functions, attention and concentration, working memory, and perceptional and constructional skills. In contrast, visual memory seems to be relatively unaffected in diabetes patients. Future studies are needed to verify these results and to shed more light on early cognitive symptoms associated with diabetes. Healthcare systems should pay more attention to the early screening and treatment of diabetes-related cognitive symptoms, and recognize cognitive decrement as a possible complication of diabetes.
ACKNOWLEDGMENTS
This study was partly supported by the Competitive State Research Financing of the Expert Responsibility area of Tampere University Hospital.
SUPPLEMENTARY MATERIAL
To view supplementary material for this article, please visit https://doi.org/10.1017/S1355617718001042