


INTRODUCTION
Stemming the increase in atmospheric carbon dioxide and loss of tropical biodiversity are both global challenges. Major international efforts are made, but much more needs to be done (McCarthy et al. Reference McCarthy, Donald, Scharlemann, Buchanan, Balmford, Green, Bennun, Burgess, Fishpool and Garnett2012; Fearnside Reference Fearnside2013). The projected annual cost of reaching 2050 carbon emission targets ranges from US$350 billion to several trillion (Loftus et al. Reference Loftus, Cohen, Long and Jenkins2015). The total yearly expenditure on global biodiversity conservation between 2001–2008 was approximately US$21.5 billion (Waldron et al. Reference Waldron, Mooers, Miller, Nibbelink, Redding, Kuhn, Roberts and Gittleman2013), which is less than a third of the US$76.1 billion (McCarthy et al. Reference McCarthy, Donald, Scharlemann, Buchanan, Balmford, Green, Bennun, Burgess, Fishpool and Garnett2012) or perhaps more (Sheil et al. Reference Sheil, Meijaard, Angelsen, Sayer and Vanclay2013), needed to slow extinctions and achieve United Nations biodiversity targets. Given the shortfall, available resources should be used effectively.
Protecting natural areas can maintain carbon stocks and biodiversity values simultaneously. Such synergies mean that the limited funds available for carbon sequestration and nature conservation could, if used wisely, achieve more of both (Venter et al. Reference Venter, Laurance, Iwamura, Wilson, Fuller and Possingham2009 a; Gardner et al. Reference Gardner, Burgess, Aguilar-Amuchastegui, Barlow, Berenguer, Clements, Danielsen, Ferreira, Foden and Kapos2012; Phelps et al. Reference Phelps, Webb and Adams2012). However, few studies have explored the complete carbon benefits arising from protecting natural habitats (forests and non-forests) and how more complete carbon accounting may increase resources for biological conservation. Reasons likely include limited awareness and appreciation of the opportunities.
Here, we first identify the critical role of habitat protection in addressing both atmospheric carbon emissions and biodiversity conservation. Next we highlight the significance of soil carbon, its spatial variation and its vulnerability. We then consider the distribution of threatened biodiversity. Next we show that habitat categories with high soil carbon stocks are associated with species-rich regions and also with many threatened species. We then identify various uncertainties and knowledge gaps. Despite many unknowns, our results highlight important soil carbon-biodiversity relationships and indicate that incentives to retain vulnerable soil carbon could benefit biodiversity conservation.
Conversion and degradation
Loss and degradation of forests and other natural habitats threaten biodiversity (Newbold et al. Reference Newbold, Hudson, Hill, Contu, Lysenko, Senior, Börger, Bennett, Choimes, Collen, Day, De Palma, Diaz, Echeverria-Londono, Edgar, Feldman, Garon, Harrison, Alhusseini, Ingram, Itescu, Kattge, Kemp, Kirkpatrick, Kleyer, Correia, Martin, Meiri, Novosolov, Pan, Phillips, Purves, Robinson, Simpson, Tuck, Weiher, White, Ewers, Mace, Scharlemann and Purvis2015) and also release about 0.9 Mg (C) to the atmosphere each year (GCP 2014). Efforts to reduce atmospheric carbon have generated various initiatives to lower emissions from land cover change. These initiatives include activities under nationally appropriate mitigation action (NAMA) and governmental as well as market-led projects for reducing emissions from deforestation and forest degradation (REDD). Although aspects are debated, many such projects aim to incentivize the protection of tree cover and associated carbon stocks. REDD in particular has been the subject of many pilot projects, evaluations and forecasts (Agrawal et al. Reference Agrawal, Nepstad and Chhatre2011; Angelsen et al. Reference Angelsen, Brockhaus, Sunderlin and Verchot2012). Substantial opportunities appear possible; one forecast suggests that REDD might generate as much as US$32.1 billion annually by 2020 (Streck & Parker Reference Streck, Parker, Angelsen, Brockhaus, Sunderlin and Verchot2012).
Much has been written about how efforts to reduce carbon emissions could influence biodiversity conservation (Venter et al. Reference Venter, Laurance, Iwamura, Wilson, Fuller and Possingham2009 a; Gardner et al. Reference Gardner, Burgess, Aguilar-Amuchastegui, Barlow, Berenguer, Clements, Danielsen, Ferreira, Foden and Kapos2012; Phelps et al. Reference Phelps, Webb and Adams2012; Armenteras et al. Reference Armenteras, Rodríguez and Retana2015; Beaudrot et al. in press). Potential synergies offer an attractive basis for action. Governments, NGOs and businesses like to ‘double count’ their contributions to the global environment. In some cases funds spent on biodiversity conservation may even result in greater carbon storage than equal spending on carbon payments (Busch Reference Busch2013). Several global initiatives seek to reduce atmospheric carbon emissions in ways that also contribute to biological and environmental conservation, for example the Climate, Community & Biodiversity Alliance initiative and REDD+ Social & Environmental Standards initiative (CCBA 2015; REDD+ SES 2015).
Before these schemes can operate on a large scale, various issues must be resolved. These include defining baselines and reference-level estimates of carbon stocks, selecting the best methods for monitoring, reporting and verification of carbon stocks, and determining who will get paid how much, by whom and for what (Agrawal et al. Reference Agrawal, Nepstad and Chhatre2011; Batjes Reference Batjes2011; Angelsen et al. Reference Angelsen, Brockhaus, Sunderlin and Verchot2012; Gardner et al. Reference Gardner, Burgess, Aguilar-Amuchastegui, Barlow, Berenguer, Clements, Danielsen, Ferreira, Foden and Kapos2012; Smith et al. Reference Smith, Davies, Ogle, Zanchi, Bellarby, Bird, Boddey, McNamara, Powlson, Cowie, van Noordwijk, Davis, Richter, Kryzanowski, van Wijk, Stuart, Kirton, Eggar, Newton-Cross, Adhya and Braimoh2012; van Noordwijk et al. Reference van Noordwijk, Agus, Dewi and Purnomo2014). Thus, while the ultimate format is uncertain, the search for cost-effective ways to reduce atmospheric carbon emissions looks likely to continue.
SOIL CARBON
Stocks
Carbon assessments and budgets have, by convention, recognized five pools of carbon: above-ground biomass; below-ground biomass; deadwood; litter; and soil organic matter (Eggleston et al. Reference Eggleston, Buendia, Miwa, Ngara and Tanabe2006). Efforts are focused on assessments of above-ground biomass (Clark & Kellner Reference Clark and Kellner2012; Thomas & Martin Reference Thomas and Martin2012; Mitchard et al. Reference Mitchard, Saatchi, Baccini, Asner, Goetz, Harris and Brown2013; Asner et al. Reference Asner, Knapp, Martin, Tupayachi, Anderson, Mascaro, Sinca, Chadwick, Higgins, Farfan and Llactayo2014) but this is a streetlight effect: a case of looking at the most visible carbon rather than at where the largest stocks occur, which is in the soil.
Total soil carbon is greater than that found in global vegetation and the atmosphere combined (Houghton Reference Houghton2007). Published estimates are 504–3000 Gt with a median of 1460.5 Gt; the uncertainty itself is greater than the total carbon (816 Gt) in the atmosphere (Scharlemann et al. Reference Scharlemann, Tanner, Hiederer and Kapos2014). Considerable variation in local carbon stocks adds to the complexity in generating global estimates for total soil carbon. For example, wetlands cover about 3% of the global land surface but likely possess between one-quarter and one-third of the total organic soil carbon (Gumbricht Reference Gumbricht2012). The different soil depths considered by various assessments further complicate the picture.
While soil carbon content typically declines with depth, the total stocks in deep soil are considerable. Soil profiles typically indicate more than half as much carbon again if extended from 1 to 3 m deep: namely 56% is one global summary's average, with 86% for deserts, 84% for tropical deciduous forests and 74% for tropical grassland/savannah (Jobbágy & Jackson Reference Jobbágy and Jackson2000). The cumulative global totals are 615 Gt C in the top 0.2 m, 1502 Gt to 1 m and 2344 Gt C to 3 m (Jobbágy & Jackson Reference Jobbágy and Jackson2000). Deeper profiles would locate additional carbon. Many global estimates only consider soil to 1 m, while current measurement standards only consider the top 0.3 m.
Where above- and below-ground biomasses have been compared in natural terrestrial systems, soils tend to possess the greater stocks when measured to sufficient depth in savannahs, forests and wetlands (Chen et al. Reference Chen, Hutley and Eamus2003; Murdiyarso et al. Reference Murdiyarso, Donato, Kauffman, Kurnianto, Stidham and Kanninen2009; Silva et al. Reference Silva, Hoffmann, Rossatto, Haridasan, Franco and Horwath2013 a). For example, in central Brazil's tropical wooded savannahs, and in tropical forests in riparian zones within this biome, mean soil carbon stocks (to 1 m depth) are markedly greater (c. 150 to more than 1500 t C ha−1) than the associated above-ground biomass (c. 5 to 100 t C ha−1; Silva et al. Reference Silva, Hoffmann, Rossatto, Haridasan, Franco and Horwath2013 a). This is observed in natural forest-savanna gradients, where plant diversity modulates the effect of climate and disturbance regime on ecosystem C input to soils (Franco et al. Reference Franco, Rossatto, de Carvalho Ramos Silva and da Silva Ferreira2014; Silva Reference Silva2014; Paiva et al. Reference Paiva, Silva and Haridasan2015), as well as in degraded soils undergoing restoration, where a direct link between diversity of colonizing species and C accumulation has been recently described (Silva et al. Reference Silva, Doane, Corrêa, Valverde, Pereira and Horwath2015). Similarly in riverine forests, peat forests and mangroves, the soils are especially carbon-rich. For example, in mangroves in Tanjung Puting National Park (Central Kalimantan) mean above-ground and soil carbon values were respectively 142.9 and 1220.2 t C ha−1 (Murdiyarso et al. Reference Murdiyarso, Donato, Kauffman, Kurnianto, Stidham and Kanninen2009).
Spatial variation
Soil carbon stocks vary across landscapes, influenced by many factors (Gleixner Reference Gleixner2013) and the underlying relationships are complex to assess and extrapolate (Scharlemann et al. Reference Scharlemann, Tanner, Hiederer and Kapos2014). For example, no relationship was detected between field observations and one interpolated international soil carbon map (Ladd et al. Reference Ladd, Laffan, Amelung, Peri, Silva, Gervassi, Bonser, Navall and Sheil2013). Nevertheless, predictable relations can be used to improve surveys and maps of soil carbon stocks; at continental scales, relationships between climate, plant productivity and soil carbon are statistically robust but noisy (Ladd et al. Reference Ladd, Laffan, Amelung, Peri, Silva, Gervassi, Bonser, Navall and Sheil2013). Within a given biome, geology, topography and drainage are important (Webster et al. Reference Webster, Creed, Beall and Bourbonnière2011) and within most landscapes soil carbon increases when moving from dry upland sites to wet alluvial sites (van Noordwijk et al. Reference van Noordwijk, Woomer, Cerri, Bernoux and Nugroho1997; Silva et al. Reference Silva, Sternberg, Haridasan, Hoffmann, Miralles-Wilhelm and Franco2008; Webster et al. Reference Webster, Creed, Beall and Bourbonnière2011).
Vulnerability
Conversion of old-growth forest to agriculture is the primary threat to tropical biodiversity and above-ground biomass (Ghazoul & Sheil Reference Ghazoul and Sheil2010). Conversion is also a threat to the carbon stored in soils.
Soil carbon stocks represent a dynamic balance between inputs and outputs (Gleixner Reference Gleixner2013). Carbon flows from soils to the atmosphere are several times larger than the emissions from fossil-fuel combustion and small imbalances could have major consequences (Stockmann et al. Reference Stockmann, Adams, Crawford, Field, Henakaarchchi, Jenkins, Minasny, McBratney, de Courcelles, Singh and Wheeler2013). Soil carbon can decline substantially when forest is cleared (Tiessen et al. Reference Tiessen, Cuevas and Chacon1994). Measured values vary (Smith et al. Reference Smith, Davies, Ogle, Zanchi, Bellarby, Bird, Boddey, McNamara, Powlson, Cowie, van Noordwijk, Davis, Richter, Kryzanowski, van Wijk, Stuart, Kirton, Eggar, Newton-Cross, Adhya and Braimoh2012) but typically 25–30% of soil carbon is lost in the first two to three decades after tropical forests are converted to cropland (Don et al. Reference Don, Schumacher and Freibauer2011). Much of the carbon in wetland soils ultimately decomposes when such soils are drained (Hooijer et al. Reference Hooijer, Page, Jauhiainen, Lee, Lu, Idris and Anshari2012), and carbon-rich sediments are often dispersed by currents when riverine forests or mangroves are damaged or removed (Murdiyarso et al. Reference Murdiyarso, Donato, Kauffman, Kurnianto, Stidham and Kanninen2009).
When these losses are recognized in carbon accounting, the values used are often not measured but rather based on generic values, for example, in IPCC carbon accounting methods (Eggleston et al. Reference Eggleston, Buendia, Miwa, Ngara and Tanabe2006; Batjes Reference Batjes2011). The actual changes in soil carbon stocks when natural land is converted to cultivation or otherwise modified depend on the site and the management practices. Many of the world's cultivated soils have lost most of their original carbon (often 30–40 t C ha−1), with greater percentage losses through erosion from the most carbon-rich tropical soils (Lal Reference Lal2004). Erosion associated with agriculture may remove an additional 0.404 (±0.202 SE) Gt of global soil carbon annually (Doetterl et al. Reference Doetterl, Van Oost and Six2012). The fate of this carbon remains uncertain although more than 30% likely returns to the atmosphere (Regnier et al. Reference Regnier, Friedlingstein, Ciais, Mackenzie, Gruber, Janssens, Laruelle, Lauerwald, Luyssaert, Andersson, Arndt, Arnosti, Borges, Dale, Gallego-Sala, Godderis, Goossens, Hartmann, Heinze, Ilyina, Joos, LaRowe, Leifeld, Meysman, Munhoven, Raymond, Spahni, Suntharalingam and Thullner2013). Selective timber harvesting typically has little impact on soil carbon (Berenguer et al. Reference Berenguer, Ferreira, Gardner, Aragão, De Camargo, Cerri, Durigan, Oliveira, Vieira and Barlow2014). In some cases, conversion to pasture leads to little apparent change (Twongyirwe et al. Reference Twongyirwe, Sheil, Majaliwa, Ebanyat, Tenywa, van Heist and Kumar2013), or even perhaps an ultimate increase (after an initial decline) as observed in Amazonia (Fujisaki et al. Reference Fujisaki, Perrin, Desjardins, Bernoux, Balbino and Brossard2015). Agroforestry proponents highlight the benefits of mixed cropping for soil carbon (Young Reference Young1997). Nonetheless, soil carbon loss is the typical outcome when land is converted to agriculture.
We know little about soil processes at depths greater than a few tens of centimetres but we know that deep soil organic carbon is dynamic (Balesdent et al. Reference Balesdent, Basile-Doelsch, Chadoeuf, Cornu, Derrien, Fekiacova and Hatté2014) and can be influenced by land use change (Fontaine et al. Reference Fontaine, Barot, Barré, Bdioui, Mary and Rumpel2007; Xiang et al. Reference Xiang, Doyle, Holden and Schimel2008). We have almost no relevant data from the tropics. Nonetheless, some soil researchers are advocating increased attention to changes in deep soil carbon due to the considerable changes sometimes observed with land use change (Boddey et al. Reference Boddey, Jantalia, Conceicao, Zanatta, Bayer, Mielniczuk, Dieckow, Dos Santos, Denardin, Aita and Giacomini2010; Shi et al. Reference Shi, Zhang, Zhang, Yu and Ding2013).
LOCATING THREATENED BIODIVERSITY
Species diversity is positively correlated with moisture availability at multiple scales. Moving along a gradient from desert to forest as well as within habitats, wetter sites usually have more species (Hawkins et al. Reference Hawkins, Field, Cornell, Currie, Guégan, Kaufman, Kerr, Mittelbach, Oberdorff, O'Brien and Porter2003). Various explanations exist, for example, wetter areas are more likely to maintain species with finer niches and strong niche conservatism, maintain the productivity needed to support higher species densities, and serve as (or are near to) refugia during drought and past episodes of climate change (Hawkins et al. Reference Hawkins, Field, Cornell, Currie, Guégan, Kaufman, Kerr, Mittelbach, Oberdorff, O'Brien and Porter2003; Ghazoul & Sheil Reference Ghazoul and Sheil2010; Romdal et al. Reference Romdal, Araújo and Rahbek2013). Dead biomass can play a significant role in nutrient flows, community stability, trophic specializations and resulting species diversity, though most observational studies have focused on aquatic food webs (Hairston Jr and Hairston Sr Reference Hairston and Hairston1993; Moore et al. Reference Moore, Berlow, Coleman, Ruiter, Dong, Hastings, Johnson, McCann, Melville, Morin and Nadelhoffer2004). Various theories also link diversity to productivity (Cardinale et al. Reference Cardinale, Hillebrand, Harpole, Gross and Ptacnik2009; Willig Reference Willig2011; Tilman et al. Reference Tilman, Reich and Isbell2012).
Lowland alluvial soils, comprising parent materials transported to their location by water, often show high levels of nutrient accumulation and possess intrinsically higher moisture-holding capacity due to their texture and high organic matter content (van Noordwijk et al. Reference van Noordwijk, Woomer, Cerri, Bernoux and Nugroho1997). These areas are thus attractive for agriculture and can support dense human populations. Intact ecosystems in wet habitats are thus comparatively rare; species that persist are often severely affected by habitat fragmentation and face multiple additional challenges from human proximity (e.g. exploitation, pollution). Many protected area networks are dominated by land with low agricultural value. Based on these considerations, we hypothesize that more species of conservation significance are associated with wet lowland habitats than with drier ones, and are also at greater risk of endangerment and extinction.
The criteria and measures allowing for an objective exploration of this hypothesis are debatable. For example, biologists and soil scientists would distinguish wet (but well-drained) carbon- and species-rich lowlands from water-logged wetlands, where a few specialized plant and animal species dominate some anoxic environments (Junk et al. Reference Junk, Brown, Campbell, Finlayson, Gopal, Ramberg and Warner2006; Ghazoul & Sheil Reference Ghazoul and Sheil2010). But fractal-like drainage patterns make such distinctions difficult to apply consistently for broad-scale assessments. Freshwater ecosystems harbour many specialized and restricted species (Naiman et al. Reference Naiman, Decamps and Pollock1993), so while only 0.8% of the world's surface is covered by freshwater, these water bodies host approximately one-third of all vertebrate species (Dudgeon et al. Reference Dudgeon, Arthington, Gessner, Kawabata, Knowler, Lévêque, Naiman, Prieur-Richard, Soto, Stiassny and Sullivan2006). Therefore, protecting wet areas in general brings benefits, even when specific locations may show a reduced number of species. This simplifies the area selection process for combined soil carbon and rare species conservation. In this context, we propose that including wetlands within large landscapes generally raises conservation values, especially when vulnerable aquatic species are included. Wetlands may only represent a small portion of total land area, but they are highly productive and thus a strong continuous sink for atmospheric carbon (Mitsch et al. Reference Mitsch, Bernal, Nahlik, Mander, Zhang, Anderson, Jørgensen and Brix2013). Wetlands are also subject to the same threats from human impacts and proximity as many other lowland systems.
CASE STUDIES
Introduction and approach
Our first evaluation considered the Virunga Landscape in Central Africa. This is the highlands area of the Bwindi Impenetrable National Park of Uganda and Virunga Volcanoes of Rwanda, Congo and Uganda that provides the sole habitat of the less than 1000 remaining Mountain gorillas (Gorilla beringei beringei; Plumptre et al. Reference Plumptre, Kujirakwinja, Treves, Owiunji and Rainer2007). Wetlands and wet valley bottom habitats cover around one-quarter of the overall landscape. We repeated this evaluation of habitat preference and conservation status for a contrasting tropical landscape in South America's Cerrado biome of the Federal District of Brazil. Alluvial gallery forests occupy only 5% of the area (Felfili et al. Reference Felfili, Mendonça, Walter, Ribeiro, Fonseca and Sousa-Silva2001). We list as ‘threatened’ those species recorded as ‘vulnerable, endangered, or critically endangered’ in the IUCN Red List (IUCN 2015).
Results
In the Virunga Landscape of Central Africa, 15 of the 21 of the region's threatened animals (all vertebrates) are associated with wetlands and/or valley bottoms for some or all of their lives. This list of 15 is conservative as we know too little to assess the habitat requirements of four of the other six species (two rodents and two shrews; Appendix S1).
In the Federal District of Brazil, three of four of the region's threatened animals (all invertebrates) are associated with wetlands. If we include a further six species, denoted ‘lower risk/conservation dependent’ and ‘needs updating’ in the IUCN Red List 2015 (each known only from a single collection at a single location), the summary rises to nine out of ten species (all invertebrates; Appendix S1).
SCALING UP
Introduction and approach
We sought to examine the relationship between soil carbon and species of conservation significance at larger scales using national data. We anticipated that both biodiversity and soil carbon would be positively associated with rainfall, so we also explored annual rainfall data to capture and explain variation in these indicators. We estimated mean topsoil carbon density for the portion of each country that lies within the tropics (% by weight in the top 0.3 m, source data described in Nachtergaele et al. Reference Nachtergaele, Van Velthuizen, Verelst, Batjes, Dijkshoorn, Van Engelen, Fischer, Jones, Montanarella, Petri and Prieler2008). We used a similar procedure for generating mean annual rainfall (Hijmans et al. Reference Hijmans, Cameron, Parra, Jones and Jarvis2005). Species information is derived from the summary compilations of country-level counts and densities in Roberts (Reference Roberts1998). We minimize the effects of country area on our comparisons of country-level species counts by analysing species densities (number of species/10 000 km2) as well as residuals from the linear regression between the log of species count and the log of country land area. We then use the resulting residuals as area-corrected counts (Table 1 and Appendix S2).
Table 1 Kendall's tau_b rank correlation (tau), associated probabilities (p) and number of countries included (n) for country mean topsoil carbon (% by weight) and country mean-annual-rainfall versus estimated species density per 10 000 km2, and regression residuals from log-log regressions of (log) total species counts, endemic and threatened taxa versus (log) country area. *Asterisks denote low probabilities (*≤ 0.05, **≤ 0.01, ***≤ 0.001). See Appendix S1 for more details on source data and data handling. na = Data were insufficient.

We also assessed IUCN data (2013) for threatened species (here threatened, critically endangered and extinct) country by country until we had at least 1000 threatened species (and stopped when every country included at that point was completed). As we wanted to focus on the tropics we included only countries with at least 70% of their area between 23°26′16″N and 23°26′16″S. This process yielded summaries for 37 tropical countries (n = 16 for Africa, n = 8 for the Americas, n = 6 for Asia and n = 7 for Island states). For each threatened species we determined which were specifically associated with wetlands and/or valley bottoms for some or all of their lives (i.e. swamps, mangroves and riparian forest), and which species were listed as being either habitat generalists or restricted to dry upland habitat (i.e. Terra Firme forest, savanna and grassland). See Appendix S3 for more detail on this assessment.
Results
Variation in total species densities (per 10 000 km2) for plants, mammals, birds, reptiles and amphibians is positively related to variation in mean topsoil carbon density (Table 1). These rank correlations are also observed within each continent (e.g. plants; Fig. 1 a). Similar rank correlations with carbon density were found for area-corrected counts of species including fish and for area-corrected counts of endemic species. The results for area-corrected counts of threatened species versus carbon density were also positive for plants, mammals, birds and reptiles though not for amphibians or fish (Table 1). All but two of the country level species measures were also positively correlated with country mean annual rainfall (averaged over the same tropical area used for our topsoil carbon assessment). The strength of these rank correlations follows a pattern similar to the rank correlations with mean topsoil carbon density (Table 1), and country carbon density is positively related to country mean-annual-rainfall (Fig. 1 b).
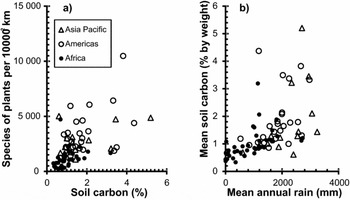
Figure 1 Example plots of (a) estimated plant species density (species per 10 000 km2) versus mean topsoil carbon density (% by weight for the top 0.3 m) for tropical countries by region and (b) country mean topsoil carbon density (% by weight for the top 0.3 m) versus country mean-annual-rainfall for tropical areas of countries with some portion in the tropics. The relation is positive and significant (p < 0.0005, n = 124, y = 0.0008x + 0.4409, R2 = 0.23). Residuals were negatively correlated with country area indicating some effects of scale and heterogeneity (Kendall's tau = -0.160, p = 0.008, n = 124).
Our more detailed assessment of the habitat requirements of listed threatened species included 1048 species, of which 85% are specifically associated with wetter habitats. While the pattern appears general it shows some regional variation; threatened species are strongly associated with alluvial habitat in Asia and the Americas and less so in Africa (Fig. 2 a), and are positively associated with rainfall (Fig. 2 b). Threatened plants, mammals, reptiles, amphibians and crustaceans all showed some association with wet lowland alluvial habitat, but birds appeared more evenly distributed among habitats (Fig 2 c).

Figure 2 The percentage of species in the IUCN categories vulnerable, threatened, critically endangered and extinct associated with low land alluvial lowland habitat (a) by continent (b) by rainfall and (c) by taxonomic group. Each plotted value represents one of 37 tropical countries (Africa [16], the Americas [8], Asia [6] and Island states [7]) that met these criteria (Appendix S1). 1048 species were examined. Horizontal bars are mean values with standard errors. (b) y = 0.011x + 57, R² = 0.27. The outlier arrowed near the bottom, the Solomon Islands, is not included in the regression. Not all countries provide data for all taxa, n = 14 for plants, n = 28 for mammals, n = 36 for birds, n = 24 for reptiles, n = 28 for amphibians, n = 4 for crustaceans and n = 15 for insects. Note only nine species were in the extinct category and make little difference to the overall pattern of results.
DISCUSSION
Our broad-brush review and analyses raises many questions. Better data on vulnerable soil carbon and its distribution will be required to answer most of them. Nonetheless our provisional analyses strongly suggest that natural habitats with more soil carbon often possess more species and more threatened species. These patterns hold for several groups of aquatic and terrestrial organisms. Our results are consistent with wetter, more carbon-rich, areas typically possessing more species and more species of conservation concern; and typically being under greater threat, than are drier less carbon-rich areas.
There are two levels of synergy associated with considering soil carbon in habitat protection: first that consideration of soil carbon greatly increases the total carbon storage associated with most natural habitats and second that soil carbon stocks are frequently greater where conservation needs are also greater. While the first is self-evident, the second has not previously been noted. The closest is the study by Venter et al. (Reference Venter, Meijaard, Possingham, Dennis, Sheil, Wich, Hovani and Wilson2009 b), which showed how carbon payments could substantially reduce the opportunity costs of protecting natural forests in Borneo from conversion – especially in the carbon-rich peat forests – if soil carbon were included in the calculations (these relationships are also explored by Murray et al. Reference Murray, Grenyer, Wunder, Raes and Jones2015).
If protection of soil carbon stocks can be translated into habitat preservation the benefits for species conservation could be considerable. Although our results appear promising we view them as provisional: better data are required. If only 3% of the global land surface possess about 30% of the total organic soil carbon (Gumbricht Reference Gumbricht2012) focusing on such areas (and on forests for their above- and below-ground carbon) offers a useful basis for setting priorities for wider habitat protection.
Here we briefly consider our results, their reliability and their implications.
Patterns
In Central Africa and Central Brazil, most threatened animal species are associated with habitats with comparatively carbon-rich soils. The pattern is also apparent at larger scales: in most tropical territories those with a greater percentage of carbon in their topsoil also tended to have more species, more endemic species and more threatened species. Of 1048 threatened species from 37 selected tropical countries, most (85%) are associated with wetlands or alluvial habitats; this preference is not only observed for taxa such as amphibians and crustaceans, where it might be anticipated, but also for mammals, plants and reptiles. Threatened birds are an exception; this is striking given that birds are so often used as indicators in conservation priority setting exercises (e.g. McCarthy et al. Reference McCarthy, Donald, Scharlemann, Buchanan, Balmford, Green, Bennun, Burgess, Fishpool and Garnett2012).
Data
Available information is inadequate to confidently assess all the key relationships. Indeed our larger-scale assessments rely on data that we ourselves have found to have limited accuracy (Ladd et al. Reference Ladd, Laffan, Amelung, Peri, Silva, Gervassi, Bonser, Navall and Sheil2013). We know too little about soil carbon stocks across landscapes, let alone how deep and how vulnerable they are. We do not even know the extent of deep peat soils in the tropics (Ghazoul & Sheil Reference Ghazoul and Sheil2010). Our identification of annual rainfall data as a potential proxy for both soil carbon and conservation values requires further exploration. We also note that improved characterization and measurement of wet versus dry habitat, and possibly of intermediate classes, may help prioritize habitats suitable for species of conservation concern.
Economics
Our argument assumes large-scale funding to reduce carbon emissions. Here is not the place to examine such schemes, but we can briefly respond to those who claim too much carbon is already available to support a viable market, namely that oversupply means prices are too low to encourage trade (Fearnside Reference Fearnside2013). For sceptics, adding soil carbon would exacerbate the oversupply problem and further decrease the viability of any payment schemes. Such claims ignore the scale of activities demanded. To make a sufficient difference a range of approaches is required. This necessitates inclusion of more costly options thus ensuring a reasonable carbon price (Fearnside Reference Fearnside2013).
Opportunities
Initiatives to protect soil carbon in natural habitats would offer multiple opportunities. These include improved protection of wetlands with migratory species (values captured in the RAMSAR Convention) and of mangrove forests that stabilize and protect coastlines and support fisheries (Murdiyarso et al. Reference Murdiyarso, Donato, Kauffman, Kurnianto, Stidham and Kanninen2009; Murdiyarso et al. Reference Murdiyarso, Purbopuspito, Kauffman, Warren, Sasmito, Donato, Manuri, Krisnawati, Taberima and Kurnianto2015). Developments within the IPCC, such as their Wetlands Supplement, suggest that such opportunities are gaining traction (IPCC Reference Hiraishi, Krug, Tanabe, Srivastava, Baasansuren, Fukuda and Troxler2013).
Incentives for maintaining carbon in soils would also encourage good land management practice more generally, such as maintaining natural vegetation along watercourses (Castelle et al. Reference Castelle, Johnson and Conolly1994). Protecting such vegetation benefits water quality, offers habitat for biodiversity and maintains landscape connectivity. Such sites often play a special role in supporting wildlife by producing food (young leaves, flowers and fruits), when water is scarce elsewhere due to seasonal effects or drought (MacNally et al. Reference MacNally, Bennett, Thomson, Radford, Unmack, Horrocks and Vesk2009). Considering soil carbon benefits could also help offset the cost of habitat restoration; evidence shows that restoration often increases both soil carbon and species diversity (Silva et al. Reference Silva, Corrêa, Doane, Pereira and Horwath2013 b).
Consideration of soil carbon could also guide and improve local scale choices in conservation planning. For example, if a habitat corridor is proposed connecting the two Mountain gorilla populations in the Virunga Landscape of Central Africa, then accounting for soil carbon might encourage incorporation of low-lying terrain that, despite its higher cost, can provide better habitat and result in improved connectivity for a greater number of threatened species. Further insight may be gained from examining how drainage patterns influence soil properties and how these patterns relate to carbon stocks and their vulnerability as well as the needs of species of conservation significance (Lowe et al. Reference Lowe, Likens and Power2006).
Challenges
The technical capacity and financing required to protect carbon stocks in the tropics brings challenges (Angelsen et al. Reference Angelsen, Brockhaus, Sunderlin and Verchot2012). A more complete accounting for soil carbon would raise multiple technical issues including assessment methods. Consider depth: many studies have only considered the top 20 or 30 cm, whereas deeper carbon stocks are often substantial (Harper & Tibbett Reference Harper and Tibbett2013). In tropical savannahs and forests the carbon stocks do not always decline with depth and the first metre of the soil profile may have several times as much carbon as the top 0.2 m (Silva et al. Reference Silva, Hoffmann, Rossatto, Haridasan, Franco and Horwath2013 a). Tropical peats (soils dominated by organic matter) can reach more than 15 m deep (Rieley et al. Reference Rieley, Page, Shepherd, Parkyn, Stoneman and Ingram1997). Though less rich in organic matter, mineral soils and subsoils can be much deeper, for example, in Surinam, bed rock may be more than 100 m below the surface (FAO 2001). More needs to be learned about deep soil carbon.
The IUCN assessments themselves contain various uncertainties including data-deficient species and possible biases in coverage, while the habitat descriptions are broad and unsuitable for fine-scaled analysis. The correlation between soil carbon and conservation values is a general pattern, a scatter of points rather than a tight linear relationship. There will be sites with high carbon soils and low biodiversity values, and sites with low carbon soils and high conservation values (Murray et al. Reference Murray, Grenyer, Wunder, Raes and Jones2015). Also, different considerations may yield other priorities. Consider the equatorial Asian rainforests: those on mineral soil typically possess more threatened terrestrial plant and animal species per hectare than nearby carbon-rich peat swamp forest (Slik et al. Reference Slik, Raes, Aiba, Brearley, Cannon, Meijaard, Nagamasu, Nilus, Paoli, Poulsen, Sheil, Suzuki, Van Valkenburg, Webb, Wilkie and Wulffraat2009). We suspect that examples such as these have persuaded many conservation biologists that the most carbon-rich sites are poor in biodiversity values. However, the biodiversity of these forests is only low when considered relative to those with the highest values on the planet and far surpasses most. Furthermore the rapid conversion of peat forest for oil palm cultivation and the poorly known aquatic biota in these systems might also influence our conservation value weightings (Venter et al. Reference Venter, Meijaard, Possingham, Dennis, Sheil, Wich, Hovani and Wilson2009 b; Meijaard & Sheil Reference Meijaard, Sheil and Levin2013). An evaluation of stenotopic fish associated with peat forests predicts 16 extinctions by 2050 due to habitat loss (Giam et al. Reference Giam, Koh, Tan, Miettinen, Tan and Ng2012). Similar patterns may occur elsewhere.
Carbon payments can help protect habitat but they are no panacea (Angelsen et al. Reference Angelsen, Brockhaus, Sunderlin and Verchot2012; van Noordwijk et al. Reference van Noordwijk, Agus, Dewi and Purnomo2014). Achieving net conservation benefits from synergies with carbon stocks requires that carbon finance does not substitute conventional conservation funding. Threatened species outside carbon-rich sites (e.g. many birds) also require conservation and resources will still be needed to address hunting, over-harvesting, invasive species and other biodiversity threats.
Addressing information needs
Many uncertainties exist in quantifying the distribution of soil carbon vulnerable to habitat change and in gaining accurate measures of conservation value. We highlight the value of biologists and soil scientists working together to better characterize these patterns and their inter-relationships. Developing the capacity to improve knowledge of soil carbon in natural and modified habitats appears a surmountable problem: most countries provide training in soil sciences with a focus on agriculture, and if more funds are directed to quantifying and monitoring soil carbon more generally, this will provide an incentive to develop the necessary skills.
CONCLUSIONS
Despite shortcomings in available data, it seems clear that natural habitats with greater soil carbon stocks are often associated with more species and also more threatened species than those with less soil carbon. We have looked at this in multiple ways and each indicates this relationship.
Fifteen of twenty one and nine of ten animal species of conservation concern in Central Africa and in Central Brazil, respectively, rely on carbon-rich wetland habitats. At the country level the densities of species of plants, mammals, birds, reptiles, amphibians and fish, as well as the densities of endemics and threatened taxa in these same groups, tend to be positively correlated with mean soil carbon content (threatened amphibians and threatened fish are exceptions). Looking at what we know about 1048 threatened species we find evidence that 85% rely on wetlands or carbon-rich alluvial habitats to a significant degree. This tendency is observed for plants, mammals, reptiles, amphibians and crustaceans but not for birds.
In total our results indicate that wetter, more carbon-rich, habitats harbour more species of conservation significance, than do drier less carbon-rich habitats. These carbon-rich habitats, and their biota, are also under greater threat from human activities, which further accentuates the conservation significance of these areas and their species. Current data appear inadequate to fully explore these relationships with confidence.
We note that annual rainfall measurements have potential as indicators of soil carbon densities and also of conservation values at larger scales. High soil fertility and adequate water supply have led to the conversion of many lowland-alluvial habitats to agriculture or plantations. Including soil carbon in funding schemes to reduce global carbon emissions could increase the funds available to protect natural habitats. The spatial correlation between patterns of soil carbon and patterns of threatened biodiversity suggest significant opportunities for biodiversity conservation if soil carbon protection was a marketable benefit. Protecting sites with high conservation value will safeguard large stocks of carbon from being emitted into the atmosphere and often protecting sites with high soil carbon will contribute significantly to biological conservations. The scale of the possible synergies and benefits highlights that the relationship between tropical soil carbon and biodiversity values deserves recognition and evaluation.
ACKNOWLEDGEMENTS
DS and BL conceived the study, developed the analyses and led on writing the paper. LS, SL and MvH contributed data and suggestions. All authors contributed to and approved the final text. We declare no conflicts of interest. We thank Les Christadis, Xingli Giam, Meine van Noordwijk, Nicholas Polunin and reviewers for their comments on earlier texts. No specific grants were involved in writing this article though this paper contributes to the outputs of the Australian Research Council project LP130100498 and no conflicts of interest were recognized.
SUPPLEMENTARY MATERIAL
To view supplementary material for this article, please visit http://dx.doi.org/10.1017/S0376892916000011


