


INTRODUCTION
Two theoretical frameworks have been proposed to explain how abiotic changes along stream gradients interact to drive changes in riparian communities. First, the river continuum concept suggests that animal assemblages shift along stream gradients adaptively in response to concurrent changes in physical and chemical parameters (Vannote et al. Reference VANNOTE, MINSHALL, CUMMINS, SEDELL and CUSHING1980). Second, the river zonation concept suggests that changes in stream geomorphology along gradients drive changes in biotic communities (Covich Reference COVICH1988, Hynes Reference HYNES1971, Ramírez & Pringle Reference RAMÍREZ and PRINGLE2001). Together, these two broad concepts in stream ecology predict biological communities to change along riparian gradients.
In Neotropical forests of Central and South America, glass frogs (Centrolenidae) are a species-rich family of anurans that are specialized to riparian habitats. Centrolenids reproduce almost exclusively by ovipositing on riparian vegetation or structures above lotic water (Guayasamin et al. Reference GUAYASAMIN, CASTROVIEJO-FISHER, TRUEB, AYARZAGÜENA, RADA and VILÀ2009, Kubicki Reference KUBICKI2007, Savage Reference SAVAGE2002). Egg survival has been linked to oviposition in wet microhabitats and parental care that maintains moisture (Delia et al. Reference DELIA, RAMÍREZ-BAUTISTA and SUMMERS2013, Jacobson Reference JACOBSON1985). After the developmental period, larvae hatch and drop into the stream below to grow aquatically as tadpoles until metamorphosis. Breeding phenology is thought to be seasonally linked to rainfall (Rios-Soto et al. Reference RIOS-SOTO, OSPINA-L and VARGAS-SALINAS2017, Savage Reference SAVAGE2002), although this hypothesis has not been rigorously tested. Most studies of glass frogs to date have examined aspects of reproduction (Delia et al. Reference DELIA, RAMÍREZ-BAUTISTA and SUMMERS2013, Greer & Wells Reference GREER and WELLS1980, Hayes Reference HAYES1991, Jacobson Reference JACOBSON1985, Mangold et al. Reference MANGOLD, TRENKWALDER, RINGLER, HÖDL and RINGLER2015, McDiarmid Reference MCDIARMID and Janzen1983) or population demography (McCaffery & Lips Reference MCCAFFERY and LIPS2013). However, no studies have described patterns of centrolenid community structure, and, in general, glass frogs have been a historically understudied group among Neotropical anurans (Donnelly Reference DONNELLY, McDade, Bawa, Hespenheide and Hartshorn1994).
In an attempt to better understand variation in glass frog community structure, preliminary survey efforts were performed in first-order streams at La Selva Biological Station, Costa Rica during 2014. These data suggested that two species of glass frog, Teratohyla spinosa and Espadarana prosoblepon, have consistent occupancy and apparently high abundance in first-order streams, while the other five species known to occur at the site (Guyer & Donnelly Reference GUYER and DONNELLY2005) are absent in those habitats (B.F. unpubl. data). Given the strong association between glass frogs and riparian habitats, the river zonation hypothesis predicts centrolenid community assembly to vary along riparian gradients, such that other species present in the regional species pool may be occupying different sites along the stream gradients at La Selva. Thus, the river zonation hypothesis predicts that patterns of glass frog diversity and community assembly should vary along the riparian gradient at La Selva Biological Station and at other comparable sites.
In this study, we tested whether the glass frog assemblage at La Selva, Costa Rica, conforms to predictions of the river zonation hypothesis. We performed calling frog surveys to evaluate whether patterns of species occupancy, community assembly and diversity vary across a large riparian gradient. Because arboreal amphibians can be difficult to detect, we used analyses that modelled detection probability to estimate site occupancy and abundance. We developed four a priori hypotheses for how α-diversity and β-diversity could vary across the stream-order gradient (nested assemblages, intermediate richness, species replacement and null; Table 1), and we evaluated support for these hypotheses using information-theoretic methods.
Table 1. Hypothetical models for how community assembly of riparian frogs could be shaped along a riparian gradient at La Selva Biological Station, Costa Rica. Alpha (α) diversity describes species richness; beta (ß) diversity describes changes in community assembly, as measured by the Sørensen dissimilarity index. See Figure 2 for graphed illustrations of the model predictions.

MATERIALS AND METHODS
Study area and focal taxa
La Selva is a private reserve in the Caribbean lowlands of north-eastern Costa Rica (10.42°N, 84.02°W) that is owned and operated by the Organization for Tropical Studies. La Selva is characterized by an average temperature of 25.8°C, receives c. 4 m y−1 of precipitation (Sanford et al. Reference SANFORD, PAABY, LUVALL, PHILLIPS, McDade, Bawa, Hespenheide and Hartshorn1994), and is characterized as within Holdridge's Tropical Wet Forest life zone (McDade & Hartshorn Reference MCDADE, HARTSHORN, McDade, Bawa, Hespenheide and Hartshorn1994). Rainfall is seasonal, with the vast majority of rain occurring during a wet season from May–December relative to a dry season from January–April. Altitude ranges from 30–130 m asl.
We selected 25 study sites to survey for breeding anuran activity (i.e. calling frogs). Study sites were selected to encompass the variation of riparian habitats existing at La Selva, by spanning a gradient from small to large stream sizes. We visually examined maps of La Selva's streams and used Strahler's stream-order system (Strahler Reference STRAHLER1957) to identify and select study-site localities in five categories – first, second, third, fourth and fifth-order streams. Sites were then visited to confirm the occurrence of flowing water prior to inclusion in the study. Five sites were selected for each category, except for first (N = 6) and second-order (N = 4) categories. When possible, sites were selected to be interspersed among different drainages across the alluvial landscape and within La Selva, to account for any effects of drainage identity, soil type, and/or flooding frequency on community structure. No preliminary calling frog surveys were performed when selecting sites. Locations of study sites are listed in Appendix 1.
Seven species of centrolenid frog have been reported from La Selva (Guyer & Donnelly Reference GUYER and DONNELLY2005, Savage Reference SAVAGE2002) and were surveyed for site occupancy and abundance: Cochranella granulosa (granulated glass frog), Espadarana prosoblepon (emerald glass frog), Hyalinobatrachium fleischmanni (Fleischmann's glass frog), Hyalinobatrachium valerioi (reticulated glass frog), Teratohyla pulverata (powdered glass frog), Teratohyla spinosa (spined glass frog) and Sachatamia albomaculata (yellow-flecked glass frog) (Figure 1). Diasporus diastema (tink frog; Eleutherodactylidae) is another common species of arboreal anuran that is frequently encountered in riparian habitats and was included in our survey efforts. Nomenclature follows Guayasamin et al. (Reference GUAYASAMIN, CASTROVIEJO-FISHER, TRUEB, AYARZAGÜENA, RADA and VILÀ2009), with the common English names from Guyer & Donnelly (Reference GUYER and DONNELLY2005).

Figure 1. Eight species of riparian anuran that were sampled for site occupancy at La Selva Biological Station, Costa Rica: Cochranella granulosa (granulated glass frog) (a), Espadarana prosoblepon (emerald glass frog) (b), Hyalinobatrachium fleischmanni (Fleischmann's glass frog (c), Hyalinobatrachium valerioi (reticulated glass frog) (d), Teratohyla pulverata (powdered glass frog) (e), Teratohyla spinosa (spined glass frog) (f), Sachatamia albomaculata (yellow-flecked glass frog) (g), Diasporus diastema (tink frog) (h).
Sampling methods
We sampled anuran site occupancy by monitoring for calling frogs. Auditory surveys to detect calling frogs are a common standard method for determining species presence/absence in aquatic systems (Dorcas et al. Reference DORCAS, PRICE, WALLS, BARICHIVICH and Dodd2009, Heyer et al. Reference HEYER, DONNELLY, MCDIARMID, HAYEK and FOSTER1994) that provide an easy method to collect occupancy and abundance data without physically capturing animals. We sampled sites using a stratified random sampling design from 17 June–1 August 2015. Surveys (N = 8) were divided into three sampling blocks comprising three, three and two surveys. Within each block, sites were sampled on consecutive nights, in an attempt to control for environmental variables which may vary between nights within sampling blocks and seasonal variables that may vary across sampling blocks during the study. Each survey was performed for 4 min, during which we recorded the presence and abundance of each species detected. Abundance was estimated based on the number of distinct vocalizing males heard and was recorded as an integer from 0–10; for situations when more than 10 males were calling and it was difficult to assign an exact number, we recorded these situations as >10. Because breeding activity and vocalization can vary by both season and environmental conditions within seasons (e.g. precipitation, temperature; Bridges & Dorcas Reference BRIDGES and DORCAS2000, Smith et al. Reference SMITH, BARICHIVICH, STAIGER, SMITH and DODD2006, Steen et al. Reference STEEN, MCCLLURE and GRAHAM2013), we sought to measure how well the survey method can detect species when they are present at sites (detection probability), and the environmental variables that influence the detection process. Thus, we measured the ambient temperature using a thermometer, and recorded qualitative assessments of precipitation (none, light, moderate, heavy, or torrential) and cloud cover (clear, partly cloudy, or overcast).
We used calling surveys because our previous experiences at La Selva indicated that other standard methods for sampling tropical anurans (e.g. visual-encounter surveys, mark-recapture surveys) have extremely low detection probability in higher-order sites where species most frequently occupy habitat 5–20 m above the ground and are not readily sampled by hand. However, calling surveys can provide an alternative and effective method for surveying the occupancy of frogs by increasing detection probability for species that are otherwise difficult to survey with standard methods, allowing us to more accurately determine site occupancy of species.
Statistical analyses
Occupancy and abundance models
We developed 16 models explaining how different covariates (temperature, precipitation, stream order) may influence detection probability and site occupancy (stream order) for species (Table 2). We included stream order as a hypothesis influencing detection probability in our model set because our ability to detect frog vocalizations may be a function of habitat structure varying across the riparian gradient (sensu Darras et al. Reference DARRAS, PÜTZ, FAHRURROZI and TSCHARNTKE2016).
Table 2. Models used to evaluate anuran site occupancy (ψ) and detection probability (p) at 25 stream localities in La Selva Biological Station, Costa Rica. The same 16 models were also used to estimate abundance in the N-mixture models (Appendix 2). Stream – stream order (Strahler Reference STRAHLER1957); precip – precipitation; temp – temperature (°C).

To evaluate these hypotheses, we sought to understand abundance across the landscape using analytical methods that account for imperfect detection (Mazerolle et al. Reference MAZEROLLE, BAILEY, KENDALL, ROYLE, CONVERSE and NICHOLS2007). We built single-season occupancy models (MacKenzie et al. Reference MACKENZIE, NICHOLS, LACHMAN, DROEGE, ROYLE and LANGTIMM2002) which estimated detection probability and occupancy abundance with eight different combinations of covariates influencing occupancy and detection for each species. We built models for a subset of species in the study (N = 5), which were detected at enough sites to build relatively robust models describing occupancy and detection. Models were ranked using Akaike's Information Criterion (AIC); we used the most well supported model for inference, but also considered covariates included within the top-model set (ΔAIC ≤ 2; Burnham & Anderson Reference BURNHAM and ANDERSON2002) as being useful for inference. Because D. diastema occupied all sites surveyed, we restricted the model selection process to only evaluate hypotheses relating to detection for this species.
To estimate abundance of species at each site, we used the latent N-mixture model for point count data from Royle (Reference ROYLE2004). We set the latent abundance distribution as a zero-inflated Poisson variable, because these models performed better than when it was modelled as a Poisson and negative-binomial distribution. We built and ranked models describing each hypothesis (Table 2), and we then estimated abundance with the top model using empirical Bayes methods.
Community assembly
To visualize how patterns of community assembly varied across stream order at La Selva, we used the abundance estimates from the top N-mixture model for each species to generate a matrix of species presence and abundance among sites. We first visualized assembly by plotting the relative proportion of species among pooled sites within each stream order and tested for different species proportions using a Pearson's Chi-squared test. We then constructed non-metric multidimensional scaling (NMDS) plots with Jaccard's shortest dissimilarity measure to represent community assembly on a non-metric scale. NMDS is an ordination technique that describes the dissimilarity local assemblages as points in low-dimensional space. We evaluated whether the ordination accurately described variation with a stress function ranging from 0–1, where values <0.20 suggested that ordinations accurately represented dissimilarity among samples. We categorized samples based on stream order and plotted ordination ellipses around those groups based on the 95% confidence intervals of each treatment's centroid. We used permutation multivariate analysis of variance (PERMANOVA) to (1) test for assemblage-level differences across all stream categories, and (2) to test for pairwise differences between stream categories, with Bonferroni correction of P values (Rice Reference RICE1989). We identified species that were significantly characteristic of different stream categories using an indicator species analysis (Dufrêne & Legendre 1997); statistical significance was determined with 1000 Monte Carlo simulations. Because D. diastema was the most dominant species at all sites, we also performed a second ordination analysis without D. diastema to better understand centrolenid assembly across the landscape. Last, Donnelly (Reference DONNELLY, McDade, Bawa, Hespenheide and Hartshorn1994) predicted that population density of riparian anurans at La Selva may be greater in smaller-order streams. We tested this prediction using a linear mixed-effects model (LME) with a Poisson distribution and species as a random effect.
Model-testing landscape diversity
To understand how community composition of riparian frogs could vary across the landscape at La Selva, we developed multiple hypothetical models with distinct predictions for how species richness (α-diversity) and species turnover (β-diversity) could vary among sites. To test predictions from these models, we used the survey data to calculate the Chao's species richness estimate at each site (α-diversity; Chao Reference CHAO1987) and used the species abundance matrix from the N-mixture models to measure change in community composition across sites (β-diversity) using the Sørensen index. The Sørensen index uses species presence-absence data to estimate species turnover among sites where values near or equal to one indicate similar or identical assemblages, while more dissimilar assemblages have lower values. We used the Sørensen index because our primary hypotheses and predictions involved understanding how communities structure differed given the presence or absence of species, rather than other β-diversity indices that describe changes in assemblage structure based on differences in abundance.
We conceived four hypothetical models explaining how α- and β-diversity could vary distinctly: a null model, a nested assemblages model, an intermediate richness model and a species replacement model (Table 1). Each of these models generates distinct predictions for how α- and β-diversity are characterized along the stream-order gradient (Table 1, Figure 2). The null model predicts that community assembly does not vary with stream order, such that α- and β-diversity have slopes ~0 and a y-intercept of ~1. The nested assemblage model describes increasing species richness with stream order (α-diversity has a positive slope) and low-order assemblages to be nested subsets within those at higher orders (β-diversity has a negative slope; i.e. similar to a nestedness model, sensu Baselga Reference BASELGA2013). The intermediate richness model predicts that species richness is highest and assemblage structure overlaps at streams of intermediate size; this model describes α-diversity as −x2 function, and for β-diversity to decrease at an accelerating rate with stream order (−2x). Last, the species replacement model predicts that species replace each other along the gradient, such that assemblages are unique to different stream orders; this model predicts that α- and β-diversity have slopes ~0, but that β-diversity has y-intercept for <1. These models are similar to β-diversity models of nestedness (nested assemblages model) and turnover (intermediate-richness and species-replacement models) from Baselga (Reference BASELGA2013). Given the predictive model structure of each candidate hypothesis (Table 1), we built generalized linear models describing α- and β-diversity and assessed which model best fitted the data using Akaike's Information Criterion adjusted for small sample sizes (AICc; Burnham & Anderson Reference BURNHAM and ANDERSON2002).

Figure 2. Hypothetical patterns for how species richness (α-diversity; a) and species turnover (β-diversity; b) may vary for riparian anurans along a stream-order gradient at La Selva Biological Station, Costa Rica. Each model (null model, nested assemblages, intermediate richness, unique assemblages) generates distinct linear predictions for how α- and β-diversity should be characterized along the gradient (Table 1).
We performed all analyses using the statistical program R version 3.2.1. We used the package ‘unmarked’ (Fiske & Chandler Reference FISKE and CHANDLER2011) and the functions ‘occu()’ and ‘pcount()’ to build the occupancy and point-count models. We used the packages ‘vegan’ to perform NMDS and PERMANOVA, ‘labdsv’ for the indicator species analysis and ‘lme4’ for the linear mixed-effects models. Our data and R code are available upon request.
RESULTS
We recorded calling activity of seven frog species during 200 surveys across the 25 sites. Diasporus diastema was the most frequently recorded species, as it was detected during almost all surveys (N = 199). Teratohyla spinosa was recorded during 118 surveys, while T. pulverata and H. fleischmanni were recorded during 55 and 53 surveys, respectively. Espadarana prosoblepon was detected during 40 surveys. Of the species detected, Hyalinobatrachium valerioi and Sachatamia albomaculata were recorded the least: H. valerioi was recorded only seven times across two sites, and S. albomaculata was only detected once at a single site. Cochranella granulosa was not detected during the study period. Because H. valerioi and S. albomaculata were recorded so infrequently, we focused the analyses on the five species most frequently encountered: E. prosoblepon, H. fleischmanni, T. pulverata, T. spinosa and D. diastema.
Occupancy and abundance models
The model-selection process for the occupancy models identified top models explaining site occupancy and detection probability which varied among species (Table 3). Espadarana prosoblepon and D. diastema did not vary in occupancy across the landscape, as those species were respectively estimated to have occurred at half and all of sites, irrespective of stream order (Figure 3). Occupancy of H. fleischmanni, T. pulverata and T. spinosa varied across the stream-order gradient. Hyalinobatrachium fleischmanni and T. pulverata occupied >0.90 of fourth and fifth-order sites, but predicted occupancy of first and second-order streams was 0–0.15. Conversely, T. spinosa was characterized by the opposite pattern; occupancy was 0.83 at first-order streams but decreased slightly to 0.78 in fifth-order streams.
Table 3. Number of parameters, Akaike's Information Criterion (AIC), ΔAIC, and model weight of models built to describe site occupancy (ψ) and detection probability (p) from single-season occupancy models (MacKenzie et al. Reference MACKENZIE, NICHOLS, LACHMAN, DROEGE, ROYLE and LANGTIMM2002) of four species of glass frog (Espadarana prosoblepon, Hyalinobatrachium fleischmanni, Teratohyla spinosa, Teratohyla pulverata) and Diasporus diastema at La Selva Biological Station, Costa Rica. Modelled covariates are stream-order (stream), precipitation (precip) and temperature (temp). Only the top-model set (ΔAIC≤2) is shown for each species.


Figure 3. Estimated relationships of how the proportion of sites occupied (occupancy; psi) varied by stream order and the probability of detecting species at sites where they occur (detection probability; p) varied by temperature and precipitation for five riparian anurans at La Selva Biological Station, Costa Rica: Espadarana prosoblepon (a–c), Hyalinobatrachium fleischmanni (d–f), Teratohyla pulverata (g–i), Teratohyla spinosa (j–l), and Diasporus diastema (m–o). Ambient precipitation during surveys was scored as 0 = none, 1 = light, 2 = medium, 3 = heavy, 4 = torrential. Species differed in patterns of occupancy along the riparian gradient; however, detection probability decreased with ambient temperature and increased with ambient precipitation for all four centrolenid frogs. Occupancy and detection estimates were generated after model-averaging across a candidate model set (Table 1).
Detection probability of E. prosoblepon, H. fleischmanni, T. pulverata and T. spinosa decreased with temperature and increased with precipitation (Figure 3). Espadarana prosoblepon, H. fleischmanni and T. pulverata had high detection (0.78–0.90) during cooler temperatures (20°C); detection decreased to as little as 0.22–0.35 as temperature increased to 29°C. Detection of T. spinosa also decreased during warmer temperatures, but the relationship was not as strong for this species. During surveys with no precipitation, detection was low for E. prosoblepon, H. fleischmanni, T. pulverata (less than 0.50 each) and T. spinosa (0.65); however, light to moderate rainfall increased detection to >0.90 for most species. Detection of D. diastema was not found to vary by ambient temperature or precipitation: this species was always vocalizing and highly detectable, irrespective of weather conditions (Figure 3).
Model-selection for the N-mixture abundance models identified top-models explaining abundance and detection probability as varying among species (Appendix 2), but generally included the same covariates in the top-model set as the occupancy models (Table 3).
Community assembly
The relative proportion of species estimated by N-mixture abundance models varied significantly by stream order (χ2 = 266, df = 16, P < 0.0001; Figure 4). Non-metric MDS plots also found distinct assemblage structure by stream order, as 95% confidence ellipses of cluster centroids generally showed separation between fifth-order streams and all other categories (Figure 5). Ordinations recorded stresses of 0.084 and 0.038, respectively, after two iterations at two dimensions. PERMANOVA found assemblages to vary significantly across stream order, both with and without D. diastema in the analysis (Table 4). Pairwise comparisons could not distinguish between two assemblage groups: first and second-order assemblages, and those at second, third and fourth-order sites. The assemblage at fifth-order sites was found to be distinct from all others. Three species were found to be characteristic of stream categories: E. prosoblepon was significantly characteristic of fourth-order streams (P = 0.020), while T. pulverata and H. fleischmanni were significantly characteristic of fifth-order streams (P = 0.001, P = 0.006, respectively). A linear mixed-effects model found frog abundance to increase along the stream-order gradient (β = 0.88; 95% CI = 0.39–1.39; P < 0.001).

Figure 4. Abundance estimates of five riparian frogs along a riparian gradient at La Selva Biological Station, Costa Rica. Abundance estimates were derived from N-mixture abundance models (see Methods); sites were pooled by stream size using the Strahler (Reference STRAHLER1957) stream-order system. Asterisks indicate species significantly characteristic of a stream order, as determined by indicator species analysis. DIADIA = Diasporus diastema; TERSPI = Teratohyla spinosa; TERPUL = Teratohyla pulverata; HYAFLE = Hyalinobatrachium fleischmanni; ESPPRO = Espadarana prosoblepon.
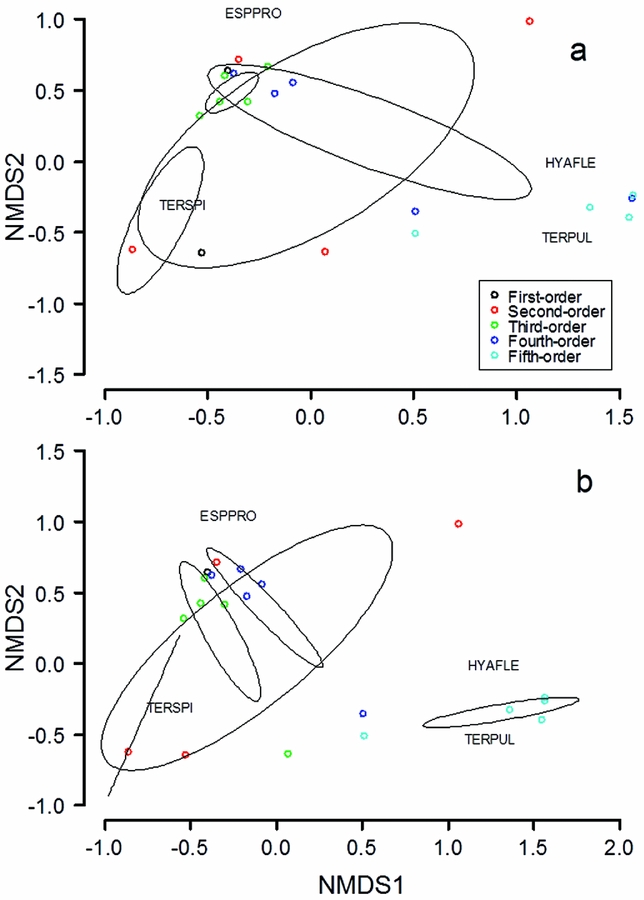
Figure 5. Non-metric multidimensional scaling (NMDS) plots describing assemblage-level variation of riparian anurans along a riparian gradient at La Selva Biological Station, Costa Rica. Points more closely situated are more similar in local community composition than more distant points. Black ellipses indicate 95% confidence intervals for clusters of each stream category. Stress values indicate a measure of distortion as a result of the ordinations being described in two-dimensional space. Species abbreviations are as in Figure 4. Dataset of five species (four centrolenids and Diasporus diastema) (a); centrolenid species only, with one first-order site removed because D. diastema was the only species recorded there during the study (b).
Table 4. P values associated with permutational analysis of variance (PERMANOVA) tests of variation in riparian anuran community structure at La Selva Biological Station, Costa Rica. Columns and rows indicates stream categories based on the Strahler (Reference STRAHLER1957) stream-order system, from first to fifth order (1–5). Analyses of four centrolenids + Diasporus diastema; analyses of a dataset restricted to centrolenid species only.

Model-testing landscape diversity
Among the models considered, our model selection process most strongly supported the nested assemblages model (Table 5). For α-diversity, this model received model weight of 0.85; relative to the second-best model, the top model was over five times more likely to be the true best model. For β-diversity, the nested assemblages model was most strongly supported (model weight = 0.78) and received c. three times more support than the next best model. The y-intercept of the nested assemblage model did not differ from 1 (0.96 ± 0.06 SE), but this metric did deviate from 1 for the other models constructed (Table 5).
Table 5. Number of parameters, Akaike's Information Criterion adjusted for small sample size (AICc), ΔAICc, model weight, and log-likelihood of candidate models (Table 1) built to describe patterns of species richness (α-diversity) and species turnover (β-diversity) of riparian frogs at La Selva Biological Station, Costa Rica. Because the Null and Species replacement models had the same predictive structure for slope and varied only in the position of the Y-intercept for beta diversity, we only built one model to avoid redundancy. We only report Y-intercept values for β-diversity, because this was the only variable of the two for which we had a priori predictions for that metric. *indicates significantly different from 1.

DISCUSSION
We found patterns of glass frog occupancy and abundance that varied across a stream-order gradient at La Selva. Within the riparian assemblage, species exhibited trends in site occupancy that conformed to three general patterns along the gradient from low- to high-order streams: (1) decreasing occupancy (T. spinosa), (2) increasing occupancy (H. fleischmanni, T. pulverata), and (3) occupancy independent of stream order (E. prosoblepon, D. diastema). Together, species-specific patterns in occupancy and abundance drove significant assemblage-level variation along the stream-order gradient. Variation in community structure largely separated (1) first- and second-order streams relative to all others, (2) fifth-order streams distinct from all others and (3) overlap in community structure at intermediate stream sizes. This is the first study to describe significant variance in centrolenid community assembly at any spatial scales. We suggest that this variance is consistent with predictions of the river continuum and zonation concepts, and we add centrolenid frogs to a growing list of Neotropical organisms that are characterized by patterns of community assembly that vary predictably along riparian gradients (Covich Reference COVICH1988, Hynes Reference HYNES1971, Ramírez & Pringle Reference RAMÍREZ and PRINGLE2001). However, glass frogs provide an interesting case for the river zonation model, because they are largely arboreal but only use aquatic habitat as larvae.
The examination of variance in α- and β-diversity across the stream-order gradient found strongest support for a model where assemblages are nested subsets with increasing α-diversity along the stream-order gradient. Our results are consistent with previous studies that found community structure of riparian anurans to vary with stream size in tropical forests (Eterovick & Barata Reference ETEROVICK and BARATA2006, Inger & Voris Reference INGER and VORIS1993, Keller et al. Reference KELLER, RÖDEL, LINSENMAIR and GRAFE2009). However, our support for increasing α-diversity is contrary to previous studies that found stream size to be a poor predictor of anuran species richness (Eterovick Reference ETEROVICK2003, Eterovick & Barata Reference ETEROVICK and BARATA2006). Our results from La Selva, Costa Rica generate predictions for how glass frog community assembly may vary across riparian gradients at other localities.
A diverse suite of abiotic or biotic factors (Wellborn et al. Reference WELLBORN, SKELLY and WERNER1996) may be driving changes in the riparian frog assemblages along the stream gradients at La Selva. Ultimately, the abundance of each species within an assemblage is driven by population demography, such as female fecundity and the survival of eggs, larvae, metamorphs and/or adults. Future studies should seek to understand factors influencing population demography of species along the gradient; in particular, we point to centrolenid reproduction and larval life history as being promising for this pursuit (Hoffmann Reference HOFFMANN2010), because those two features are intrinsically linked to the riparian habitat that was linked with variation in population and community structure here. Further, we did not observe turnover in occupancy or abundance of D. diastema, a species that was extremely abundant across all sites at La Selva. Diasporus diastema likely does not conform to predictions of the river zonation model because it is not restricted to aquatic habitat for reproduction. Rather, D. diastema lays eggs in arboreal habitats (Ovaska & Rand Reference OVASKA and RAND1999) which develop directly into small frogs and lacks a larval stage (Savage Reference SAVAGE2002).
Previous natural history accounts for centrolenids have suggested that reproduction primarily occurs during the wet season (Savage Reference SAVAGE2002), and a recent study of Centrolene quindianum found calling activity and oviposition to be greatest during wetter and cooler months during the wet season in Colombia (Rios-Soto et al. Reference RIOS-SOTO, OSPINA-L and VARGAS-SALINAS2017). We observed strong effects of temperature and precipitation on breeding activity of four centrolenid species at La Selva, where calling behaviour was greatest on cool and wet nights. While our results are similar and consistent to previous studies describing seasonal reproduction linked to precipitation, our results suggest that reproduction is also influenced by environmental variables at shorter temporal scales within seasons. Reproduction may be highest during wet nights with cooler temperature because wet, humid and cool conditions during and after oviposition may increase hydration of egg masses and reduce mortality due to desiccation (Delia et al. Reference DELIA, RAMÍREZ-BAUTISTA and SUMMERS2013). Thus, our results support the generality of the hypothesis that glass frogs breed during wet conditions to aid in egg hydration, which may drive variance in reproductive effort that varies seasonally with rainfall.
Riparian frogs remain the least studied assemblage of frogs at La Selva. Donnelly (Reference DONNELLY, McDade, Bawa, Hespenheide and Hartshorn1994) hypothesized that this research bias results from riparian frogs reproducing less frequently and occurring in lower densities in the large stream habitats most proximate to the station's facilities, because those streams support a conspicuous assemblage of fish. She then hypothesized that areas with greater relief, smaller streams and fewer fish located more remotely in the reserve may support more abundant assemblages of riparian frogs. Contrary to this prediction, we found that riparian frog abundance increased along the stream-order gradient; glass frogs were most abundant at larger-order streams and rivers at La Selva. Rather, we suggest that the historical paucity of riparian frog research at La Selva may be more simply explained by detectability: in larger streams near the station's facilities, glass frogs are using habitat in trees at great heights over the water (>20 m), where they are undetectable by visual survey methods. For example, we observed glass frogs calling, amplexing and ovipositing in canopy trees over large rivers (e.g. Río Puerto Viejo). Contrary to previous accounts describing glass frog habitats as being restricted to small- to middle-order streams, we observed the greatest glass frog abundance at La Selva in the largest riparian habitat available, fourth- and fifth-order streams.
In conclusion, we found assemblages of riparian glass frogs to vary across the landscape in ways consistent with the river zonation hypothesis. Patterns of community assembly were best characterized by models where assemblages are nested subsets with increasing α-diversity along the stream-order gradient. Future studies should seek to understand how demographic variation within species contributes to patterns of community assembly along the riparian gradient at La Selva. Because our study was simple and relatively easy to implement, our methods provide an easy opportunity for replication at other sites and for long-term monitoring of the riparian frog assemblage at La Selva.
ACKNOWLEDGEMENTS
This project was funded by a National Science Foundation Research Experience for Undergraduates program at La Selva Biological Station. B.F. was supported by a Cunningham Foundation Graduate Research Assistantship from the Auburn University Museum of Natural History. Siena College provided support to present the results at the 2015 Joint Meeting of Ichthyologists and Herpetologists. We thank Carissa Ganong, the staff of La Selva (B. Matarita, D. Brenes), and the Organization for Tropical Studies for tremendous support during our efforts. Craig Guyer helped us conceptualize the study. We thank G. Brenes Zamora, C. Irian, R. Sandí for companionship in the field and/or help with data analysis. Jason Folt graciously provided photographs for Figure 1. J. Goessling, W. Stiles, R. John, M. Miller and an anonymous reviewer provided comments that helped the manuscript. N.R. thanks C. Harbison and S. Vernooy for helpful support. This paper is contribution no. 873 of the Auburn University Museum of Natural History.
Appendix 1. Study sites monitored for nocturnal calling frog activity during June–August 2015 at La Selva Biological Station, Costa Rica. Sites were selected to encompass the variation of riparian habitat at La Selva and to span a gradient from first- to fifth-order streams (Strahler Reference STRAHLER1957). *coordinates estimated from map.

Appendix 2. Number of parameters, Akaike's Information Criterion (AIC), ΔAIC, and model weight of models built to describe site abundance (N) and detection probability (p) using N-mixture models with latent abundance as a zero-inflated Poisson variable for Espadarana prosoblepon, Hyalinobatrachium fleischmanni, Teratohyla spinosa, Teratohyla pulverata and Diasporus diastema at La Selva Biological Station, Costa Rica. Modeled covariates are precipitation (precip), temperature (temp), and stream order (stream). Only the top-model set (ΔAIC < 2) is shown for each species.


